. 2023 May 22;62(22):e202302303.
doi: 10.1002/anie.202302303. Epub 2023 Apr 20.

Enzyme-Triggered Chemodynamic Therapy via a Peptide-H2 S Donor Conjugate with Complexed Fe2

Affiliations

Enzyme-Triggered Chemodynamic Therapy via a Peptide-H2 S Donor Conjugate with Complexed Fe2

Yumeng Zhu et al. Angew Chem Int Ed Engl. .

Abstract

Inducing high levels of reactive oxygen species (ROS) inside tumor cells is a cancer therapy method termed chemodynamic therapy (CDT). Relying on delivery of Fenton reaction promoters such as Fe2+ , CDT takes advantage of overproduced ROS in the tumor microenvironment. We developed a peptide-H2 S donor conjugate, complexed with Fe2+ , termed AAN-PTC-Fe2+ . The AAN tripeptide was specifically cleaved by legumain, an enzyme overexpressed in glioma cells, to release carbonyl sulfide (COS). Hydrolysis of COS by carbonic anhydrase formed H2 S, an inhibitor of catalase, an enzyme that detoxifies H2 O2 . Fe2+ and H2 S together increased intracellular ROS levels and decreased viability in C6 glioma cells compared with controls lacking either Fe2+ , the AAN sequence, or the ability to generate H2 S. AAN-PTC-Fe2+ performed better than temezolimide while exhibiting no cytotoxicity toward H9C2 cardiomyocytes. This study provides an H2 S-amplified, enzyme-responsive platform for synergistic cancer treatment.

Keywords: Cancer; Drug Delivery; Gasotransmitter; Iron; Prodrugs.


Figures

Figure 1.
Figure 1.
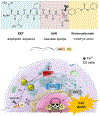
Schematic illustration of PHDC–Fe2+ complex chemical structure and therapeutic mechanism in C6 glioma cell line.
Figure 2.
Figure 2.
Chemical structures of control PHDCs: A. AAQ-PTC, which does not respond to legumain, and thus cannot release H2S. B. AAN-PC, which responds to legumain but releases CO2 instead of COS, and thus cannot generate H2S.
Figure 3.
Figure 3.
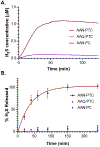
A. Representative H2S release profiles of AAN-PTC, AAQ-PTC, and AAN-PC (333 μM) triggered by CA (3.33 μM) and legumain (1 ng/μL) at rt in acetate buffer (10 mM, pH 5.0). Data were obtained on an H2S-sensitive electrochemical probe. B. H2S release kinetics from AAN-PTC, AAQ-PTC, and AAN-PC (100 μM) measured via the methylene blue assay in acetate buffer (10 mM, pH 5.0) with CA (1 μM) and legumain (1 ng/μL). Data points are solid circles, and the solid line shows the pseudo-first-order kinetics fit for AAN-PTC. Error bars indicate standard deviations of three separate experiments.
Figure 4.
Figure 4.
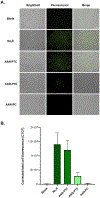
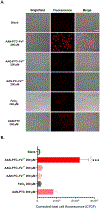
A. Brightfield, fluorescence, and merged images showing fluorescence in C6 cells preincubated with H2S probe WSP-5 (50 μM) for 30 min and then treated with the following groups for 3 h: blank (1× PBS), Na2S (200 μM), AAN-PTC (with cleavable site and H2S donor, 200 μM), AAQ-PTC (with H2S donor but no cleavable site, 200 μM), AAN-PC (with cleavable site but no H2S donor, 200 μM). Cells were then washed, and fluorescence images were taken in PBS. Scale bars are 100 μm. B. Quantification of corrected total cell fluorescence (CTCF). Average fluorescence intensities were quantified by ImageJ (cell counts are >30 for each group from three separate wells). The error bars represent the standard deviation between repeats (n=3).
Figure 5.
Figure 5.
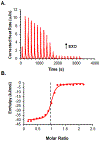
A. ITC thermogram of the AAN-PTC–Fe2+ titration. FeCl2 solution (10 mM) was titrated into AAN-PTC solution (1 mM) at 298 K. B. ITC titration curve of AAN-PTC–Fe2+ titration, the red solid line is the nonlinear least-squares fitted curve, and the dashed line at 0.95 indicates the binding stoichiometry (N).
Figure 6.
Figure 6.
A. Representative bright field, live/dead, and merged images of C6 glioma cells treated with PBS buffer (blank), FeCl2 (200 μM), AAN-PTC (with cleavable site and H2S donor but without Fe2+ complexed, 200 μM), AAQ-PTC–Fe2+ (with H2S donor but no cleavable site, 200 μM), AAN-PC–Fe2+ (with cleavable site but no H2S donor, 200 μM), AAN-PTC–Fe2+(with cleavable site and H2S donor, 200 μM), and TMZ (1 mM) for 24 h post-seeding. Live/dead staining (calcein-AM and ethidium-Br) and subsequent fluorescence microscopy were performed to visualize cell viability. The scale bars represent 100 μm. Magnification = 20×. B. CCK-8 cell viability data for the same treatment groups. Error bars represent the standard deviation over three independent experiments with five replicates per experiment (n = 3). *** indicates p < 0.001 among indicated treatment groups. Group comparisons are indicated as determined by a one-way analysis of variance (ANOVA) with a Student−Newman−Keuls comparisons post hoc test.
Figure 7.
Figure 7.
A. Bright field, fluorescence, and merged images showing fluorescence in C6 rat glioma cells preincubated with either PBS (blank), AAN-PTC–Fe2+ (with cleavable site and H2S donor, 200 μM), AAQ-PTC–Fe2+ (with H2S donor but no cleavable site, 200 μM), AAN-PC–Fe2+ (with cleavable site but no H2S donor, 200 μM), FeCl2 (200 μM), and AAN-PTC (with cleavable site and H2S donor but no Fe2+, 200 μM) for 3 h. After treatment, cells were incubated with ROS probe DHE (10 μM) for 30 min, washed, and imaged in DPBS by bright-field and fluorescence microscopy. Scale bar is 100 μm. B. Corrected total cell fluorescence (CTCF) quantification for the same treatment groups. Average fluorescence intensities were quantified using ImageJ (cell counts are >30 for each group from three separate wells). The error bars represent the standard deviation among repeats (n=3). *** indicates p < 0.001 for a comparison of AAN-PTC–Fe2+ versus all other groups, which was determined by a one-way analysis of variance (ANOVA) with a Student–Newman–Keuls comparisons post hoc test.
Scheme 1.
Scheme 1.
Synthetic route to AAN-PTC and COS/H2S release triggered by legumain and aided by CA. A detailed synthetic route to AAN-PTC appears in the supporting information.

References

    1. Wang J, Yi J, Cancer Biol. Ther 2008, 7, 1875–1884. - PubMed
    1. Zhang C, Bu W, Ni D, Zhang S, Li Q, Yao Z, Zhang J, Yao H, Wang Z, Shi J, Angew. Chemie Int. Ed 2016, 55, 2101–2106. - PubMed
    1. Li X, Zhou Q, Japir AA-WMM, Dutta D, Lu N, Ge Z, ACS Nano 2022, 16, 14982–14999. - PubMed
    1. Zhao P, Li H, Bu W, Angew. Chemie Int. Ed 2023, 62, e202210415. - PubMed
    1. Wang X, Zhong X, Liu Z, Cheng L, Nano Today 2020, 35, 100946.

Publication types