. 2023 Jun 5;155(6):e202313340.
doi: 10.1085/jgp.202313340. Epub 2023 Apr 20.

Allosteric modulation of GluN1/GluN3 NMDA receptors by GluN1-selective competitive antagonists

Affiliations

Allosteric modulation of GluN1/GluN3 NMDA receptors by GluN1-selective competitive antagonists

Nirvan Rouzbeh et al. J Gen Physiol. .

Abstract

NMDA-type ionotropic glutamate receptors are critical for normal brain function and are implicated in central nervous system disorders. Structure and function of NMDA receptors composed of GluN1 and GluN3 subunits are less understood compared to those composed of GluN1 and GluN2 subunits. GluN1/3 receptors display unusual activation properties in which binding of glycine to GluN1 elicits strong desensitization, while glycine binding to GluN3 alone is sufficient for activation. Here, we explore mechanisms by which GluN1-selective competitive antagonists, CGP-78608 and L-689,560, potentiate GluN1/3A and GluN1/3B receptors by preventing glycine binding to GluN1. We show that both CGP-78608 and L-689,560 prevent desensitization of GluN1/3 receptors, but CGP-78608-bound receptors display higher glycine potency and efficacy at GluN3 subunits compared to L-689,560-bound receptors. Furthermore, we demonstrate that L-689,560 is a potent antagonist of GluN1FA+TL/3A receptors, which are mutated to abolish glycine binding to GluN1, and that this inhibition is mediated by a non-competitive mechanism involving binding to the mutated GluN1 agonist binding domain (ABD) to negatively modulate glycine potency at GluN3A. Molecular dynamics simulations reveal that CGP-78608 and L-689,560 binding or mutations in the GluN1 glycine binding site promote distinct conformations of the GluN1 ABD, suggesting that the GluN1 ABD conformation influences agonist potency and efficacy at GluN3 subunits. These results uncover the mechanism that enables activation of native GluN1/3A receptors by application of glycine in the presence of CGP-78608, but not L-689,560, and demonstrate strong intra-subunit allosteric interactions in GluN1/3 receptors that may be relevant to neuronal signaling in brain function and disease.


Conflict of interest statement

Disclosures: The authors declare no competing interests exist.

Figures

Figure 1.
Figure 1.
L-689,560 inhibits GluN1/3A-mediated responses in acute hippocampal slices. (A) Schematic depiction of whole-cell patch-clamp recordings from CA1 pyramidal neurons in acute hippocampal slices from P8–12 mice. Responses to pressure-applied application (puffs) of 10 mM glycine were recorded in the absence and presence of bath-applied GluN1-selective competitive antagonists. DG, dentate gyrus. (B) Representative recordings of responses to glycine puffs (10 mM) in the absence (baseline; black trace) and presence of 1 µM L-689,560 from CA1 pyramidal neurons in acute hippocampal slices from WT (blue) or GluN3A knock-out (3A-KO; orange) mice. (C) Average time course of responses to glycine puffs from WT (n = 6) and 3A-KO (n = 7) neurons. L-689,560 was bath-applied during the time indicated by the bar above graph. (D) Summary of current responses to glycine puffs in the absence (baseline) and presence of 1 µM L-689,560. Application of L-689,560 did not significantly potentiate current responses in WT (n = 6; P = 0.227; paired t test) or 3A-KO (n = 7) neurons (P = 0.522; paired t test). (E) Representative recordings of responses to glycine puffs from WT neurons in the absence (baseline; black) and presence of 1 µM CGP-78608 (blue), as well as in the presence of 1 µM CGP-78608 + 1 µM L-689,560 (orange). (F) Average time course of responses to glycine puffs from WT hippocampal CA1 neurons (n = 5). (G) Summary of glycine responses from WT neurons in the absence ligands (baseline), in the presence of 1 µM CGP-78608, and in the presence of 1 µM CGP-78608 + 1 µM L-689,560. Application of CGP-78608 significantly potentiated current responses compared to baseline (P = 0.006), and the CGP-78608-mediated potentiation was inhibited by the addition of L-689,560 (P = 0.011), resulting in glycine responses that were not significantly different from baseline (P = 0.068; paired one-way ANOVA with Tukey’s posttest). Data are mean ± SEM; ns indicates not significant.
Figure 2.
Figure 2.
L-689,560 is a potent inhibitor of GluN1FA+TL/3A receptors. (A) Concentration–response data for inhibition of recombinant GluN1/2A receptors by competitive glycine site antagonists. Responses were activated by 10 µM glycine in the continuous presence of 300 µM glutamate and measured using two-electrode voltage-clamp recordings. IC50 values for CGP-78608, L-689,560, and DCKA were 0.065 ± 0.003 µM (100 ± 1% inhibition; nH = 1.5; n = 12), 0.25 ± 0.01 µM (100 ± 1% inhibition; nH = 1.3; n = 14), and 1.5 ± 0.1 µM (102 ± 1% inhibition; nH = 1.3; n = 12), respectively. Data are mean ± SEM. (B) Representative responses from GluN1/2A receptors inhibited by increasing concentrations of competitive glycine site antagonists. (C) Concentration–response data for inhibition of recombinant GluN1FA+TL/3A receptors. Responses were activated by 30 µM glycine and measured using two-electrode voltage-clamp recordings. CGP-78608 produced no inhibition at 30 µM (n = 16). IC50 values for L-689,560 and DCKA were 0.077 ± 0.01 µM (95 ± 1% inhibition; nH = 1.2; n = 16) and 29 ± 1 µM (93 ± 1% inhibition; nH = 1.2; n = 12), respectively. Data are mean ± SEM. (D) Representative responses from GluN1FA+TL/3A receptors inhibited by increasing concentrations of competitive glycine site antagonists. See Table 1 for L-689,560 IC50 values.
Figure 3.
Figure 3.
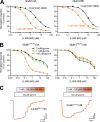
L-689,560 is a negative allosteric modulator of GluN1FA+TL/3A and GluN1FA+TL/3B receptors. (A) Concentration–response data for L-689,560 inhibition of GluN1/3A activated by 30 µM glycine and GluN1/3B receptors activated by 100 µM glycine. Responses were activated in the continuous presence of either 1 or 10 µM CGP-78608. Data are mean ± SEM from 6 to 12 oocytes. (B) Inhibition of GluN1FA+TL/3A and GluN1FA+TL/3B receptors by L-689,560. Responses were activated by either 100 µM, 1 mM, or 3 mM glycine. Increased glycine concentrations resulted in a biphasic concentration–response relationship (see Materials and methods for details on data analysis). Data are mean ± SEM from 4 to 8 oocytes. (C) Representative two-electrode voltage-clamp recordings of responses from GluN1FA+TL/3A and GluN1FA+TL/3B receptors that are inhibited by increasing concentrations of L-689,560. See Table 1 for IC50 values.
Figure 4.
Figure 4.
L-689,560 reduces glycine binding to GluN1FA+TL/3A, but not GluN1FA+TL/3B receptors. (A) Glycine concentration–response data in continuous presence of 300 µM glutamate at GluN1/2A receptors in the absence and presence of increasing concentrations of by L-689,560. The glycine EC50 value in the absence L-689,560 is shown. Data are mean ± SEM from 3 to 6 oocytes. (B) Glycine concentration–response data at GluN1FA+TL/3A receptors in the absence and presence of increasing concentrations of by L-689,560. The glycine EC50 value in the absence L-689,560 is shown. Data are mean ± SEM from 6 to 12 oocytes. (C) Overview of an equilibrium model for L-689,560 inhibition. A and B represent the agonist (glycine) and modulator (L-689,560), respectively. Agonist KA is changed by the allosteric constant α upon binding of modulator and vice versa. E is the agonist efficacy that, in this model, remains unchanged upon modulator binding. The dose ratio (DR) is the ratio of agonist EC50 values in the presence (EC50’) and absence (EC50) of modulator as a function of modulator concentration [B], modulator binding dissociation constant Kb, and the allosteric constant α. (D) Schild plot of data shown in A and B demonstrating competitive antagonism of L-689,560 on GluN1/2A receptors (Kb = 11 nM), and allosteric antagonism of L-689,560 on GluN1FA+TL/3A receptors (Kb = 80 nM). (E) Concentration–response data for glycine at GluN1FA+TL/3B receptors in the absence and presence of L-689,560. The glycine EC50 value in the absence L-689,560 is shown. Data are mean ± SEM from 13 to 21 oocytes. See Table 2 for EC50 values and Materials and methods for details on data analysis.
Figure 5.
Figure 5.
L-689,560 inhibition of GluN1/3A requires unbinding of CGP-78608 from GluN1. (A) Schematic representation of fast-application whole-cell patch-clamp electrophysiology on lifted HEK293T cells expressing recombinant GluN1/3A receptors. Rapid solution exchange is achieved by piezo-driven translation of a theta-tube to move the lifted HEK293T cell between two distinct solutions. (B) Representative whole-cell patch-clamp recordings of responses from recombinant GluN1/3A receptors expressed in HEK293T cells. Responses were activated by long applications (9.5 min) of 0.1 or 10 mM glycine. CGP-78608 (1 µM) was present before and after, but not during, glycine applications. The decay of the response amplitude reflects desensitization following CGP-78608 unbinding and subsequent glycine binding to the GluN1 subunit. Glycine binding to GluN3A slows CGP-78608 unbinding from GluN1. (C) Representative recordings of responses from GluN1/3A receptors activated with 1 µM L-689,560 present before and after, but not during, glycine applications. (D) Bar graph summarizing current density of responses activated by 0.1 or 10 mM glycine from GluN1/3A receptors pre-exposed to either 1 µM CGP-78608 or 1 µM L-689,560. Pre-exposure to CGP-78608 resulted in robust current responses to both 0.1 and 10 mM glycine, whereas pre-exposure to L-689,560 only resulted in responses to 10 mM glycine. (E) Representative recordings of responses activated with CGP-78608 (1 µM) present before and after, but not during, glycine applications. Responses were activated by 0.1 mM glycine in the absence (control) or presence of 10 µM L-689,560. (F) Bar graph summarizing time constants for the decay (τdecay) of current responses from GluN1/3A receptors pre-exposed to 1 µM CGP-78608 and activated by 0.1 mM or 10 mM glycine. Time constants were measured in the absence (control) and presence of 1 or 10 µM L-689,560 as shown in B. The presence of high or low L-689,560 concentrations did not change 1/τdecay values compared to control (control 0.1 mM glycine vs. + 1 µM L-689,560, P = 0.9243; control 0.1 mM glycine vs. + 10 µM L-689,560, P = 0.6516; control 10 mM glycine vs. + 1 µM L-689,560, P >0.9999; control 10 mM glycine vs. + 10 µM L-689,560, P > 0.9999; unpaired two-way ANOVA with Tukey’s posttest; statistical test were performed on normally distributed rate constants 1/τdecay), suggesting that CGP-78608 unbinding from GluN1 is a rate limiting step for inhibition by L-689,560.
Figure 6.
Figure 6.
Antagonist binding to GluN1 influences glycine potency and efficacy at the GluN3 subunit. (A) Glycine concentration–response data for recombinant GluN1/3 receptors measured using two-electrode voltage-clamp recordings in the presence of either 10 µM CGP-78608 or 10 µM L-689,560. Data are shown as mean ± SEM from 14 to 18 oocytes. (B) Representative two-electrode voltage-clamp recordings of glycine concentration–response data from GluN1/3B receptors in the presence of either 10 µM CGP-78608 or 10 µM L-689,560. (C) Representative recordings to measure the relative agonist efficacy of glycine in the presence of GluN1-selective antagonists. Responses in the presence of CGP-78608 or L-659,560 were normalized to a control response in the presence of CGP-78608 at the beginning of the recording. Responses in CGP-78608 were 105 ± 3% (n = 10) at GluN1/3A and 96 ± 3% (n = 8) at GluN1/3B, and responses in L-689,560 were 46 ± 2% (n = 10) at GluN1/3A and 21 ± 1% (n = 10) at GluN1/3B. (D) Bar graph summarizing data using the recording protocols shown in C. Responses measured in L-689,560 were significantly smaller than responses in CGP-78608 (GluN1/3A, P < 0.0001; GluN1/3B, P < 0.0001; unpaired two-way ANOVA with Tukey’s posttest), demonstrating that binding of L-689,560 reduces glycine agonist efficacy at GluN1/3 receptors compared to binding of CGP-78608.
Figure 7.
Figure 7.
GluN1 mutations influence glycine potency at the GluN3 subunit and modulation by L-689,560. (A) Glycine concentration–response data for GluN1FA+TL/3 and GluN1FH+RK/3 receptors. F484A+T518L and F484H+R523K mutations both abolish glycine binding to GluN1 and prevent receptor desensitization. Data are shown as mean ± SEM from 12 to 16 oocytes. (B) Concentration–response data for L-689,560 inhibition of GluN1FA+TL/3A activated by 30 µM glycine and GluN1FH+RK/3A receptors activated by 100 µM glycine. Data for GluN1FA+TL/3A was reproduced from Fig. 2 C. Data are shown as mean ± SEM from 5 to 16 oocytes. (C) Representative two-electrode voltage-clamp recordings of responses from GluN1FA+TL/3A and GluN1FH+RK/3A receptors activated by 30 and 100 µM glycine, respectively, and inhibited by L-689,560. See Tables 1 and 2 for IC50 and EC50 values.
Figure 8.
Figure 8.
Binding to the GluN1 orthosteric site mediates L-689,560 inhibition of GluN1FA+TL/3A receptors. (A–C) GluN1 agonist binding pockets with bound (A) glycine, (B) CGP-78608, or (C) L-689,560 in starting structures for molecular dynamics simulations modeled from the GluN1 ABD in the GluN1/2A ABD heterodimer structure in complex with L-689,560 (PDB ID: 6USU; Chou et al., 2020). The GluN2A ABD was omitted from simulations. Dashed lines indicate interactions that define the ligands as fully bound, partially bound, or unbound (see Materials and methods for details). Simulations with CGP-78608 and L-689,560 started from the fully bound pose, whereas simulations with glycine started from a partially bound pose. Each trajectory frame was analyzed to determine if the ligand was fully bound (light grey), partially bound (orange), or unbound from the ABD (red). (D–I) Time series from 10 molecular dynamics simulations (500 ns each) with glycine (D), CGP-78608 (F), or L-689,560 (H) bound to the isolated GluN1, GluN1FA+TL, and GluN1FH+RK ABDs. The bar graphs summarize the percentage of time glycine (E), CGP-78608 (G), or L-689,560 (I) spent in the fully and partially bound pose (percent occupancy) for all simulations with GluN1 (WT), GluN1FA+TL (FA+TL), and GluN1FH+RK (FH+RK) ABDs. Data are mean ± SEM from 10 simulations.
Figure 9.
Figure 9.
Glycine binding promotes closed GluN1 agonist binding domain conformations. (A) Conformations of the GluN1 ABD are described by measuring ξ1 and ξ2 distances between center of mass of atoms (shown as spheres) in the two lobes (D1 and D2) of the GluN1 ABD on each site of the agonist binding cleft. (B) Molecular dynamics trajectories were produced with the isolated GluN1 ABD in the absence of ligand binding (apo), and values of (ξ1, ξ2) from each frame of 8 × 2,500 ns simulation trajectories were pooled to calculate the 2D protein conformational free energy landscape (i.e., 2D PMF). X markings indicate local free energy minima. Yellow dots indicate values of (ξ1, ξ2) measured in crystal structures of the isolated DCKA-bound GluN1 ABD (PDB ID: 1PBQ; Furukawa and Gouaux, 2003), the isolated GluN1/2A ABD heterodimer with bound DCKA and glutamate (PDB ID: 4NF4; Jespersen et al., 2014), and the isolated apo GluN1 ABD (PDB ID: 4KCC; Yao et al., 2013). (C) The 1D PMF for the apo GluN1 ABD was calculated by projecting values of (ξ1, ξ2) onto a single coordinate using ξ12=ξ1+ξ2/2. Red shade indicates standard deviations. (D) Contour plot of the 2D PMF for the glycine-bound GluN1 ABD. The X marking indicates the global free energy minimum. Yellow dots indicate values of (ξ1, ξ2) measured in crystal structures of the isolated glycine-bound GluN1 ABD (PDB ID: 1PB7; Furukawa and Gouaux, 2003), the isolated GluN1/2A ABD heterodimer with bound glycine and glutamate (PDB ID: 5I57; Yi et al., 2016), and the glycine- and glutamate-bound GluN1/2B receptor (PDB ID: 4PE5; Karakas and Furukawa, 2014), as well as in the cryo-EM structure of the glycine- and glutamate-bound GluN1/2B receptor (PDB ID: 6WHT; Chou et al., 2020). (E) Graph of the 1D PMF for the glycine-bound GluN1 ABD. Red shade indicates standard deviations.
Figure S1.
Figure S1.
Block-averaging analyses for ξ1 and ξ2 coordinates to assess convergence and sampling quality in molecular dynamics trajectories used for PMF calculations. All trajectories for each condition were combined to produce N = M × n frames that were divided into M segments with block length n, and averages of ξ1 and ξ2 coordinates were calculated for each segment. This was performed with an initial short block length and with gradually increasing block lengths. For each block length n, the BSE was calculated as BSE=σn/M, where σn is the standard deviation of either ξ1 or ξ2 averages among the blocks and M is the number of segments with block length n. Thus, BSE values estimate the standard error of ξ1 or ξ2 based on trajectory segments of length n. BSE is predicted to underestimate the true standard error for short block lengths, which are highly correlated, but will increase with larger block lengths as the blocks become statistically independent. Simulations can be considered to have reasonable sampling quality when BSE values no longer change (i.e., asymptotes) with increasing block lengths. BSE values for ξ1 and ξ2 from combined 8 × 2,500 ns trajectories (i.e., 2 µs simulation total) were fit to a mono-exponential function to determine the time constant for each coordinate (τ1 and τ2). This analysis suggests that BSE values for ξ1 and ξ2 reached 95% of the asymptote after 333–2,286 ns, depending on GluN1 mutations or the ligand bound (A–F).
Figure S2.
Figure S2.
Statistical uncertainties in 2D PMFs from molecular dynamics simulations with WT and mutated GluN1 ABDs in the apo state or with bound ligands. (A–F) For each condition, 2D PMFs (A–F, left) were calculated by combining 8 × 2,500 ns trajectories (also shown in Figs. 9 and 10). For each condition, the error ranges (A–F, right) were estimated as the standard deviation of 2D PMFs calculated for each of the eight individual molecular dynamics simulations. X markings indicate local free energy minima.
Figure 10.
Figure 10.
CGP-78608, L-689,560, and mutations select distinct GluN1 agonist binding domain conformations. (A, C, E, and G) Contour plots of 2D PMFs for GluN1 ABDs with bound CGP-78608 (A) or L-689,560 (C), as well as apo GluN1FA+TL (E) and GluN1FH+RK (G) ABDs. X markings indicate global or local free energy minima. Yellow dots indicate values of (ξ1, ξ2) measured in crystal structures of the GluN1/2A ABD heterodimer with bound L-689,560 and glutamate (PDB ID: 6USU; Chou et al., 2020), and the isolated apo GluN1 ABD (PDB ID: 4KCC; Yao et al., 2013), as well as in cryo-EM structures of the glycine- and glutamate-bound GluN1/2B receptor (PDB ID: 6WHT; Chou et al., 2020), the L-689,560- and glutamate-bound GluN1/2B receptor (PDB ID: 6WHT; Chou et al., 2020), and the CGP-78608- and glutamate-bound GluN1/2A receptor (PDB ID: 7EOT; Wang et al., 2021). (B. D, F, and H) Graphs show 1D PMFs for GluN1 ABDs with bound CGP-78608 (B) or L-689,560 (D), as well as apo GluN1FA+TL (F) and GluN1FH+RK (H) ABDs. Red shades indicate standard deviations.

Comment in

Similar articles

Cited by

References

    1. Awobuluyi, M., Yang J., Ye Y., Chatterton J.E., Godzik A., Lipton S.A., and Zhang D.. 2007. Subunit-specific roles of glycine-binding domains in activation of NR1/NR3 N-methyl-D-aspartate receptors. Mol. Pharmacol. 71:112–122. 10.1124/mol.106.030700 - DOI - PubMed
    1. Benveniste, M., and Mayer M.L.. 1991. Kinetic analysis of antagonist action at N-methyl-D-aspartic acid receptors. Two binding sites each for glutamate and glycine. Biophys. J. 59:560–573. 10.1016/S0006-3495(91)82272-X - DOI - PMC - PubMed
    1. Bischofberger, J., Engel D., Li L., Geiger J.R., and Jonas P.. 2006. Patch-clamp recording from mossy fiber terminals in hippocampal slices. Nat. Protoc. 1:2075–2081. 10.1038/nprot.2006.312 - DOI - PubMed
    1. Bossi, S., Dhanasobhon D., Ellis-Davies G.C.R., Frontera J., de Brito Van Velze M., Lourenço J., Murillo A., Luján R., Casado M., Perez-Otaño I., et al. . 2022. GluN3A excitatory glycine receptors control adult cortical and amygdalar circuits. Neuron. 110:2438–2454.e8. 10.1016/j.neuron.2022.05.016 - DOI - PMC - PubMed
    1. Case, D.A., Cheatham T.E. III, Darden T., Gohlke H., Luo R., Merz K.M. Jr, Onufriev A., Simmerling C., Wang B., and Woods R.J.. 2005. The Amber biomolecular simulation programs. J. Comput. Chem. 26:1668–1688. 10.1002/jcc.20290 - DOI - PMC - PubMed

Publication types

MeSH terms

Substances