. 2023 Jul;20(4):1081-1108.
doi: 10.1007/s13311-023-01356-6. Epub 2023 Apr 20.

Ferulic Acid Improves Synaptic Plasticity and Cognitive Impairments by Alleviating the PP2B/DARPP-32/PP1 Axis-Mediated STEP Increase and Aβ Burden in Alzheimer's Disease

Affiliations

Ferulic Acid Improves Synaptic Plasticity and Cognitive Impairments by Alleviating the PP2B/DARPP-32/PP1 Axis-Mediated STEP Increase and Aβ Burden in Alzheimer's Disease

Yacoubou Abdoul Razak Mahaman et al. Neurotherapeutics. 2023 Jul.

Abstract

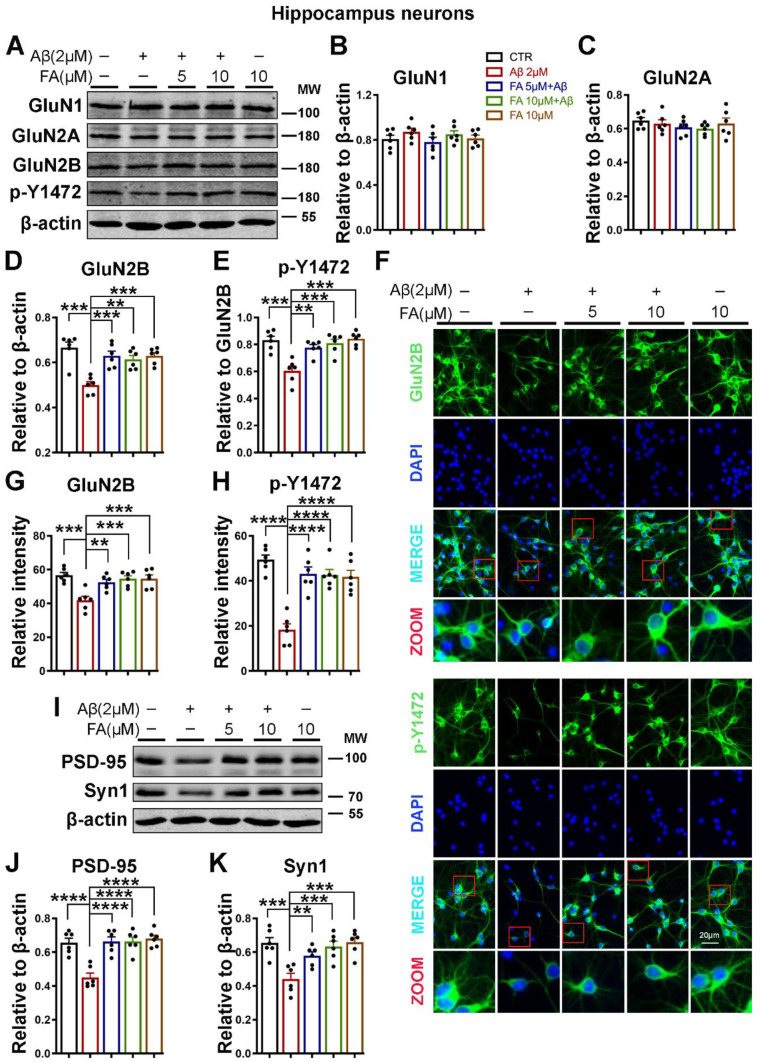
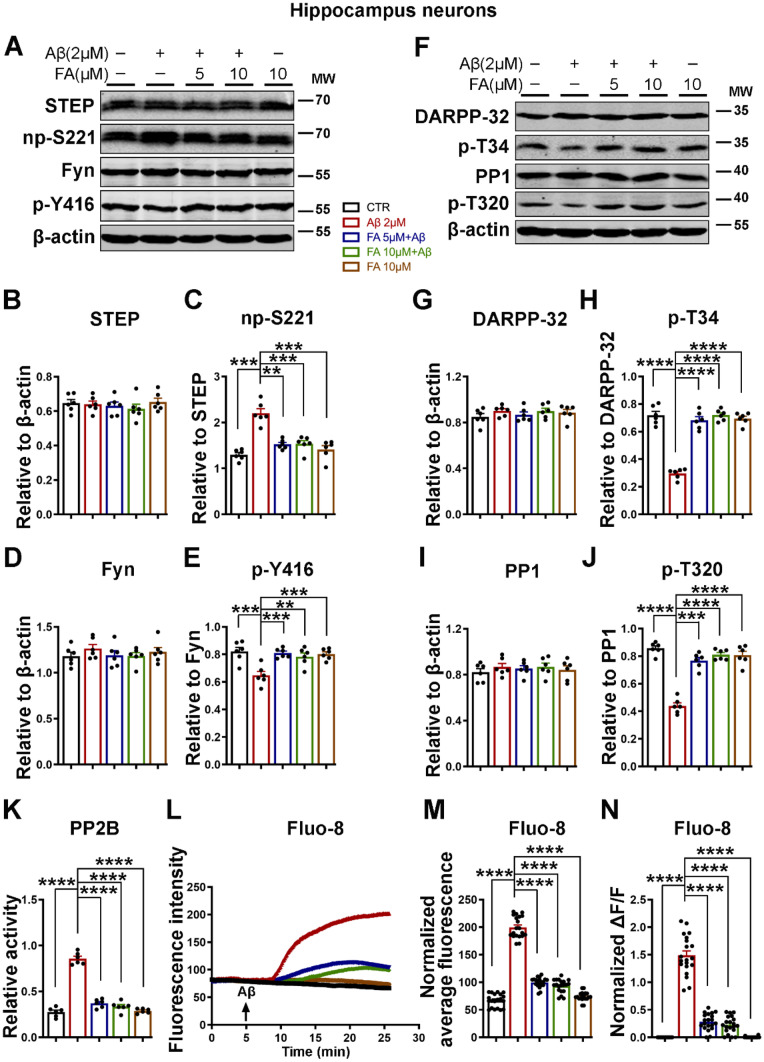
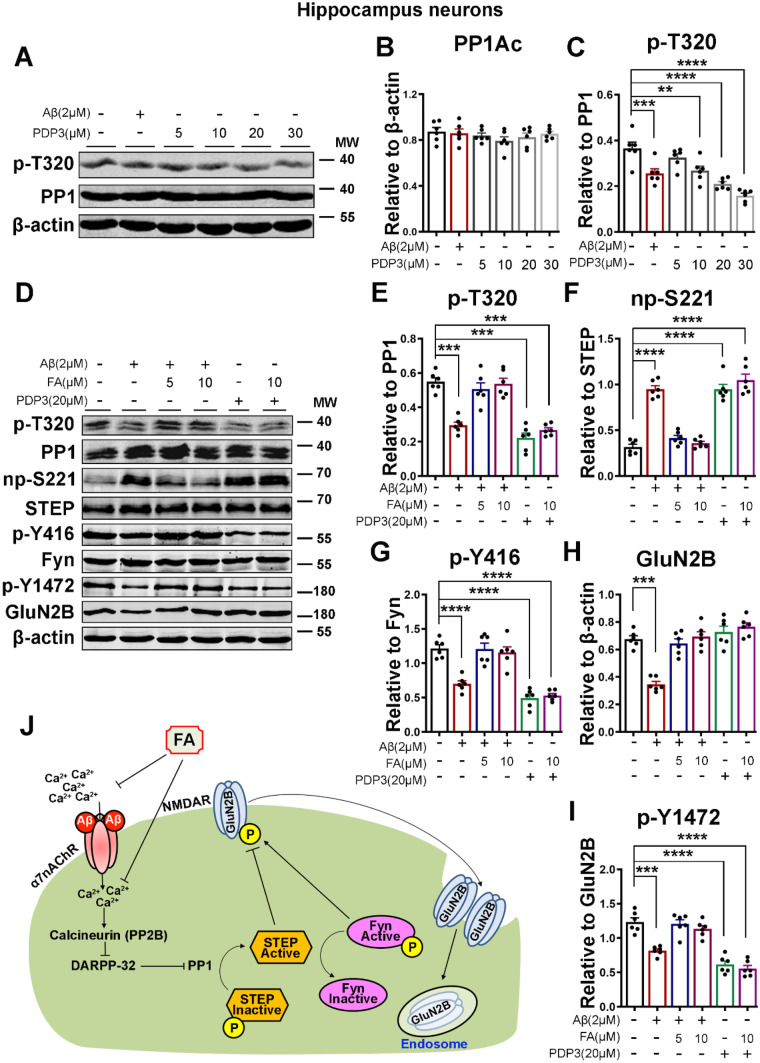
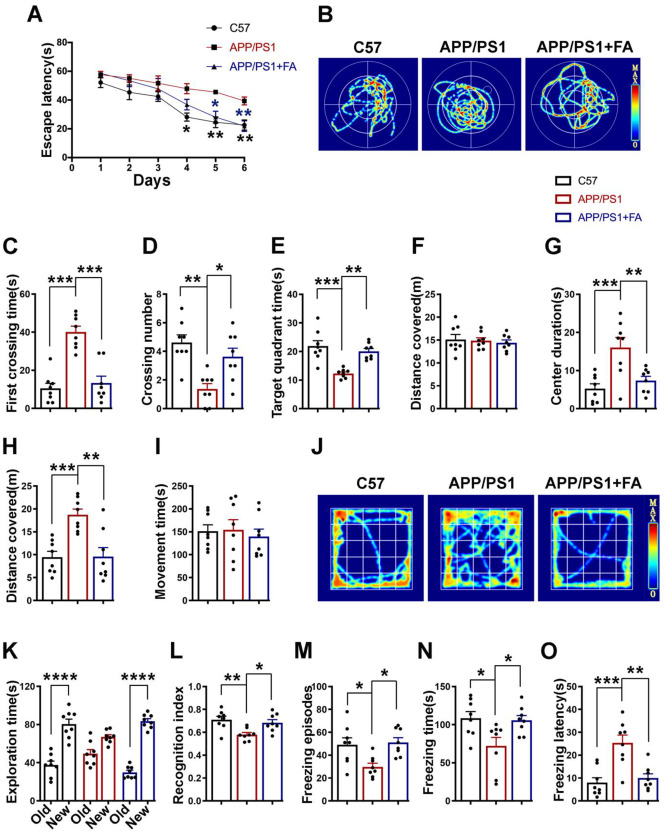
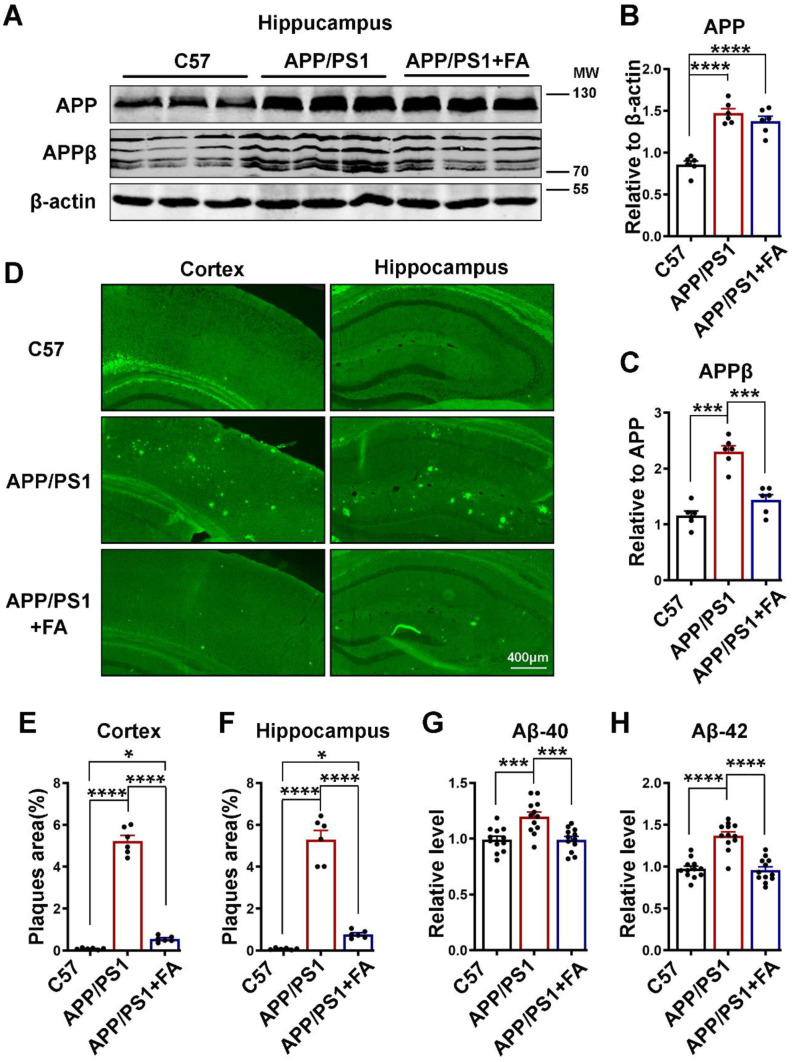
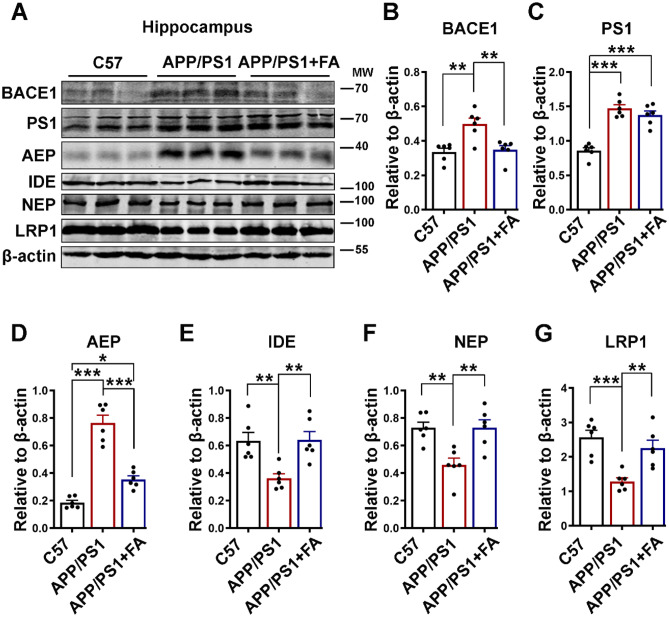
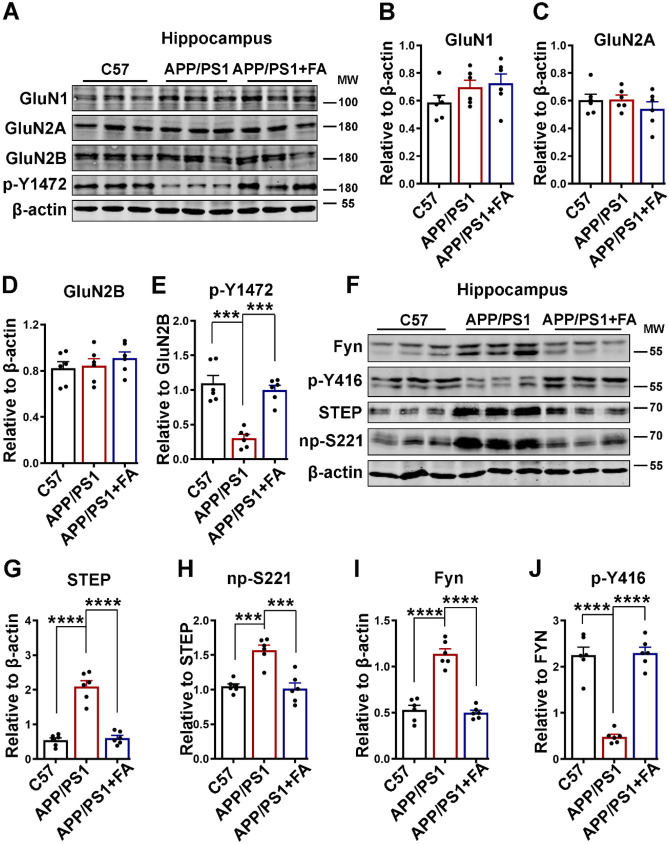
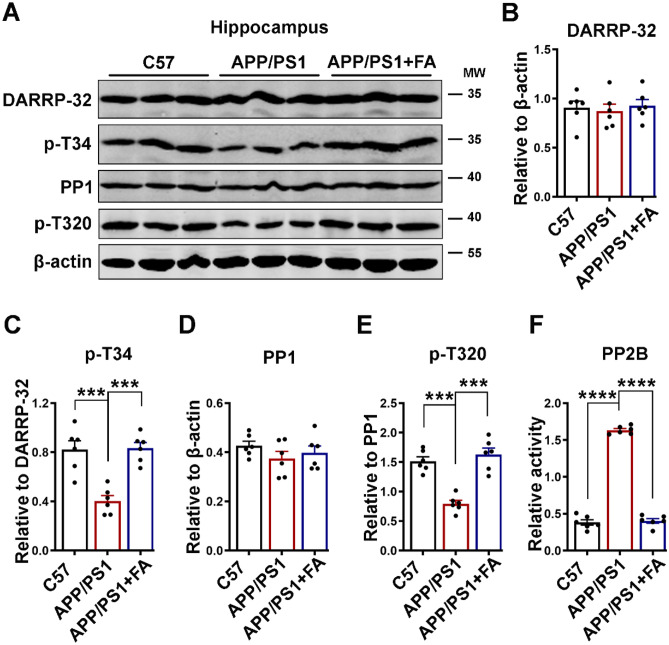
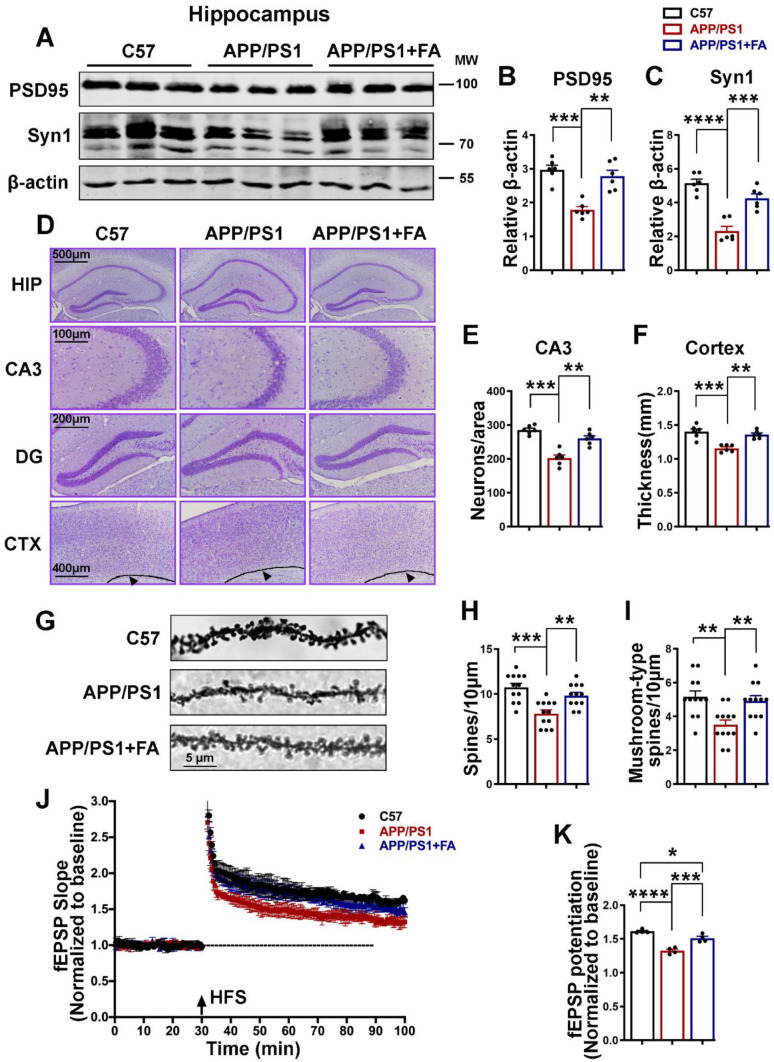
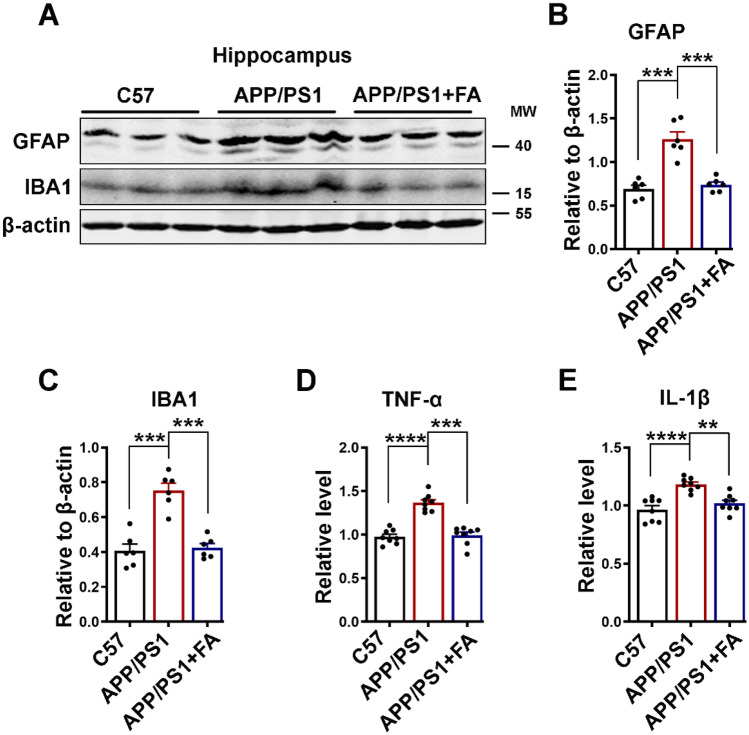
The burden of Alzheimer's disease, the most prevalent neurodegenerative disease, is increasing exponentially due to the increase in the elderly population worldwide. Synaptic plasticity is the basis of learning and memory, but it is impaired in AD. Uncovering the disease's underlying molecular pathogenic mechanisms involving synaptic plasticity could lead to the identification of targets for better disease management. Using primary neurons treated with Aβ and APP/PS1 animal models, we evaluated the effect of the phenolic compound ferulic acid (FA) on synaptic dysregulations. Aβ led to synaptic plasticity and cognitive impairments by increasing STEP activity and decreasing the phosphorylation of the GluN2B subunit of NMDA receptors, as well as decreasing other synaptic proteins, including PSD-95 and synapsin1. Interestingly, FA attenuated the Aβ-upregulated intracellular calcium and thus resulted in a decrease in PP2B-induced activation of DARPP-32, inhibiting PP1. This cascade event maintained STEP in its inactive state, thereby preventing the loss of GluN2B phosphorylation. This was accompanied by an increase in PSD-95 and synapsin1, improved LTP, and a decreased Aβ load, together leading to improved behavioral and cognitive functions in APP/PS1 mice treated with FA. This study provides insight into the potential use of FA as a therapeutic strategy in AD.

Keywords: Alzheimer’s disease; Cognitive impairment; Ferulic acid; Increased intracellular calcium; PP2B/DARPP-32/PP1 axis; Synapses.


Conflict of interest statement

The authors declare no competing interests.

Figures

Fig. 1
Fig. 1
FA preincubation prevents the Aβ-induced loss of synaptic proteins. A The expression of GluN1, GluN2A, GluN2B, and p-Y1472 was evaluated by western blotting in neuronal cell lysates treated with Aβ with or without 2 h of preincubation with FA. BE Statistical analysis of western blot data from A. F Representative immunofluorescence images of neurons using GluN2B and p-Y1472 GluN2B antibodies following Aβ induction with or without 2 h of FA preincubation (scale bar = 20 μm). G, H Statistical analysis of immunofluorescence data from F. I The expression levels of PSD-95 and Synapsin1 were evaluated by western blotting with lysates of neuronal cells treated with Aβ with or without preincubation with FA. J, K Statistical analysis of western blot data from I. β-Actin served as the loading control. The results are from three independent experiments (n = 6), and the data are presented as the mean ± SEM. **p < 0.01; ***p < 0.001; and ****p < 0.0001 vs. control or vs. Aβ treatment groups. p-Y1472, phosphorylated GluN2B at Tyr1472
Fig. 2
Fig. 2
FA prevents the Aβ-induced STEP-mediated decrease in p-Y1472 GluN2B via the calcium-related PP2B/DARPP-32/PP1 axis. A The expression levels of STEP, Fyn, np-S221, and p-Y416 were evaluated by western blotting in neuronal cell lysates treated with Aβ with or without 2 h of preincubation with FA. BE Statistical analysis of western blot data from A. F The expression levels of DARPP-32, PP1, p-T34, and p-T320 were evaluated by western blotting in neuronal cell lysates treated with Aβ with or without 2 h of preincubation with FA. GJ Statistical analysis of western blot data from F. β-Actin served as the loading control (n = 6). K PP2B (calcineurin) activity was measured using the PP2B activity kit (n = 6). L–N Calcium staining experiments (n = 20). L Fluorescence intensity and M normalized average fluorescence intensity of Fluo-8 indicate intracellular calcium level changes in the neuronal cells. N The ratio of ΔF [stimulation intensity (F stim) – resting intensity (F rest)] to F restF/F) is the change in fluorescence intensity relative to the resting fluorescence intensity. The results are from three independent experiments, and the data are presented as the mean ± SEM. **p < 0.01; ***p < 0.001; and ****p < 0.0001 vs. control or vs. Aβ treatment groups. np-S221, nonphosphorylated STEP at Ser221; p-Y416, phosphorylated Fyn at Tyr416; p-T34, phosphorylated DARPP-32 at Thr34; p-T320, phosphorylated PP1 at Thr320
Fig. 3
Fig. 3
FA acts upstream of PP1, as it does not recover the effect of direct activation of PP1 by PDP3. A The expression levels of PP1 and p-T320 in neuronal cells treated with Aβ or increasing concentrations of PDP3 were evaluated by western blotting. B, C Statistical analysis of PP1 and p-T320. D Representative western blot bands of the expression levels of PP1, p-T320, STEP, np-S221, Fyn, p-Y416, GluN2B, and p-Y1472 from lysates of primary neurons treated with Aβ or PDP3 with or without 2 h of FA preincubation. EI Statistical analysis of data from D. No significant difference is found in the PP1, STEP, and Fyn levels. β-Actin served as the loading control (n = 6). J Summary of the PP2B/DARPP-32/PP1 axis leading to the activation of STEP and a decrease in GluN2B phosphorylation. The results are from three independent experiments, and the data are presented as the mean ± SEM. **p < 0.01; ***p < 0.001; and ****p < 0.0001 vs. control group. p-T34, phosphorylated DARPP-32 at Thr34; p-T320, phosphorylated PP1 at Thr320; np-S221, nonphosphorylated STEP at Ser221; p-Y416, phosphorylated Fyn at Tyr416; p-Y1472, phosphorylated GluN2B at Tyr1472
Fig. 4
Fig. 4
Long-term FA treatment prevents behavioral and cognitive deficits in APP/PS1 mice. AF Morris water maze results. A Escape latency (s) of mice to find the platform during the six training days. B Representative searching traces of mice during the probe test. C The first crossing time (s), D The crossing number, E the time (s) spent in the target quadrant, and F. the total distance (m) covered by the mice during the probe test. GJ Open field test results. G Center duration (s). H distance (m) covered, I. movement time (s), and J. representative movement traces of mice during the 5 min of the test. K, L Novel object recognition test results. K The time (s) the mice explored the old and new objects during the test. L The recognition index. MO Fear conditioning test results. M The number of freezing episodes. N The freezing time (s). O The freezing latency (s) during the test time. All behavioral tests were carried out from 7.5 to 8 months of age (n = 8). Data are presented as the mean ± SEM. *p < 0.05; **p < 0.01; ***p < 0.001; and ****p < 0.0001 vs. control or vs. APP/PS1 mice groups
Fig. 5
Fig. 5
Long-term FA treatment alleviates the Aβ burden in APP/PS1 mice. A The expression of APP and APPβ in hippocampal lysates of C57 control and APP/PS1 mice with or without long-term FA treatment was evaluated by western blotting. β-Actin served as the loading control (n = 6). B, C Statistical analysis of APP and APPβ. D Representative images of thioflavin S staining from C57 control and APP/PS1 mice with or without long-term FA treatment (scale bar = 400 μm, n = 6, from 3 mice and 2 images were analyzed per mouse). E, F The quantification of thioflavin S fluorescence shows the % of Aβ plaque area pixels divided by the full area captured in the cortex and hippocampus. G, H Statistical analysis of the ELISA results for Aβ40 and Aβ42 from hippocampal lysates of C57 control and APP/PS1 mice with or without long-term FA treatment. N = 12; 6 mice per group and 3 independent experiments. The data are presented as the mean ± SEM. *p < 0.05; ***p < 0.001; and ****p < 0.0001 vs. control or vs. APP/PS1 mice groups
Fig. 6
Fig. 6
FA attenuates the Aβ burden by modulating both production and clearance pathways. A The expression levels of BACE1, PS1, AEP, IDE, NEP, and LRP1 in hippocampal lysates of C57 control and APP/PS1 mice with or without long-term FA treatment were evaluated by western blotting. BG The quantification of the western blot bands from A. β-Actin served as the loading control (n = 6). The data are presented as the mean ± SEM. *p < 0.05; **p < 0.01; and ***p < 0.001 vs. control or vs. APP/PS1 mice groups
Fig. 7
Fig. 7
FA improves the decrease in p-Y1472 GluN2B by decreasing STEP in APP/PS1 mice. A The expression levels of GluN1, GluN2A, GluN2B, and p-Y1472 in hippocampal lysates from C57 control and APP/PS1 mice with or without long-term FA treatment were evaluated by western blotting. BE The statistical analysis of western blot bands from A. F The expression levels of STEP, np-S221, Fyn, and p-Y416 in hippocampal lysates of C57 control and APP/PS1 mice with or without long-term FA treatment were evaluated by western blotting. GJ Statistical analysis of western blot bands from F. β-Actin served as the loading control (n = 6). The data are presented as the mean ± SEM. ***p < 0.001 and ****p < 0.0001 vs. control or vs. APP/PS1 mice groups. p-Y1472, phosphorylated GluN2B at Tyr1472; np-S221, nonphosphorylated STEP at Ser221; p-Y416, phosphorylated Fyn at Tyr416
Fig. 8
Fig. 8
FA downregulates STEP by modulating the calcium-related PP2B/DARPP-32/PP1 axis in APP/PS1 mice. A The expression levels of DARPP-32, p-T34, PP1, and p-T320 in hippocampal lysates from C57 control and APP/PS1 mice with or without long-term FA treatment were evaluated by western blotting. BE Statistical analysis of western blot bands from A. β-Actin served as the loading control (n = 6). F Statistical analysis of the PP2B activity test using the PP2B activity kit (n = 6). The data are presented as the mean ± SEM. ***p < 0.001 and ****p < 0.0001 vs. control or vs. APP/PS1 mice groups. p-T34, phosphorylated DARPP-32 at Thr34; p-T320, phosphorylated PP1 at Thr320
Fig. 9
Fig. 9
Long-term FA treatment prevents synaptic loss and neurodegeneration and improves LTP in APP/PS1 mice. A The expression levels of PSD-95 and Synapsin1 from hippocampal lysates from C57 control and APP/PS1 mice with or without long-term FA treatment were evaluated by western blotting. B, C Statistical analysis of western blot bands of PSD-95 and Synapsin1 from A. β-Actin served as the loading control (n = 6). D–F Nissl staining results (scale bars = 100, 200, 400, and 500 μm, n = 6; 3 mice per group and 2 images per mouse). D Representative micrographs of the Nissl staining experiment. E The number of neurons per area. F Thickness (mm) of the cortex. GI Golgi staining results. G Representative micrographs of the Golgi staining experiment (scale bar = 5 μm, n = 12 images analyzed per group, 3 mice per group, and 4 dendrites per mouse). H Total spine number per 10 μm area. I The mushroom-type spines per 10 μm area. J, K LTP at DG-CA3 synapses was measured in C57 control and APP/PS1 mice with or without long-term FA treatment (n = 4 mice per group, 3 brain slices per mouse). J The normalized fEPSP slope. K Normalized fEPSP potentiation. The data are presented as the mean ± SEM. *p < 0.05; **p < 0.01; ***p < 0.001; and ****p < 0.0001 vs. control or vs. APP/PS1 mice groups
Fig. 10
Fig. 10
Long-term FA treatment improves neuroinflammation in APP/PS1 mice. A The expression levels of GFAP and IBA1 in hippocampal lysates of C57 control and APP/PS1 mice with or without long-term FA treatment were evaluated by western blotting. B, C Statistical analysis of western blot bands of GFAP and IBA1 from A. β-Actin served as the loading control (n = 6). D, E Statistical analysis of TNF-α and IL-1β ELISA results (n = 8; 4 mice per group and 3 independent experiments). The data are presented as the mean ± SEM. **p < 0.01; ***p < 0.001; and ****p < 0.0001 vs. control or vs. APP/PS1 mice groups

Similar articles

Cited by

References

    1. Bliss TV, Collingridge GL. A synaptic model of memory: long-term potentiation in the hippocampus. Nature. 1993;361:31–39. doi: 10.1038/361031a0. - DOI - PubMed
    1. Sattler R, Xiong Z, Lu WY, MacDonald JF, Tymianski M. Distinct roles of synaptic and extrasynaptic NMDA receptors in excitotoxicity. J Neurosci. 2000;20:22–33. doi: 10.1523/JNEUROSCI.20-01-00022.2000. - DOI - PMC - PubMed
    1. Hardingham GE, Fukunaga Y, Bading H. Extrasynaptic NMDARs oppose synaptic NMDARs by triggering CREB shut-off and cell death pathways. Nat Neurosci. 2002;5:405–414. doi: 10.1038/nn835. - DOI - PubMed
    1. Chatterjee M, Kwon J, Benedict J, Kamceva M, Kurup P, Lombroso PJ. STEP inhibition prevents Aβ-mediated damage in dendritic complexity and spine density in Alzheimer's disease. Exp Brain Res. 2021;239:881–890. doi: 10.1007/s00221-020-06028-x. - DOI - PubMed
    1. Won S, Roche KW. Regulation of glutamate receptors by striatal-enriched tyrosine phosphatase 61 (STEP(61)) J Physiol. 2021;599:443–451. doi: 10.1113/JP278703. - DOI - PMC - PubMed

Publication types