. 2023 Aug;45(4):2559-2587.
doi: 10.1007/s11357-023-00785-7. Epub 2023 Apr 20.

Transfer learning in a biomaterial fibrosis model identifies in vivo senescence heterogeneity and contributions to vascularization and matrix production across species and diverse pathologies

Affiliations

Transfer learning in a biomaterial fibrosis model identifies in vivo senescence heterogeneity and contributions to vascularization and matrix production across species and diverse pathologies

Christopher Cherry et al. Geroscience. 2023 Aug.

Abstract

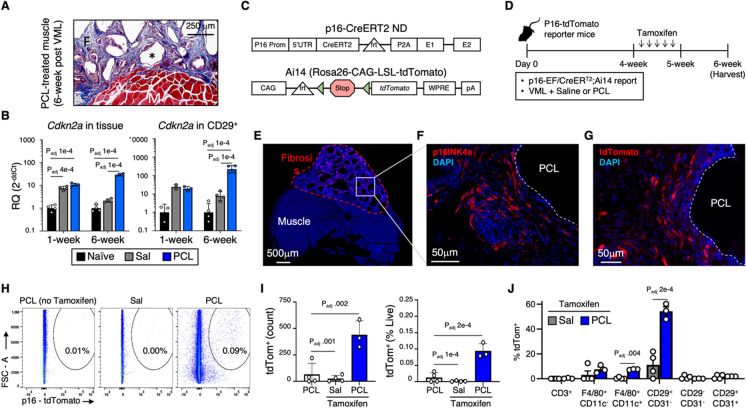
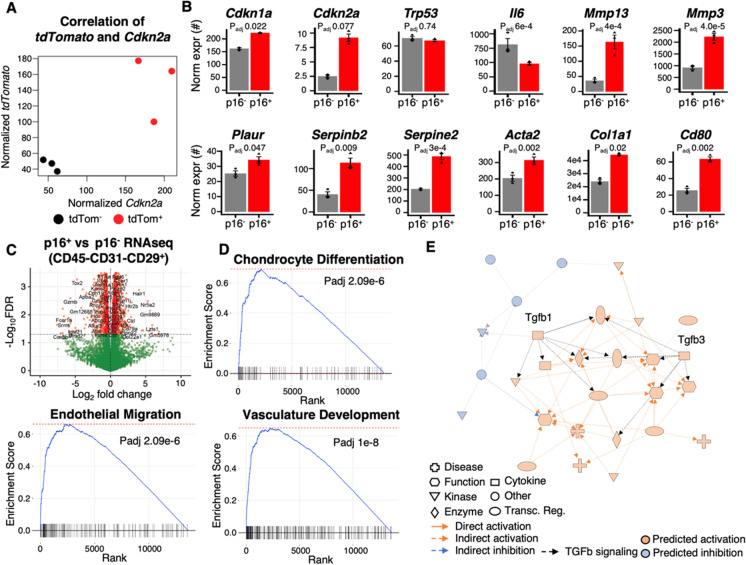
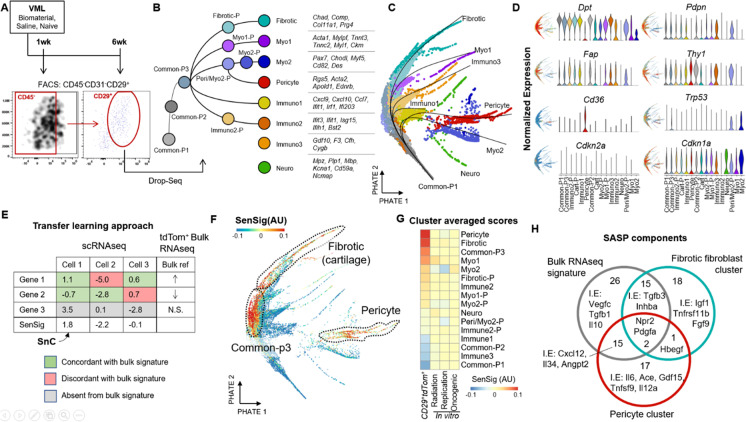
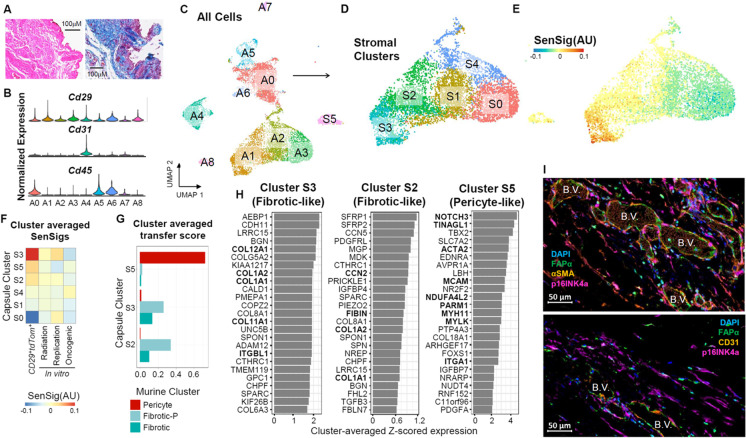
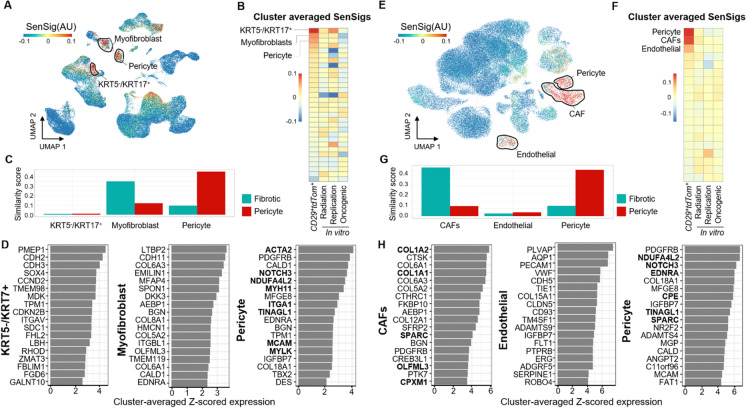
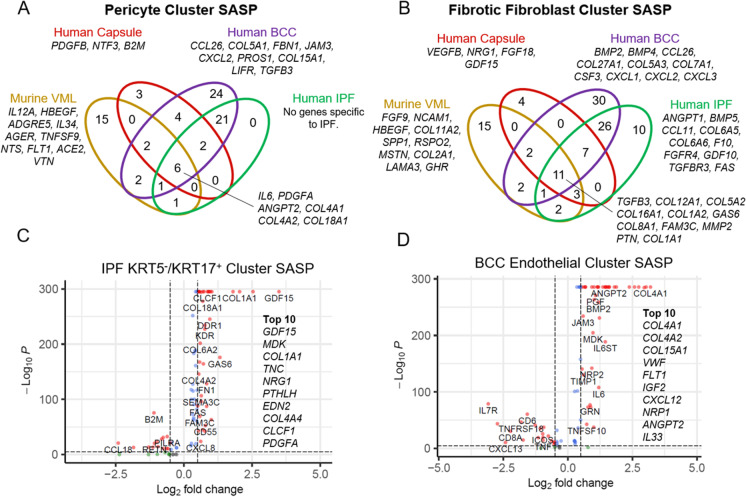
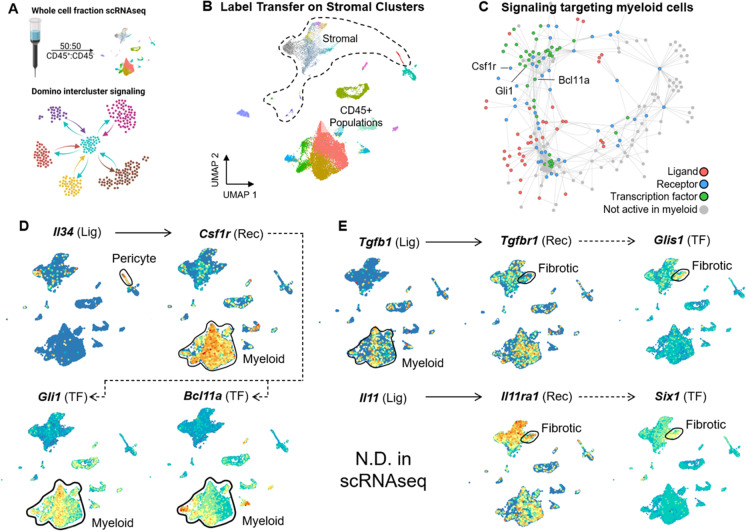
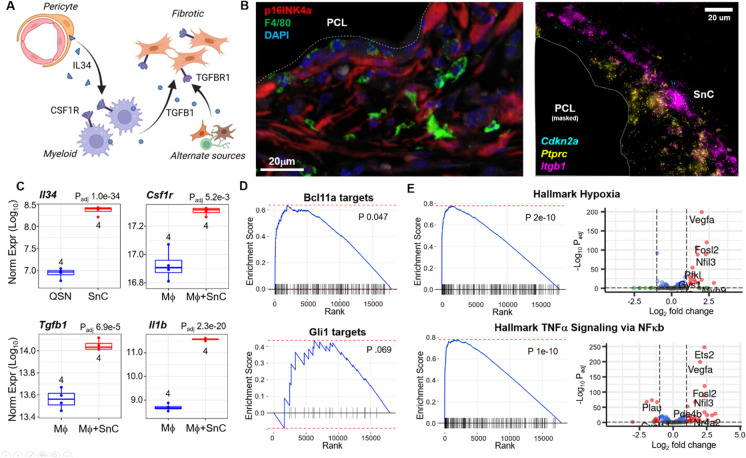
Cellular senescence is a state of permanent growth arrest that plays an important role in wound healing, tissue fibrosis, and tumor suppression. Despite senescent cells' (SnCs) pathological role and therapeutic interest, their phenotype in vivo remains poorly defined. Here, we developed an in vivo-derived senescence signature (SenSig) using a foreign body response-driven fibrosis model in a p16-CreERT2;Ai14 reporter mouse. We identified pericytes and "cartilage-like" fibroblasts as senescent and defined cell type-specific senescence-associated secretory phenotypes (SASPs). Transfer learning and senescence scoring identified these two SnC populations along with endothelial and epithelial SnCs in new and publicly available murine and human data single-cell RNA sequencing (scRNAseq) datasets from diverse pathologies. Signaling analysis uncovered crosstalk between SnCs and myeloid cells via an IL34-CSF1R-TGFβR signaling axis, contributing to tissue balance of vascularization and matrix production. Overall, our study provides a senescence signature and a computational approach that may be broadly applied to identify SnC transcriptional profiles and SASP factors in wound healing, aging, and other pathologies.

Keywords: Fibrosis; RNA sequencing; Senescence.


Conflict of interest statement

J.H.E. holds equity in Unity Biotechnology and Aegeria Soft Tissue and is an advisor for Tessera Therapeutics, HapInScience, and Font Bio. D.M.P. is consultant at Aduro Biotech, Amgen, Astra Zeneca, Bayer, Compugen, DNAtrix, Dynavax Technologies Corporation, Ervaxx, FLX Bio, Immunomic, Janssen, Merck, and Rock Springs Capital. D.M.P. holds equity in Aduro Biotech, DNAtrix, Ervaxx, Five Prime therapeutics, Immunomic, Potenza, and Trieza Therapeutics. D.M.P. is a member of the scientific advisory board for Bristol Myers Squibb, Camden Nexus II, Five Prime Therapeutics, and WindMil. D.M.P. is a member of the board of directors in Dracen Pharmaceuticals. C.C. is the founder and owner of C M Cherry Consulting, LLC. E.J.F. is a member of the scientific advisory board for Resistance Bio and is a consultant for Merck and Mestag Therapeutics. J.M.v.D. is a co-founder of and holds equity in Unity Biotechnology and Cavalry Biosciences. D.J.B. is a shareholder and co-inventor on patent applications licensed to or filed by Unity Biotechnology, a company developing senolytic medicines, including small molecules that selectively eliminate senescent cells. Research in his laboratory has been reviewed by the Mayo Clinic Conflict of Interest Review Board and is being conducted in compliance with Mayo Clinic Conflict of Interest policies.

Figures

Fig. 1
Fig. 1
Cre-transgenic mouse identifies p16+ SnCs in fibrotic tissue from the foreign body response to a biomaterial implant. A Representative Masson’s trichrome staining highlighting fibrosis (F) around PCL particles (*) adjacent to muscle (M) 6 weeks after implantation in a volumetric muscle loss (VML) injury to the quadricep. Scale bar = 250 µm. B qPCR analysis of Cdkn2a mRNA expression in whole muscle tissue (left) and FACS-isolated CD45CD31CD29+ cells (right) from naïve/no surgery (black), saline-treated (gray), or PCL-implanted (blue) mice 1 or 6 weeks following VML injury. Statistics shown are from ANOVA followed by multiple t test with Benjamini–Hochberg correction for multiple testing. Adjusted p values for all statistically significant (padj < 0.05) comparisons are shown. C Diagram of the transgene construct used in the p16-EF/CreERT2;Ai14 inducible p16 tdTomato (tdTom) reporter mice. CreERT2 is inserted inside the p16-specific exon 1 of the Cdkn2a gene. After tamoxifen administration, Cre recombinase is produced by p16INK4A-expressing cells. Cre then recombines the loxP sites (◄) of the Ai14 reporter construct resulting in excision of the stop cassette and subsequent functional expression of tdTom. D Treatment schematic for the induction of tdTom expression in p16-EF/CreERT2;Ai14 mice. Starting 4 weeks post-surgery, mice received tamoxifen injections daily for 5 days to permanently induce tdTom expression in p16+ cells. Tissues were collected and analyzed for tdTom fluorescence 6 weeks post-surgery. E Stitched whole cross-section of p16 immunostaining in a WT animal treated with VML surgery and PCL implant (white dashed line), scale bar = 500 µm. F Representative image of immunostaining for p16 in a WT animal treated with VML surgery and PCL implants 6 weeks post-surgery, scale bar = 50 µm. G Representative image of native tdTom expression in a p16-EF/CreERT2;Ai14 transgenic mouse treated with VML surgery and PCL implants 6 weeks post-surgery, scale bar = 50 µm. H Representative flow cytometry pseudocolor dot plots depicting tdTom expression in viable muscle cells from VML-injured mice treated with saline (n = 4) or PCL (n = 3). Tissues from PCL-treated mice that did not receive tamoxifen injections (n = 4) were used to control for background levels of tdTom expression. Population shown was previously gated to remove debris, doublets, and dead cells. I Quantification of the tdTom+ population in injured muscle by flow cytometry. Total number of viable tdTom+ cells is shown on the left and the frequency of tdTom+ cells among the total viable population is on the right. J Frequency of various cellular subsets within the total tdTom+ population in VML-injured animals treated with saline (gray) or PCL (blue). Statistics shown are from multiple t test with Benjamini–Hochberg correction for multiple testing comparing saline and PCL within cell types. Adjusted p values for all statistically significant (padj < 0.05) comparisons are shown
Fig. 2
Fig. 2
RNA sequencing identifies a senescence signature from stromal cells in the foreign body response. A Gene expression from bulk RNA sequencing comparing sorted CD45CD31CD29+ tdTom+ and tdTom populations. Correlation of normalized tdTom and Cdkn2a counts by sample. B Normalized gene expression for common senescence-associated genes from the dataset in (A). Statistics shown are derived from a negative-binomial test using edgeR followed by FDR correction for multiple testing. C Volcano plot depicting differentially expressed genes from the expression comparison in (A). Statistics shown are from a negative-binomial test under edgeR with FDR correction for multiple testing. A threshold of 0.05 is used to select significant genes. Positive fold change indicates increased expression in p16+ cells. D Gene set enrichment analysis (GSEA) for gene ontology biological process annotations. Positive enrichment scores indicate increased expression of the gene set in the p16+ cells with increased scores indicating increasingly unlikely enrichment under the assumption of random gene order. Statistics reported are from GSEA with FDR multiple testing correction. E Ingenuity Pathways Analysis of upstream regulatory motifs from the bulk RNA sequencing data. The network indicates upstream regulators predicted to be potential modulators of the gene expression changes detected between the p16+ and p16 cells in the bulk RNA sequencing. Tgfb1 and Tgfb3 transcription factors and their outgoing regulatory connections are indicated in black
Fig. 3
Fig. 3
Transfer learning of senescence signature identifies SnCs in single-cell sequencing of the murine synthetic implant microenvironment. A Experimental schema and FACS sorting strategy for single-cell RNA sequencing (scRNAseq). Animals were either uninjured or received the VML surgery that was subsequently treated with either biomaterial implants or saline. CD45CD31CD29+ cells were sorted 1 and 6 weeks post-surgery before input into the Drop-Seq scRNAseq platform. B scRNAseq data set overview. Clusters are labeled and ordered according to their predicted pseudotime trajectory. Characteristic genes for terminal clusters are shown. C PHATE dimensional reduction visualization of clusters with psuedotime overlays and terminal clusters labeled. D Expression of fibroblast marker genes (top) and senescent markers Cdkn1a, Cdkn2a, Trp53, and Cd36 (bottom). Both feature plots (left) and violin plots (right) are shown for each gene. The feature plots show the localization of log-normalized gene expression on the PHATE dimensionality reduction scaled from the 0 to 95% percentiles. E Transfer learning to identify putative SnC in the scRNAseq data set. A scoring methodology based on z-scored gene expression was used to calculate senescent signatures (SenSig) based on the set of genes differentially expressed in the bulk RNA sequencing comparison of sorted SnC in Fig. 2. F Calculated SenSig by cells arranged by PHATE. The three clusters with the highest average SenSig are highlighted. G Cluster-averaged SenSig derived from the p16-EF/CreER.T2;Ai14 reporter mice as well as from three publicly available senescence signatures from in vitro bulk RNA sequencing. H Venn diagram showing differentially expressed ligands (FDR < 0.05) by cluster/data set. Single-cell clusters were compared to all other cells in the data set. Areas with too many genes to show completely have selected genes shown. A complete list of ligands for each category is available in Supplementary Table S5
Fig. 4
Fig. 4
Mouse to human transfer learning of the senescent signature in single-cell sequencing data set from the fibrotic capsule of a human breast implant. A Histological staining of surgically removed fibrotic capsules surrounding synthetic breast implants. Hematoxylin and eosin (left) and Masson’s trichrome (right) staining are shown demonstrating fibrosis of the breast capsule tissue, scale bars = 100 μm. B Expression of stromal cell markers by cluster from a scRNAseq data set collected from surgically removed synthetic breast implants. CD45+ immune cells were enriched to 50% of the total population prior to scRNAseq library generation using the Drop-Seq protocol. C Visualization of the scRNAseq clusters on UMAP before subsetting to stromal populations. D Stromal cells from the scRNAseq data set after computational isolate of CD45CD31CD29+ cells and subsequent re-clustering of the stromal cells. E Feature plot visualization of SenSig in stromal cells derived as described in Fig. 3E. F SenSig averaged by stromal cluster using our in vivo–derived SnC gene set as well as three publicly available in vitro–derived senescent gene sets. G Cluster level similarity scores to the murine putative SnC clusters using singleCellNet. Higher similarity score indicates similar gene expression patterns to the indicated murine scRNAseq clusters. H Genes driving the largest increase in SenSig in the three human stromal clusters with the highest average SenSig. Values shown are average z-scored expression across cells in the target cluster. Genes that were also in the top 25 genes driving senescent signature in the murine fibrotic or pericyte clusters are shown in bold. I Fluorescent staining for fibroblasts (FAPα), endothelial cells (CD31), smooth muscle actin (αSMA), and SnC (p16INK4a) in fibrotic tissue capsules surrounding surgically removed synthetic breast implants, scale bar = 50 μm
Fig. 5
Fig. 5
SenSig identification of SnC in diverse tissue microenvironments. Putative senescent characteristics of two publicly available scRNAseq data sets from human samples of idiopathic pulmonary fibrosis (IPF) (left) and basal cell carcinoma (BCC) (right). A, E Feature plots of SenSig calculated as described in Fig. 3E. B, F Cluster averages of SenSig using our in vivo–derived senescence signature as well as three in vitro–derived publicly available gene sets. Clustering included in the publicly available data were used and are described in detail in their respective publications. C, G Similarity scores using our murine, VML-derived scRNAseq clusters as references. Higher similarity scores indicate similar gene expression patterns to murine scRNAseq stromal clusters. D, H Genes driving the largest increase in SenSig in the three human stromal clusters with highest average SenSig. Values shown are average z-scored expression across cells in the target cluster. Genes that were also in the top 25 genes driving senescent signature in the murine fibrotic or pericyte clusters are shown in bold
Fig. 6
Fig. 6
Expression of ligands by corresponding SnC clusters across tissue microenvironments. A Venn diagram showing differentially expressed ligands (FDR < 0.05) in the SenSig high pericyte clusters and B SenSig high fibrotic fibroblast clusters in the VML, human breast capsule, BCC, and IPF data sets. Ligands were selected from the CellphoneDB2 data base. Murine genes from the VML data set were converted from MGI to HGNC symbol using Ensembl orthologue mapping. Each cluster was compared to all other cells in its respective data set by Wilcox rank sum followed by Benjamini–Hochberg correction for multiple testing. Sets of genes that were specific to each cluster are shown as well as genes that were common across all data sets. A complete list of ligands for each cluster present is available in Supplementary Table S5. C Volcano plots of differentially expressed genes for the KRT5/KRT17+ epithelial-derived basaloid cluster from the IPF data set and D the endothelial cell cluster from the BCC data set. Ligands were selected from the CellphoneDB2 database. P values shown are from Wilcox rank sum comparing each cluster with all other cells in the data set followed by Benjamini–Hochberg correction for multiple testing
Fig. 7
Fig. 7
Intercellular signaling patterns involving SnC. A Summary of methodology to obtain intercluster signaling patterns. A whole-cell fraction scRNAseq data set from mice treated with VML with saline, biomaterial implants, or naïve animals was obtained 1 week after surgery with enrichment of CD45+ cells using MACS beads. After mapping stromal clusters to the data set, Domino was used to calculate intercluster signaling patterns. B Visualization of stromal and non-stromal clusters within the whole-cell fraction scRNAseq data set. Stromal clusters are colored as in the stromal scRNAseq data set shown in Fig. 3. C Signaling predicted to be actively targeting myeloid cells. D Feature plots of components of signaling pathways predicted to be active from pericytes targeting myeloid cells and E from myeloid cells targeting fibrotic fibroblasts. Solid lines represent ligands capable of activating receptors in the CellphoneDB2 database and dotted lines represent correlation between transcription factors and receptors
Fig. 8
Fig. 8
Validation of Domino-predicted intercellular signaling patterns. A A graphical representation of signaling pathways involving the pericyte and fibrotic senescent populations predicted by Domino. In the PCL microenvironment, pericytes express IL34 binding to and activating CSF1R on myeloid cells. The myeloid cells further express TGFB1 which induces fibrosis in fibrotic SnCs through TGFBR1. B Immunofluorescent staining of p16.INK4a and macrophage marker F4/80 near the PCL implant (left). FISH staining for immune cell marker CD45 (Ptprc; yellow), stromal cell marker CD29 (Itgb1; pink), and p16 (Cdkn2a; blue) near the PCL implant (right). Both images are representative of animals treated with PCL implants 6 weeks post-surgery, scale bar = 20 μm. C Gene expression of select transcripts predicted to be involved in signaling between senescent pericytes and macrophages after co-culture of senescent stromal cells with macrophages. Gene expression of Il34 is compared between quiescent (QSN) and SnC stromal cells while other genes are shown in macrophages cultured alone or with SnC stromal cells in transwell plates. D Gene set enrichment for the Domino-predicted Bcl11a and Gli1 target genes in macrophages cultured with SnC compared to cultured alone. Positive enrichment indicates overexpression of the module of genes predicted to be targeted by each transcription factor in macrophages co-cultured with SnC. E Gene set enrichment for Hallmark Hypoxia and TNFα signaling gene sets in macrophages cultured with SnC compared to cultured alone (left). Positive enrichment indicates overexpression of the module of genes predicted to be targeted by each transcription factor in macrophages co-cultured with SnC. Volcano plots showing fold change and statistical significance of each gene in the gene sets are also shown (right)

References

    1. Campisi J. Aging, cellular senescence, and cancer. Annu Rev Physiol. 2013;75:685–705. - PMC - PubMed
    1. Childs BG, Li H, Van Deursen JM. Senescent cells: a therapeutic target for cardiovascular disease. J Clin Investig. 2018;128(4):1217–1228. - PMC - PubMed
    1. Faust HJ, et al. IL-17 and immunologically induced senescence regulate response to injury in osteoarthritis. J Clin Investig. 2020;130(10):5493–5507. - PMC - PubMed
    1. Howcroft TK, et al. The role of inflammation in age-related disease. Aging (Albany NY) 2013;5(1):84. - PMC - PubMed
    1. Jeon OH, et al. Local clearance of senescent cells attenuates the development of post-traumatic osteoarthritis and creates a pro-regenerative environment. Nat Med. 2017;23(6):775–781. - PMC - PubMed

Publication types