

A Randomised Control Trial to Explore the Impact and Efficacy of the Healum Collaborative Care Planning Software and App on Condition Management in the Type 2 Diabetes Mellitus Population in NHS Primary Care
- PMID: 37079268
- PMCID: PMC10116475
- DOI: 10.1007/s13300-023-01404-6
A Randomised Control Trial to Explore the Impact and Efficacy of the Healum Collaborative Care Planning Software and App on Condition Management in the Type 2 Diabetes Mellitus Population in NHS Primary Care
Abstract
Introduction: Effective and scalable solutions to support management of Type 2 Diabetes (T2D) at a distance are a priority for health systems worldwide. The use of personalised care planning has been shown to be effective at improving the health outcomes and the experience of care amongst people with T2D and other long-term health conditions. Here we describe a specific example of such an intervention.
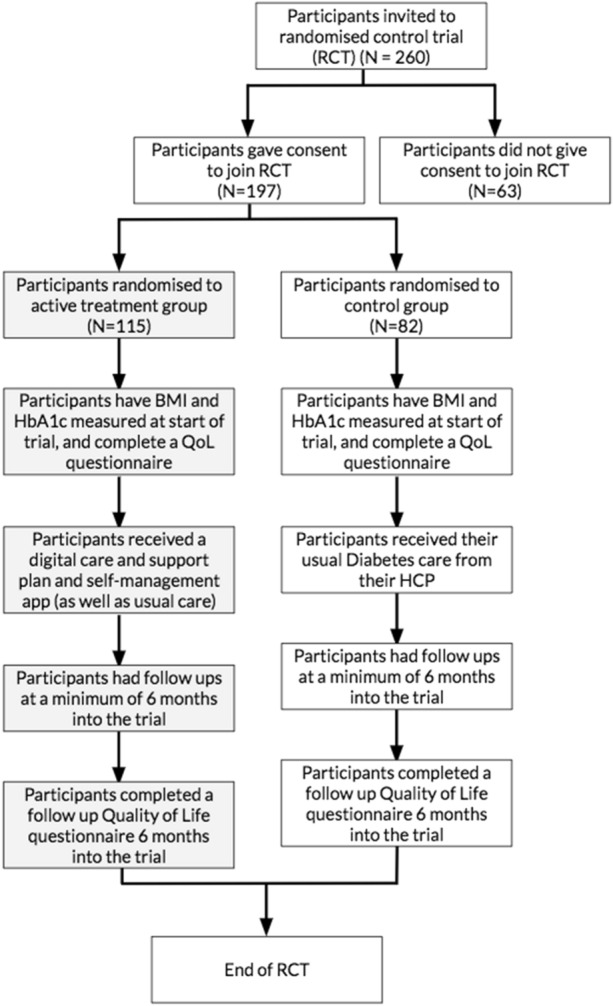
Methods: The sample comprised 197 participants with T2D randomised to either the active intervention group with digital health planning (App + usual care), with 115 participants, or the control group (usual care), with 82 participants. We analysed data in relation to changes in body mass index (BMI) and glycated haemoglobin (HbA1c) over a 6-month follow-up period. We also analysed responses to questionnaires sent out and held interviews with participants that were in the active treatment group and therefore had a care plan created and access to an app.
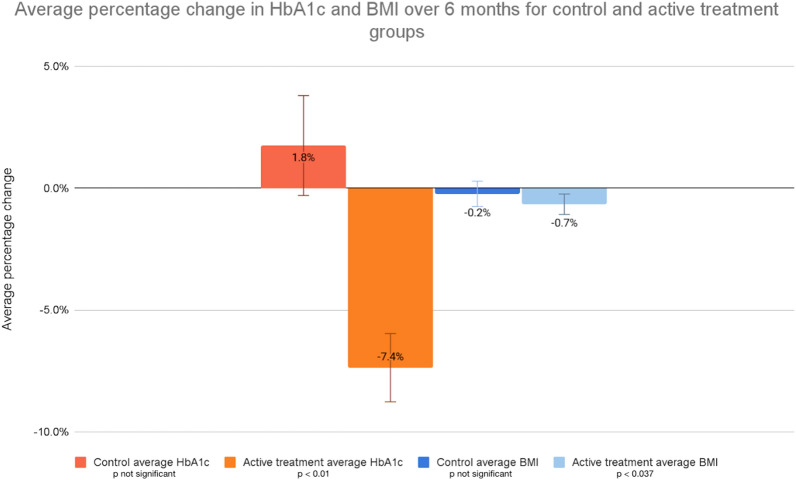
Results: The active treatment group had significant reductions in HbA1c (p < 0.01) and BMI (p < 0.037) vs the control group (no significant change). The average percentage change in HbA1c for the treatment group over 6 months was - 7.4% (± SE 1.4%), compared with 1.8% (± SE 2.1%) for the control group. The average percentage change in BMI for the treatment group was - 0.7% (± SE 0.4%) and it was - 0.2% (± SE 0.5%) for the control group. A higher percentage of the active treatment group reduced their HbA1c and BMI than the control group. For HbA1c, 72.4% of the active treatment group reduced their HbA1c, compared to 41.5% of the control group. For BMI, 52.7% of the active treatment group experienced a reduction, compared to 42.9% for the control group. Self-measured quality of life (QoL) improved for patients in the active treatment group, shown by an increase in their pre-trial to post-trial EQ-5D-5L rating by an average of 0.0464 (± SE 0.0625), compared to a decrease of 0.0086 (± SE 0.0530) for the control group. The average EQ VAS score also increased pre- to post-trial for the active treatment group, on average by 8.2%, whereas it decreased by an average of - 2.8% for the control group.
Conclusion: These findings point to how the provision of personalised plans of care, support and education linked to a mobile app, can result in HbA1c and BMI reduction for many individuals with T2D. The use of a patient management app as well as a personalised care plan also led to an improvement in patient self-rated QoL and engagement.
Keywords: Digital care planning; HbA1c; Type 2 diabetes.
© 2023. The Author(s).
Conflict of interest statement
Dr Adrian H Heald, Sarah Roberts, Lucia Albeldo Gimeno, Erin Gillingham, Morwenna James, Alison White, Laura Beresford, Anuj Saboo, Alan Crofts and Jonathan Abraham have nothing to disclose.
Figures


References
-
- International Diabetes Federation. IDF Diabetes Atlas 9th edition 2019. https://www.diabetesatlas.org. Accessed 1 Mar 2023.
-
- Diabetes.co.uk. Cost of diabetes 2019. https://www.diabetes.co.uk/cost-of-diabetes.html. Accessed 1 Mar 2023.
Grants and funding
LinkOut - more resources
Full Text Sources
