

Age-Dependent Changes in the Water Content and Optical Power of the In Vivo Mouse Lens Revealed by Multi-Parametric MRI and Optical Modeling
- PMID: 37079314
- PMCID: PMC10132318
- DOI: 10.1167/iovs.64.4.24
Age-Dependent Changes in the Water Content and Optical Power of the In Vivo Mouse Lens Revealed by Multi-Parametric MRI and Optical Modeling
Abstract
Purpose: The purpose of this study was to utilize in vivo magnetic resonance imaging (MRI) and optical modeling to investigate how changes in water transport, lens curvature, and gradient refractive index (GRIN) alter the power of the mouse lens as a function of age.
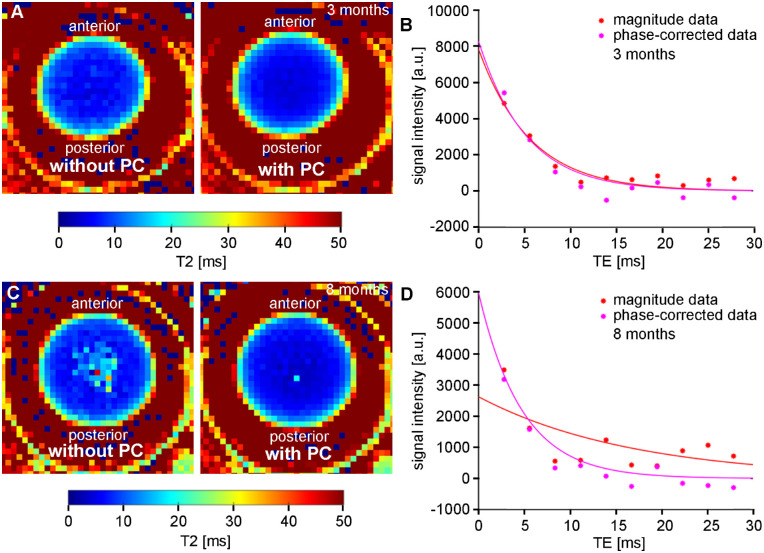
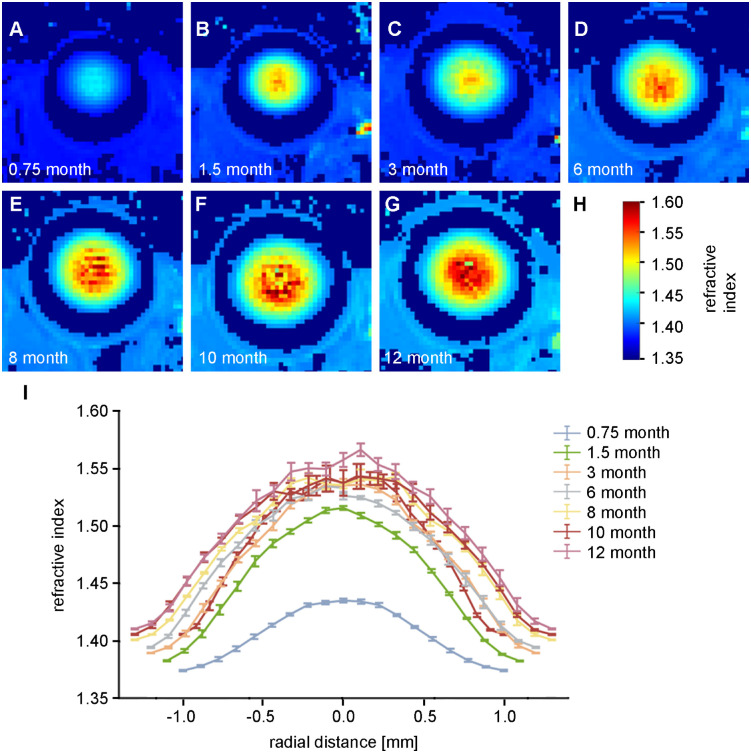
Methods: Lenses of male C57BL/6 wild-type mice aged between 3 weeks and 12 months (N = 4 mice per age group) were imaged using a 7T MRI scanner. Measurements of lens shape and the distribution of T2 (water-bound protein ratios) and T1 (free water content) values were extracted from MRI images. T2 values were converted into the refractive index (n) using an age-corrected calibration equation to calculate the GRIN at different ages. GRIN maps and shape parameters were inputted into an optical model to determine ageing effects on lens power and spherical aberration.
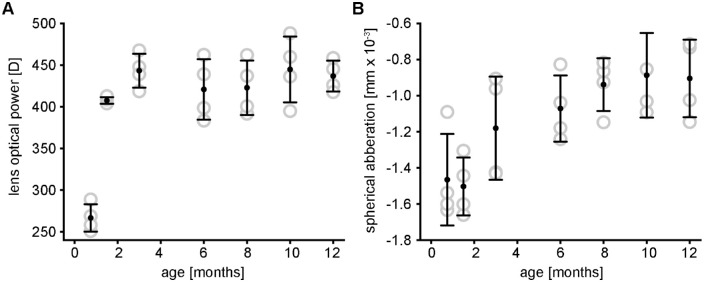
Results: The mouse lens showed two growth phases. From 3 weeks to 3 months, T2 decreased, GRIN increased, and T1 decreased. This was accompanied by increased lens thickness, volume, and surface radii of curvatures. The refractive power of the lens also increased significantly, and a negative spherical aberration was developed and maintained. Between 6 and 12 months of age, all physiological, geometrical, and optical parameters remained constant, although the lens continued to grow.
Conclusions: In the first 3 months, the mouse lens power increased as a result of changes in shape and in the GRIN, the latter driven by the decreased water content of the lens nucleus. Further research into the mechanisms regulating this decrease in mouse lens water could improve our understanding of how lens power changes during emmetropization in the developing human lens.
Conflict of interest statement
Disclosure:
Figures


Similar articles
-
Contribution of shape and gradient refractive index to the spherical aberration of isolated human lenses.Invest Ophthalmol Vis Sci. 2014 Apr 21;55(4):2599-607. doi: 10.1167/iovs.14-14201. Invest Ophthalmol Vis Sci. 2014. PMID: 24677101
-
Influence of shape and gradient refractive index in the accommodative changes of spherical aberration in nonhuman primate crystalline lenses.Invest Ophthalmol Vis Sci. 2013 Sep 11;54(9):6197-207. doi: 10.1167/iovs.13-11996. Invest Ophthalmol Vis Sci. 2013. PMID: 23927893 Free PMC article.
-
Crystalline lens gradient refractive index distribution in the guinea pig.Ophthalmic Physiol Opt. 2020 May;40(3):308-315. doi: 10.1111/opo.12667. Ophthalmic Physiol Opt. 2020. PMID: 32338776
-
The optical properties of the crystalline lens and their significance.Clin Exp Optom. 2003 Jan;86(1):3-18. Clin Exp Optom. 2003. PMID: 12568647 Review.
-
The physiological optics of the lens.Prog Retin Eye Res. 2017 Jan;56:e1-e24. doi: 10.1016/j.preteyeres.2016.09.002. Epub 2016 Sep 14. Prog Retin Eye Res. 2017. PMID: 27639549 Review.
Cited by
-
Connexin 50 Influences the Physiological Optics of the In Vivo Mouse Lens.Invest Ophthalmol Vis Sci. 2024 Jul 1;65(8):19. doi: 10.1167/iovs.65.8.19. Invest Ophthalmol Vis Sci. 2024. PMID: 38984874 Free PMC article.
-
Alterations in Lens Free Water Distribution Are Associated with Shape Deformation in Accommodation.Ophthalmol Sci. 2023 Oct 3;4(1):100404. doi: 10.1016/j.xops.2023.100404. eCollection 2024 Jan-Feb. Ophthalmol Sci. 2023. PMID: 38027421 Free PMC article.
-
A First-Passage Model of Intravitreal Drug Delivery and Residence Time-Influence of Ocular Geometry, Individual Variability, and Injection Location.Invest Ophthalmol Vis Sci. 2024 Oct 1;65(12):21. doi: 10.1167/iovs.65.12.21. Invest Ophthalmol Vis Sci. 2024. PMID: 39412819 Free PMC article.
References
-
- Donaldson PJ, Grey AC, Heilman BM, Lim JC, Vaghefi E.. The physiological optics of the lens. Prog Retin Eye Res. 2017; 56: e1–e24. - PubMed
-
- Pierscionek BK, Regini JW.. The gradient index lens of the eye: An opto-biological synchrony. Prog Retin Eye Res. 2012; 31: 332–349. - PubMed
-
- Wallman J, Winawer J.. Homeostasis of eye growth and the question of myopia. Neuron. 2004; 43: 447–468. - PubMed
-
- Mutti DO, Mitchell GL, Jones LA, et al. .. Axial growth and changes in lenticular and corneal power during emmetropization in infants. Invest Ophthalmol Vis Sci. 2005; 46: 3074–3080. - PubMed
Publication types
MeSH terms
Grants and funding
LinkOut - more resources
Full Text Sources
