. 2023 Apr 20:12:e83118.
doi: 10.7554/eLife.83118.

Common genetic variations in telomere length genes and lung cancer: a Mendelian randomisation study and its novel application in lung tumour transcriptome

Affiliations

Common genetic variations in telomere length genes and lung cancer: a Mendelian randomisation study and its novel application in lung tumour transcriptome

Ricardo Cortez Cardoso Penha et al. Elife. .

Abstract

Background: Genome-wide association studies (GWASs) have identified genetic susceptibility variants for both leukocyte telomere length (LTL) and lung cancer susceptibility. Our study aims to explore the shared genetic basis between these traits and investigate their impact on somatic environment of lung tumours.

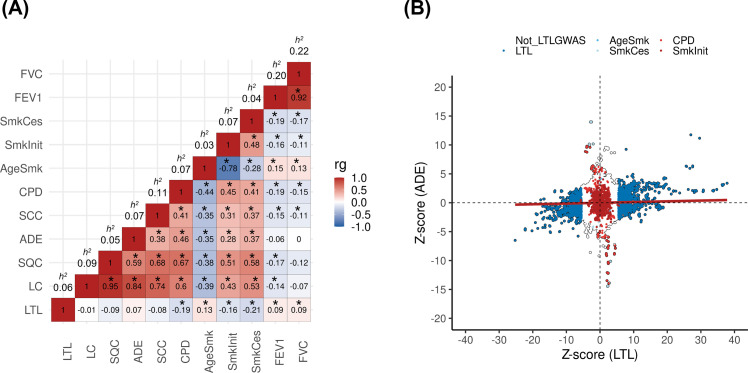
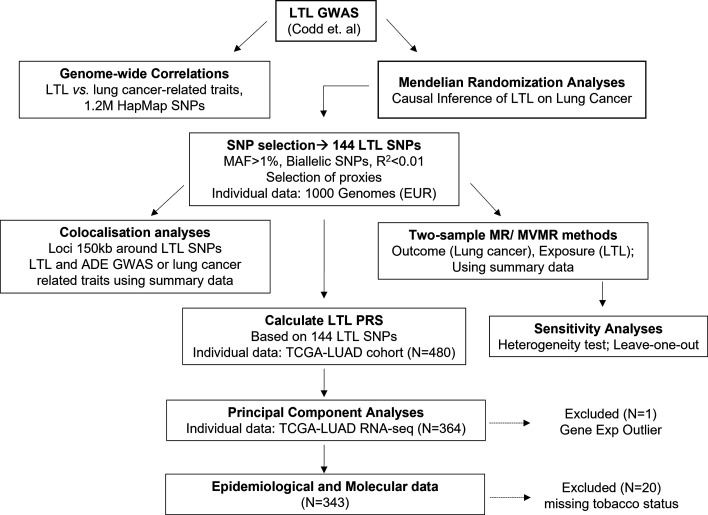
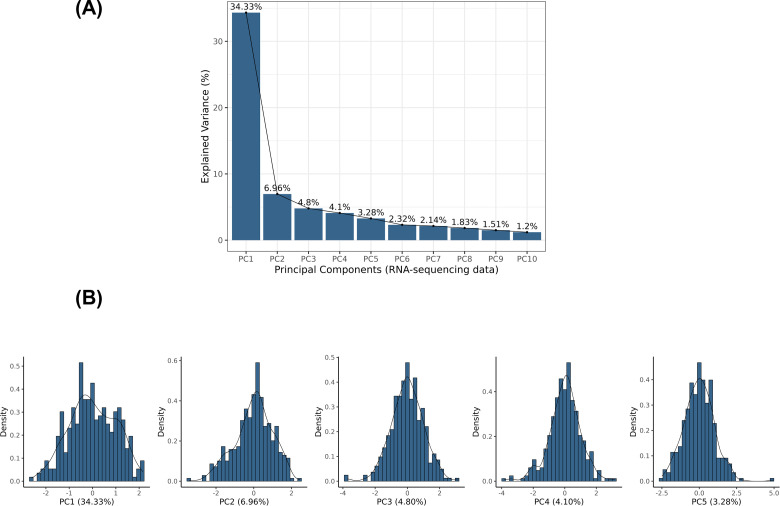
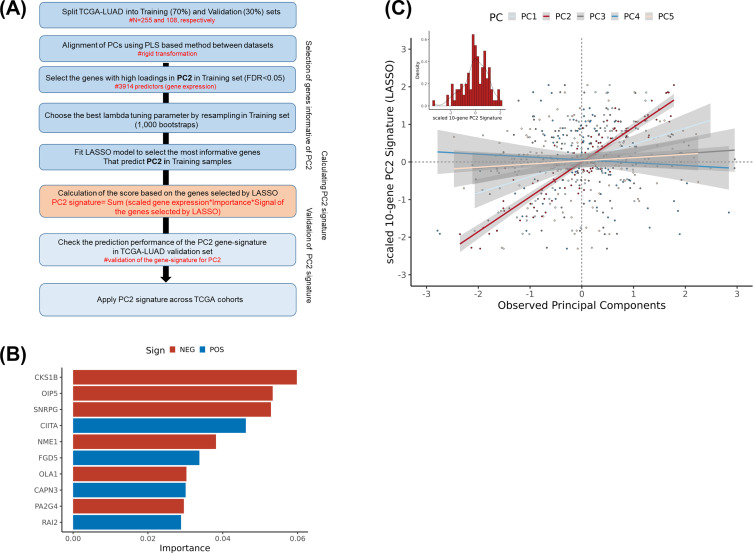
Methods: We performed genetic correlation, Mendelian randomisation (MR), and colocalisation analyses using the largest available GWASs summary statistics of LTL (N=464,716) and lung cancer (N=29,239 cases and 56,450 controls). Principal components analysis based on RNA-sequencing data was used to summarise gene expression profile in lung adenocarcinoma cases from TCGA (N=343).

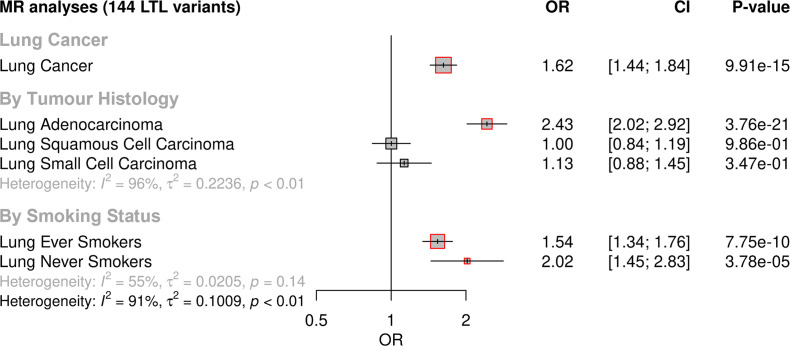
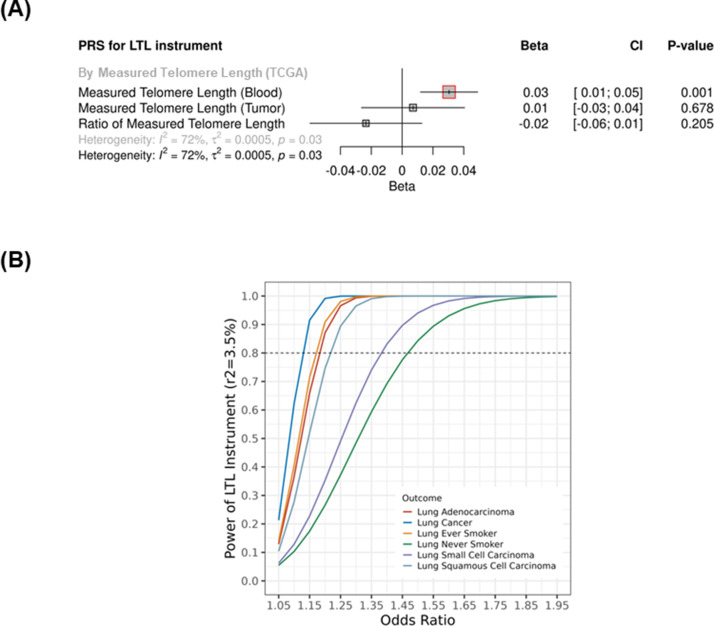
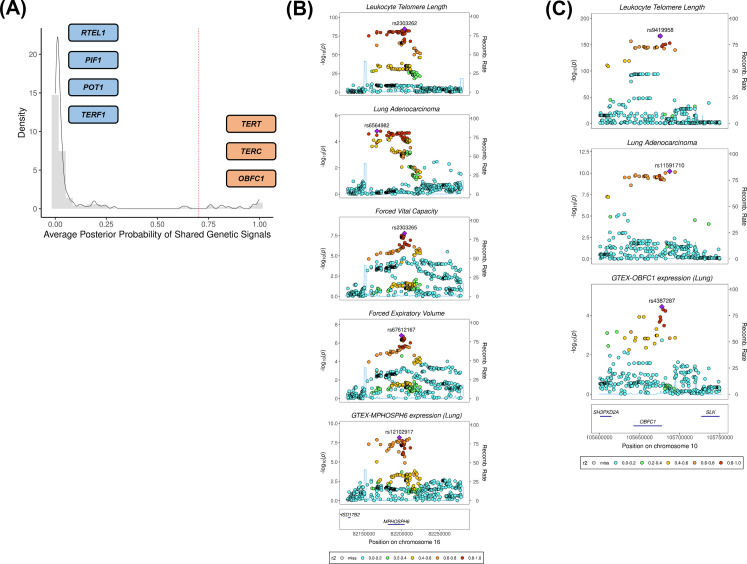
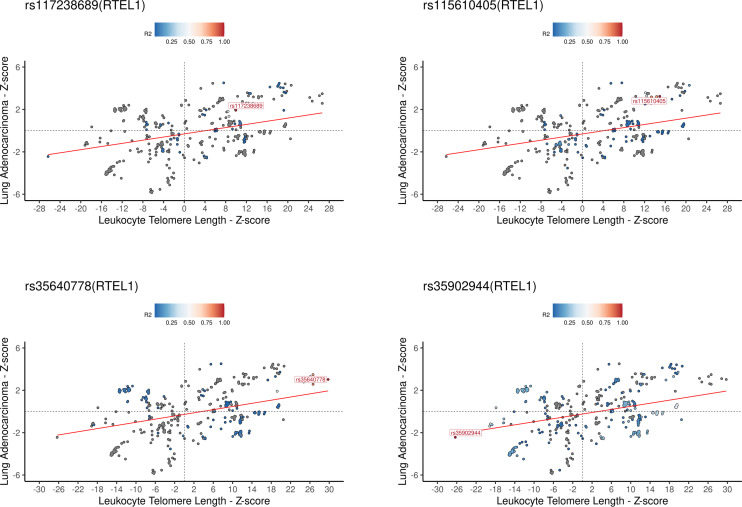
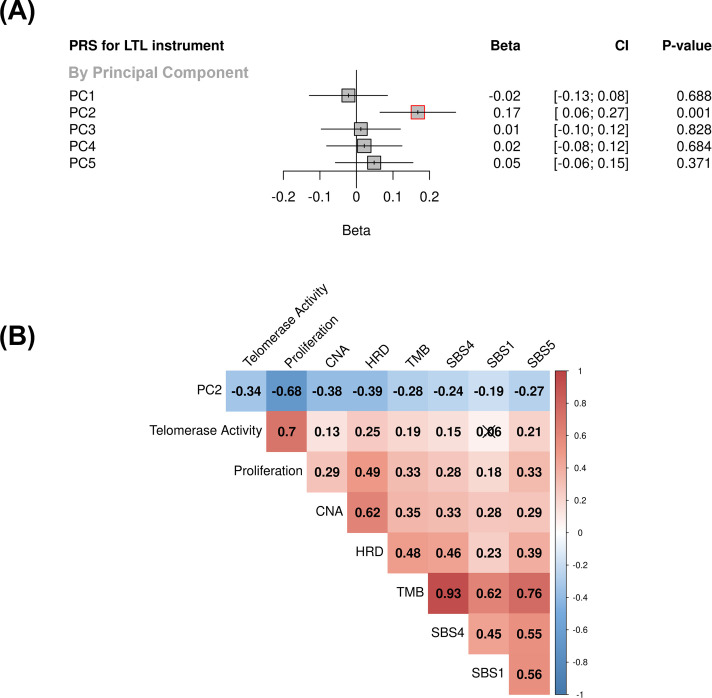
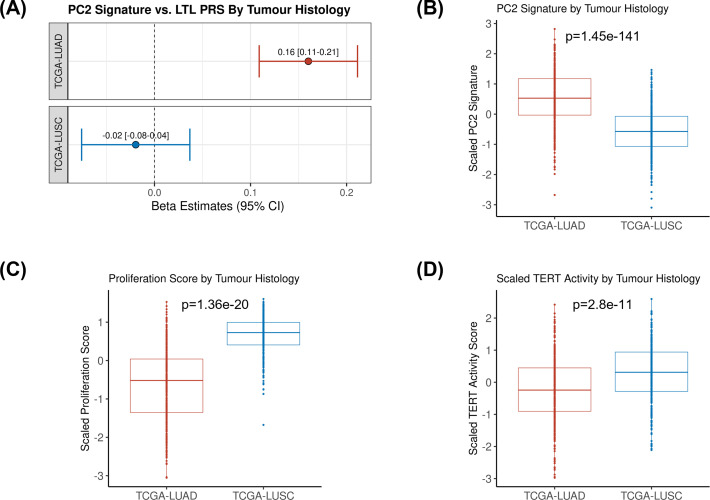
Results: Although there was no genome-wide genetic correlation between LTL and lung cancer risk, longer LTL conferred an increased risk of lung cancer regardless of smoking status in the MR analyses, particularly for lung adenocarcinoma. Of the 144 LTL genetic instruments, 12 colocalised with lung adenocarcinoma risk and revealed novel susceptibility loci, including MPHOSPH6, PRPF6, and POLI. The polygenic risk score for LTL was associated with a specific gene expression profile (PC2) in lung adenocarcinoma tumours. The aspect of PC2 associated with longer LTL was also associated with being female, never smokers, and earlier tumour stages. PC2 was strongly associated with cell proliferation score and genomic features related to genome stability, including copy number changes and telomerase activity.

Conclusions: This study identified an association between longer genetically predicted LTL and lung cancer and sheds light on the potential molecular mechanisms related to LTL in lung adenocarcinomas.

Funding: Institut National du Cancer (GeniLuc2017-1-TABAC-03-CIRC-1-TABAC17-022), INTEGRAL/NIH (5U19CA203654-03), CRUK (C18281/A29019), and Agence Nationale pour la Recherche (ANR-10-INBS-09).

Keywords: GWAS; Genome Stability; Mendelian randomisation; epidemiology; gene expression; global health; human; lung cancer; telomere length.


Conflict of interest statement

RC, KS, JA, PH, SK, VC, NS, CN, MM, AG, CA, PB, RH, LK, JM No competing interests declared

Figures

Figure 1.
Figure 1.. Genetic correlations between leukocyte telomere length (LTL) and lung cancer (LC) related traits.
(A) Heatmap representing the genetic correlation analyses (rg) for LTL across LC, histological subtypes (lung adenocarcinoma [ADE], squamous cell carcinoma [SQC], and small-cell carcinoma [SCC]), smoking propensity (cigarettes per day [CPD], smoking cessation [SmkCes], Smoking initiation [SmkInit], and age of smoking initiation [AgeSmk]), and lung function related (forced vital capacity [FVC] and forced expiratory volume [FEV1]) traits. The black star indicates correlations that passed Bonferroni correction (p<4x10–04). Heritability (h2) as the proportion of the phenotypic variance caused by SNPs. (B) Plot of Z-scores (ADE versus LTL), restricting to the Hapmap SNPs (~1.2 million) but excluding HLA region. Genome-wide significant SNPs (p<5x10–08) for each trait were coloured (CPD in red, SmkInit in dark red, LTL in dark blue, AgeSmk in blue, SmkCes in lightblue, and not genome-wide hits for LTL or any other selected trait in white). Linear regression line was coloured in red.
Figure 1—figure supplement 1.
Figure 1—figure supplement 1.. Design of the study.
Upper: the leukocyte telomere length (LTL) variants were derived from the latest genome-wide association study (GWAS) in UK Biobank (UKBB) participants by Codd et al. Genome-wide correlations between LTL and lung cancer related traits were performed. Focus on a subset of LTL variants selected for Mendelian randomisation (MR) framework. Middle: selection of independent SNPs as LTL instrument for causal inference of LTL on lung cancer risk. Explore biological meaning of these variants using colocalisation methods and principal component analyses to summarise gene expression data. Bottom: calculate LTL polygenic risk score (PRS) based on the 144 SNPs and evaluate its association with principal components and epidemiological, and molecular data of lung adenocarcinoma tumours from The Cancer Genome Atlas (TCGA) dataset (TCGA-lung adenocarcinoma [LUAD]).
Figure 2.
Figure 2.. Genetically predicted leukocyte telomere length (LTL) association with lung cancer.
Lung cancer (by histology or by smoking status) risk associations with the LTL instrument from the inverse-variance-weighted MR analyses are expressed as OR per SD increase in genetically predicted LTL. Statistically significant associations with p-values<0.05 (red square). Heterogeneity is estimated by the statistic I2, tau variance of subgroups (τ2), and p-values for Cochran’s Q heterogeneity measure.
Figure 2—figure supplement 1.
Figure 2—figure supplement 1.. Sensitivity analysis of the genetically predicted leukocyte telomere length (LTL) Mendelian randomisation (MR) instrument.
(A) Telomere length (TL) was measured by Barthel et al. in a subset of high-confident samples from The Cancer Genome Atlas (TCGA) cohorts using whole-genome sequencing (n=655). TL was directly measured in blood and tumour samples, and log(tTL/nTL) were also obtained from several TCGA cohorts. Associations were expressed as beta estimate per SD longer LTL in log scale. p-Values<0.05 (red square). Sex, age at diagnosis, cohort, and principal components of genetic ancestry (PC1-5) were used as covariates in the linear regression model. Heterogeneity is estimated by the statistic I2, tau variance of subgroups (τ2), and p-values for Cochran’s Q heterogeneity measure. (B) Power calculation by lung cancer strata considering a variance explained by the LTL instrument of 3.5% and alpha type-1 error rate of 5%.
Figure 3.
Figure 3.. Colocalisation analyses for the genetic loci defined by the 144 leukocyte telomere length (LTL) variants.
(A) Distribution of the average posterior probability for shared genetic loci between LTL and lung adenocarcinoma, highlighting in orange the telomere maintenance loci that colocalised (avg_PP4≥0.70) and in blue the ones where there was limited evidence for colocalisation (avg_PP4<0.70). Dashed red line represents the arbitrary avg_PP4 cutoff of 0.70. Representative stack plots for the multi-trait colocalisation results within (B) MPHOSPH6 and (C) OBFC1 loci, centred on a 150 kb LD window of rs2303262 and rs9419958 variants, respectively. Left Y-axis represents the –log10(p-values) of the association in the respective genome-wide association study for a given trait. The right Y-axis represents the recombination rate for the genetic loci. The X-axis represents the chromosome position. SNPs are coloured by the linkage disequilibrium correlation threshold (r2) with the query labelled SNP in European population. Sentinel SNPs within the defined LD window were labelled in each trait.
Figure 3—figure supplement 1.
Figure 3—figure supplement 1.. Association plots for leukocyte telomere length (LTL) and lung adenocarcinoma at RTEL1 locus.
Z-score plots for genetically predicted LTL and lung adenocarcinoma risk for the four LTL variants annotated for RTEL1. The genetic variants were coloured by the linkage disequilibrium correlation threshold (r2) with the query labelled SNP in a defined LD window of 150 kb centred on the query SNP in European populations. Z-score defined as the beta estimate divided by SE for each SNPs in the respective genome-wide association study.
Figure 4.
Figure 4.. Associations between molecular expression patterns of lung adenocarcinoma tumours, LTL PRS, and The Cancer Genome Atlas (TCGA) features.
(A) LTL PRS association with the first five principal components based on RNA-sequencing data of lung adenocarcinomas tumours (n=343). Results are expressed as beta estimate per SD increase in genetically predicted LTL. Linear regression model adjusted by sex, age, smoking status, and PC1-5 (genetic ancestry) covariates. Statistically significant associations with p-values<0.05 (red square). (B) Heatmap representing the correlations among PC2 and selected molecular features related to telomere length canonical roles. LTL = leukocyte telomere length; PRS = polygenic risk score; PC = principal component; TMB = tumour total mutation burden; HRD = homologous recombination deficiency, SBS (single base substitution DNA mutational signatures). SBS1 and SBS5 are DNA mutational signatures associated with age-related processes, and SBS4 is associated with tobacco smoking exposure. X-shaped marker to cross correlations with p-value>0.05.
Figure 4—figure supplement 1.
Figure 4—figure supplement 1.. Principal component analysis (PCA) based on RNA-sequencing data.
The RNA sequencing data from 343 primary lung adenocarcinoma tumour samples were retrieved. (A) Principal components analysis was applied to the centred log-transformed gene read counts, and the first five principal components were represented, which explained 53.5% of the variance in the gene expression for those samples. (B) The distributions of the first five principal components are represented in the density plots.
Figure 5.
Figure 5.. Comparing inferred PC2 gene expression signature by lung cancer histological subtypes.
(A) Leukocyte telomere length (LTL) polygenic risk score (PRS) association with the 10-gene expression signature of PC2 in lung adenocarcinoma (The Cancer Genome Atlas [TCGA]-LUAD, N=343) and squamous cell carcinoma (TCGA-LUSC, N=338) cases from TCGA dataset. Results are expressed as beta estimate per SD increase in genetically predicted LTL. Linear regression model adjusted by sex, age, and PC1-5 (genetic ancestry) covariates, PC2 signature as outcome. Statistically significant associations with -values<0.05. Values per SD of (B) PC2, (C) proliferation score, and (D) telomerase/TERT activity gene expression signatures by lung cancer histological subtypes (TCGA-LUAD and TCGA-LUSC). p-Values derived from Student’s t-tests.
Figure 5—figure supplement 1.
Figure 5—figure supplement 1.. Generating inferred PC2 signature based on RNA-sequencing data.
(A) Workflow for the generation of the PC2 signature. Calculate principal components based on RNA-sequencing data in both The Cancer Genome Atlas (TCGA)-lung adenocarcinoma (LUAD) training (N=255, 70%) and validation (N=108, 30%) datasets and use partial least square (PLS)-based method to align principal components (upper). Select the most informative genes correlated with the observed PC2 in the training dataset using least absolute shrinkage and selection operator (LASSO) regression model and validate it in the validation set (middle). Apply the PC2 signature to the TCGA-LUSC (lung squamous cell carcinoma) and TCGA-LUAD cohorts. (B) The ranked absolute coefficients/importance of the 10 genes selected by the LASSO models. Negative coefficients in red and positive ones in blue. (C) Scatter plot for the correlations between PC2 gene expression signature and observed principal components (PC1-5) based on RNA-sequencing data in the validation set. PC1 in light blue, PC2 in red, PC3 in grey, PC4 in blue, and PC5 in salmon colours.

Update of

  • doi: 10.1101/2022.08.24.22279131

Similar articles

Cited by

References

    1. Adler AS, McCleland ML, Yee S, Yaylaoglu M, Hussain S, Cosino E, Quinones G, Modrusan Z, Seshagiri S, Torres E, Chopra VS, Haley B, Zhang Z, Blackwood EM, Singh M, Junttila M, Stephan JP, Liu J, Pau G, Fearon ER, Jiang Z, Firestein R. An integrative analysis of colon cancer identifies an essential function for prpf6 in tumor growth. Genes & Development. 2014;28:1068–1084. doi: 10.1101/gad.237206.113. - DOI - PMC - PubMed
    1. Aviv A, Anderson JJ, Shay JW. Mutations, cancer and the telomere length paradox. Trends in Cancer. 2017;3:253–258. doi: 10.1016/j.trecan.2017.02.005. - DOI - PMC - PubMed
    1. Barthel FP, Wei W, Tang M, Martinez-Ledesma E, Hu X, Amin SB, Akdemir KC, Seth S, Song X, Wang Q, Lichtenberg T, Hu J, Zhang J, Zheng S, Verhaak RGW. Systematic analysis of telomere length and somatic alterations in 31 cancer types. Nature Genetics. 2017;49:349–357. doi: 10.1038/ng.3781. - DOI - PMC - PubMed
    1. Bulik-Sullivan BK, Loh PR, Finucane HK, Ripke S, Yang J. LD Score regression distinguishes confounding from polygenicity in genome-wide association studies. Nature Genetics. 2015;47:291–295. doi: 10.1038/ng.3211. - DOI - PMC - PubMed
    1. Bycroft C, Freeman C, Petkova D, Band G, Elliott LT, Sharp K, Motyer A, Vukcevic D, Delaneau O, O’Connell J, Cortes A, Welsh S, Young A, Effingham M, McVean G, Leslie S, Allen N, Donnelly P, Marchini J. The UK Biobank resource with deep phenotyping and genomic data. Nature. 2018;562:203–209. doi: 10.1038/s41586-018-0579-z. - DOI - PMC - PubMed

Publication types