. 2023 Jun 1;133(11):e164317.
doi: 10.1172/JCI164317.

HSV-2 triggers upregulation of MALAT1 in CD4+ T cells and promotes HIV latency reversal

Affiliations

HSV-2 triggers upregulation of MALAT1 in CD4+ T cells and promotes HIV latency reversal

Carl A Pierce et al. J Clin Invest. .

Abstract

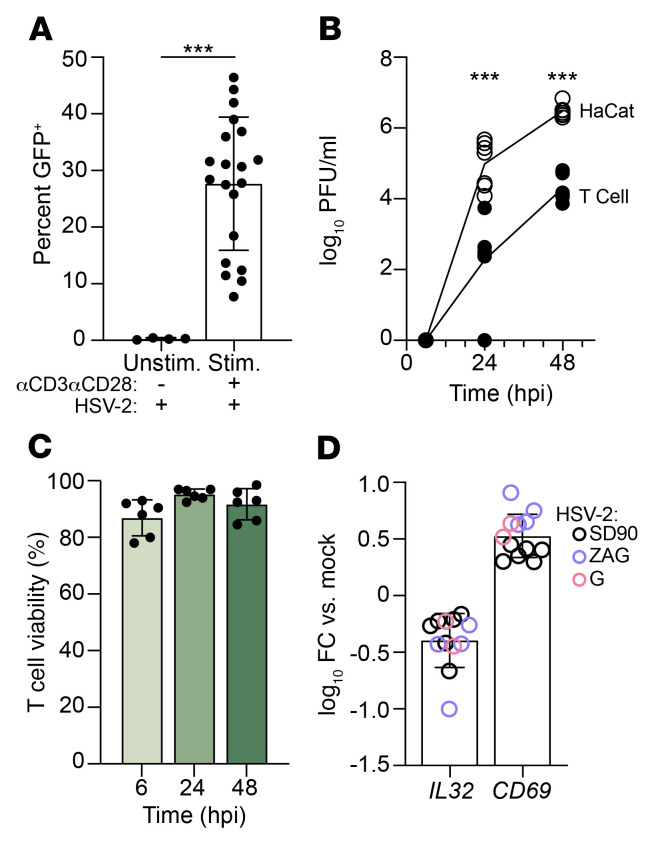
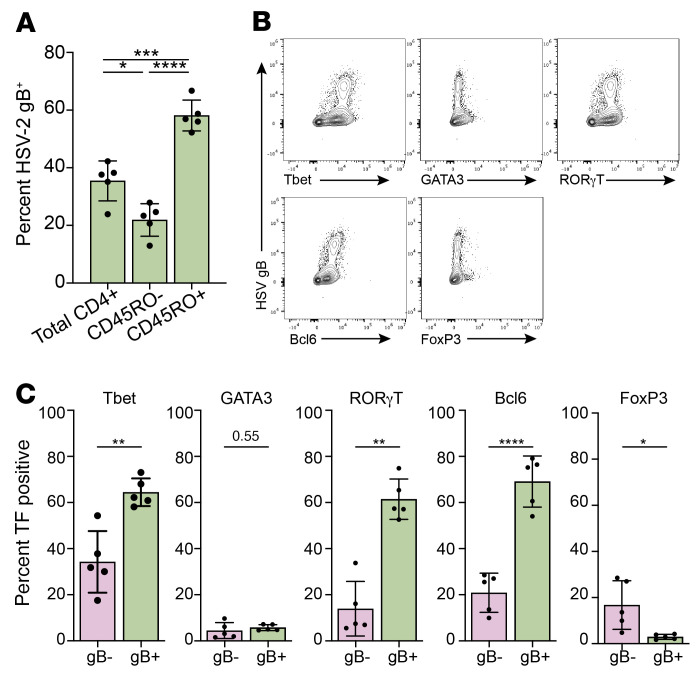
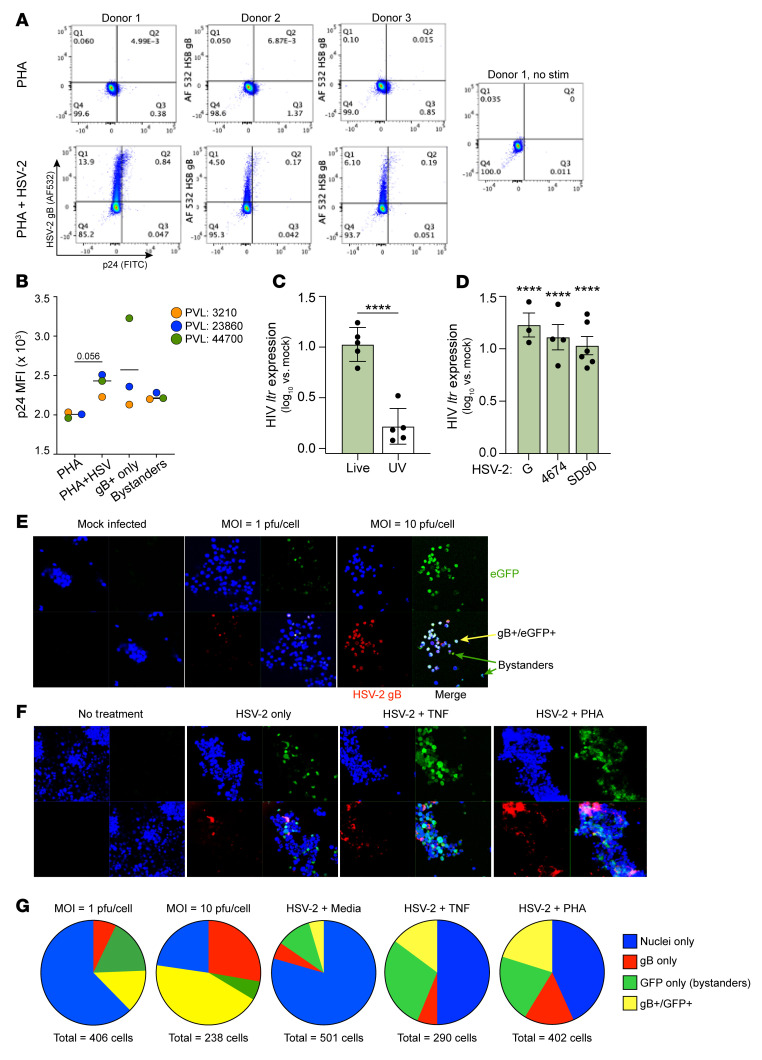
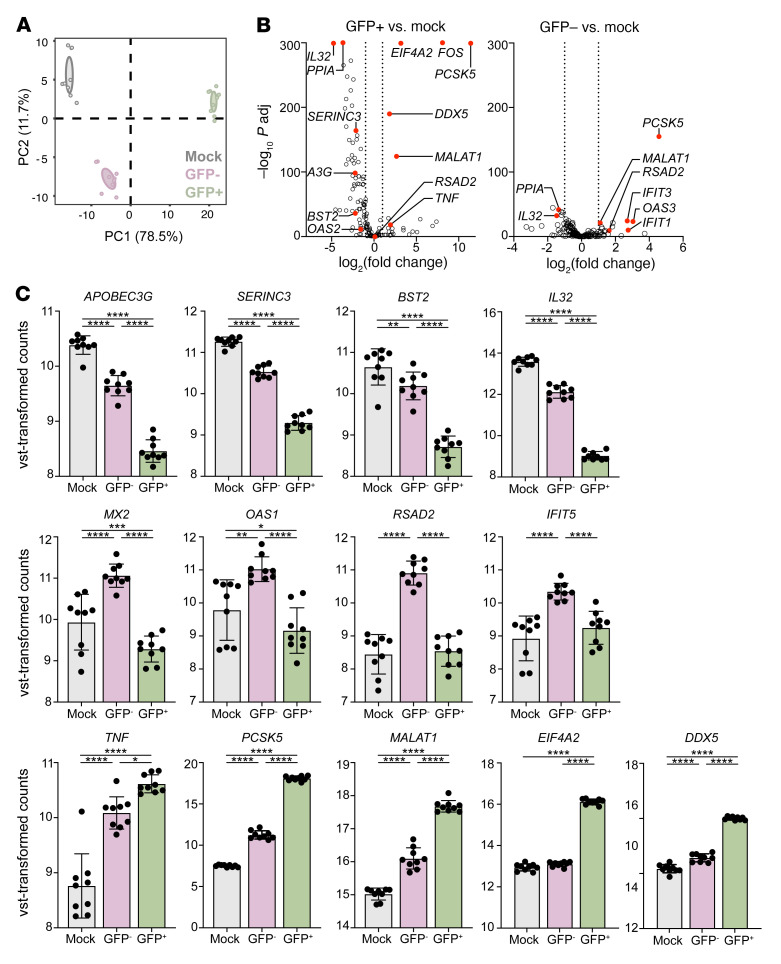
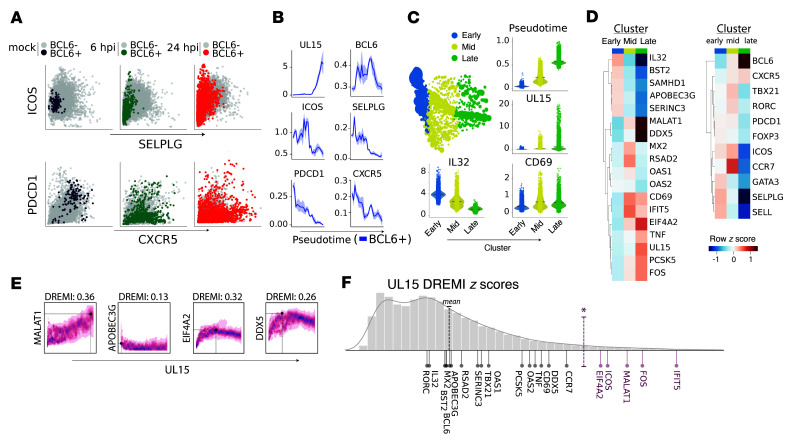
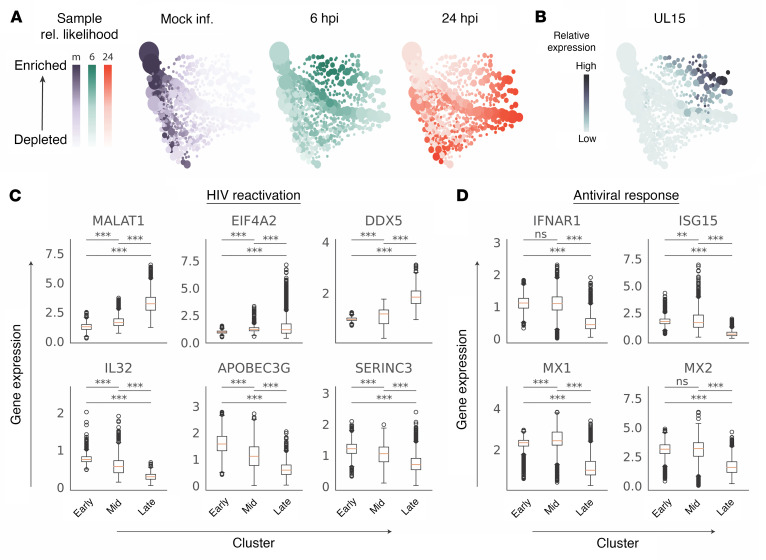
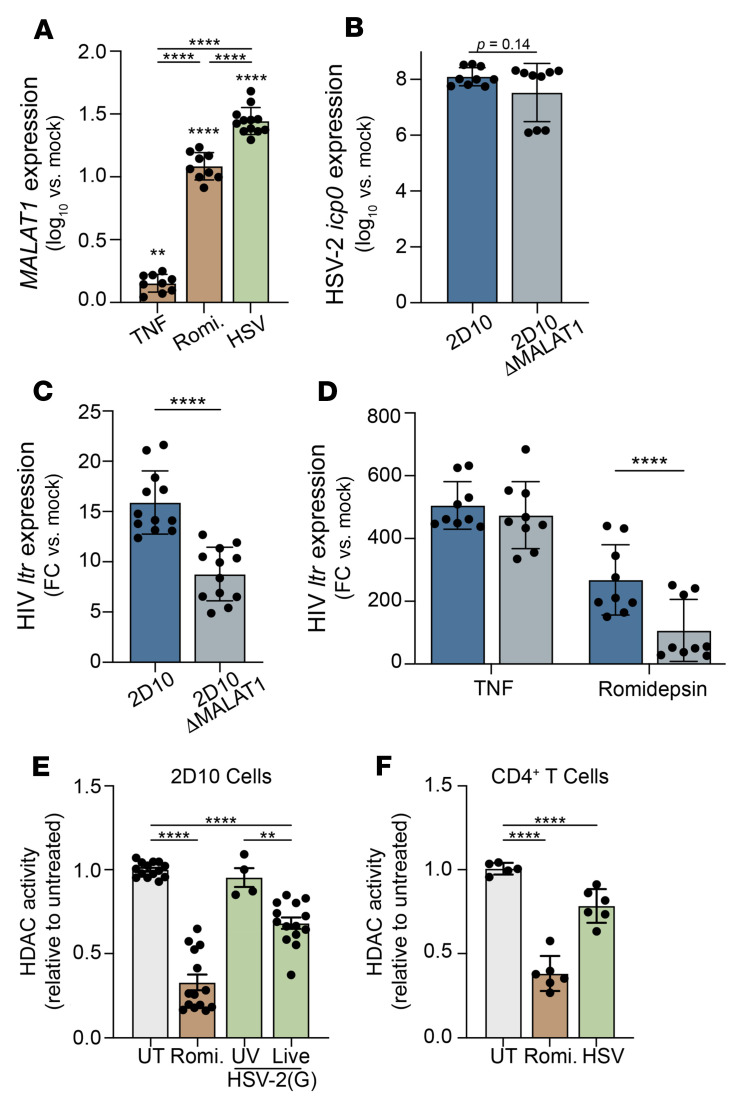
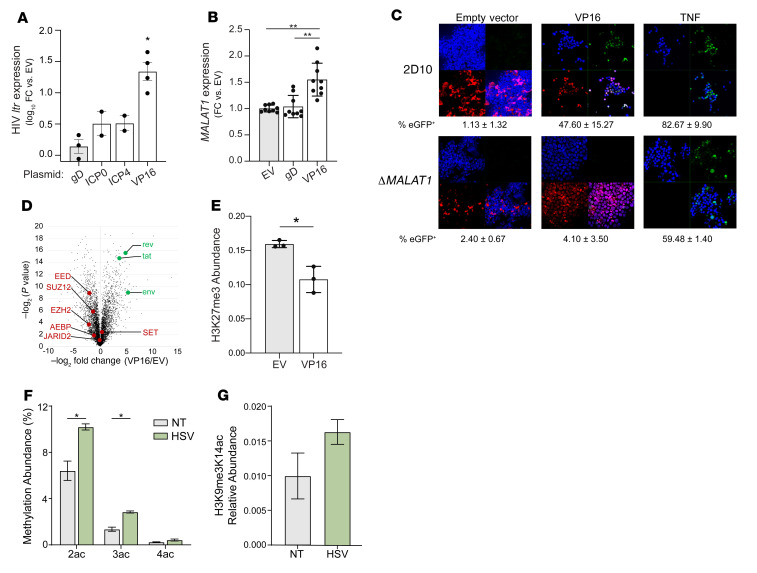
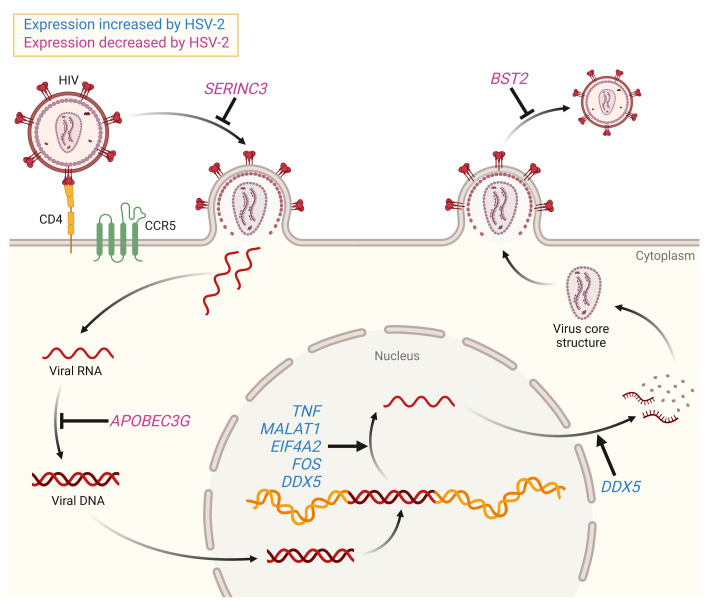
Herpes simplex virus type 2 (HSV-2) coinfection is associated with increased HIV-1 viral loads and expanded tissue reservoirs, but the mechanisms are not well defined. HSV-2 recurrences result in an influx of activated CD4+ T cells to sites of viral replication and an increase in activated CD4+ T cells in peripheral blood. We hypothesized that HSV-2 induces changes in these cells that facilitate HIV-1 reactivation and replication and tested this hypothesis in human CD4+ T cells and 2D10 cells, a model of HIV-1 latency. HSV-2 promoted latency reversal in HSV-2-infected and bystander 2D10 cells. Bulk and single-cell RNA-Seq studies of activated primary human CD4+ T cells identified decreased expression of HIV-1 restriction factors and increased expression of transcripts including MALAT1 that could drive HIV replication in both the HSV-2-infected and bystander cells. Transfection of 2D10 cells with VP16, an HSV-2 protein that regulates transcription, significantly upregulated MALAT1 expression, decreased trimethylation of lysine 27 on histone H3 protein, and triggered HIV latency reversal. Knockout of MALAT1 from 2D10 cells abrogated the response to VP16 and reduced the response to HSV-2 infection. These results demonstrate that HSV-2 contributes to HIV-1 reactivation through diverse mechanisms, including upregulation of MALAT1 to release epigenetic silencing.

Keywords: AIDS/HIV; T cells; Transcription; Virology.


Figures

Figure 1
Figure 1. HSV-2 productively infects activated primary CD4+ T cells and downregulates IL-32 and upregulates CD69 expression.
(A) Primary human CD4+ T cells isolated from healthy donor leukopaks were stimulated by CD3/CD28 cross-linking for 72 hours (n = 22) or left unstimulated (n = 4) and then incubated with GFP-expressing HSV-2(333ZAG) at an MOI of 1 PFU/cell for 2 hours, washed, and cultured for a further 22 hours, and the percentage of GFP+ cells was quantified by flow cytometry. (B) Primary anti-CD3/CD28–stimulated CD4+ T cells (filled symbols) or HaCaT cells (open symbols) were infected with HSV-2(SD90) (MOI = 0.001 PFU/cell), and at the indicated times, the amount of infectious virus released into the culture supernatants was quantified by plaque assays conducted in duplicate on Vero cells. Values of 0 PFU were set to zero before log transformation. Viral yields from the 2 different cell types were compared at 24 and 48 hours. ***P < 0.001, Mann-Whitney test. (C) CD4+ T cell viability following HSV-2 infection as in B was determined by vital dye exclusion (n = 6 donors). (D) Anti-CD3/CD28–stimulated CD4+ T cells from n = 3 different donors were infected with the indicated isolates of HSV-2 at an MOI of 1 PFU/cell, and at 24 hpi, IL32 and CD69 gene expression was quantified by RT-qPCR. Results are presented as log10 fold change (FC) relative to mock-infected CD4+ T cells.
Figure 2
Figure 2. HSV-2–infected cells are preferentially CD45RO+ CD4+ T cells and express the transcription factors T-bet, RORγT, and Bcl6.
(A) CD4+ T cells from n = 5 healthy donor leukopaks were stimulated for 72 hours by CD3/CD28 cross-linking, infected with HSV-2(SD90) (MOI = 1 PFU/cell), and cultured for a further 24 hours, and then stained for glycoprotein B (gB) and for CD45RO. The percentage of gB+ cells in the total CD4+ T cell (CD45RO–/+) population, CD4+CD45RO population, and CD4+CD45RO+ population was quantified by flow cytometry. *P < 0.05, ***P < 0.001, ****P < 0.0001, 1-way ANOVA. (B) Representative flow cytometry plots of HSV-2 gB (y axis) and transcription factor (x axis) staining with electronic gates placed on CD4+ T cells. (C) Cells were infected as in A and stained for gB and for the indicated transcription factors (TFs). The percentages of gB+ (infected) and gB (bystander) cells expressing the indicated markers were compared by paired t test; *P < 0.05, **P < 0.01, ****P < 0.0001.
Figure 3
Figure 3. HSV-2 infection of T cells promotes HIV reactivation and replication.
(A and B) CD4+ T cells from HIV+ donors with plasma viral loads (PVLs) of 3,210 (donor 1, orange), 23,860 (donor 2, blue), and 44,700 (donor 3, green) copies/mL, respectively, were stimulated with PHA for 24 hours and then mock-infected or infected with HSV-2(SD90) (MOI = 1 PFU/cell) and, 48 hpi, were stained for HSV-2 gB and HIV-1 p24 (A). The mean fluorescence intensity (MFI) of p24 was determined; the bar represents the median (P = 0.056, paired t test, PHA + HSV-2 vs. PHA alone) (B). (C and D) 2D10 cells were exposed to live or UV-inactivated (UV) HSV-2(G) (C) or to strain G, 4674, SD90, or heat-inactivated (HI) G (D) (MOI = 1 PFU/cell). HIV ltr gene expression was measured by RT-qPCR relative to mock-infected samples 24 hpi (n = 3–6 each, ****P < 0.0001 comparing live vs. UV in C [t test] and each strain versus HI virus by 1-way ANOVA in D). (E) 2D10 cells were infected with HSV-2(G) at an MOI of 1 or 10 PFU/cell, and at 24 hpi, cells were fixed and stained with anti-gB antibody (red). Nuclei were stained with DAPI (blue), and HIV-reactivating cells were detected by eGFP (green). Representative images (original magnification, 63×1.4) from 2 independent experiments are shown. (F) 2D10 cells were infected with HSV-2(G) (MOI = 1 PFU/cell) for 8 hours and washed, and then fresh medium or medium supplemented with PHA (10 μg/mL) or TNF (10 ng/mL) was added. The cells were fixed and stained 24 hours after HSV-2 exposure. Representative images (original magnification, 63×1.4) from 2 independent experiments are shown. (G) The numbers of gB+ (red), eGFP+ (green), and gB+/eGFP+ (merge) cells and total cells (blue) were quantified in 5 randomly selected fields in E and F using Cell Counter ImageJ software (NIH); pie charts show relative proportions.
Figure 4
Figure 4. Transcriptional changes in HSV-2–infected CD4+ T cells.
CD4+ T cells isolated from leukopaks of 5 healthy donors were stimulated for 72 hours by CD3/CD28 cross-linking, infected with HSV-2(ZAG) at an MOI of 10 in biological duplicate, and sorted on GFP expression, and RNA was isolated for RNA-Seq. (A) Principal component analysis using the genes included in GO:0009615, 0019080, and 0019058. (B) Volcano plots comparing expression of a subset of genes identified in our bulk RNA-Seq data selected based on their known association with HIV reactivation and replication, comparing GFP+ versus mock (left) and GFP versus mock (right). Select genes of interest are demarcated in red. Dotted vertical lines indicate fold change greater than 2. All demarcated genes were significant (adjusted P < 0.05). A3G, APOBEC3G. (C) Normalized count data for selected genes related to HIV infection, latency reversal, or the interferon response. *P < 0.05, **P < 0.01, ***P < 0.001, ****P < 0.0001, Wald test via DESeq2.
Figure 5
Figure 5. Single-cell RNA-Seq identifies features of HSV-2–infected CD4+ T cells.
CD4+ T cells isolated from tonsil of an HIV donor were stimulated with anti-CD3/CD28 cross-linking and then infected with HSV-2(SD90) (MOI = 1) and subjected to single-cell RNA-Seq at 0 (mock), 6, and 24 hpi. (A) Scatterplots show normalized and denoised gene expression (see Methods) of cells within samples collected at different time points. Data points are colored based on upstream gating, where gray represents BCL6 cells and purple, green, and red represent BCL6+ cells from mock, 6 hpi, and 24 hpi, respectively. (B) Pseudotime line plots for all cells showing genes associated with infection (UL15) and Tfh phenotype (BCL6, ICOS, SELPLG, PDCD1, CXCR5). (C) Multiscale PHATE identifies 3 clusters of cells from all time points. Colors denote cluster identity, and the size of a dot in the embedding is proportional to the number of cells represented. Violin plots show expression of select genes organized by Multiscale PHATE cluster. Black horizontal lines represent cluster expression means, and individual points represent single cells. (D) Heatmaps represent expression of select genes involved in response to HSV-2 infection (left) and cell identity (right). Color scheme is based on z score distribution. (E) Mutual information (DREMI) quantified association between expression of UL15 and select genes MALAT1, APOBEC3G, EIF4A2, and DDX5 visualized with DREVI. (F) Histogram shows z score distribution of mutual information between individual genes and UL15 for all measured transcripts, calculated with DREMI. Dashed vertical lines show mean (black) and 95% confidence (red). HSV-2 infection–related genes with z scores above 95% confidence (*P ≥ 0.05) are colored in red.
Figure 6
Figure 6. scRNA-Seq reveals shared and divergent gene expression features of HSV-2–infected and bystander cells.
(A) Multiscale PHATE visualization of sample likelihood score calculated with MELD for each experimental time point. Purple, green, and red color schemes correspond to mock, 6 hpi, and 24 hpi, respectively, and the size of a dot is proportional to the number of cells represented. (B) Multiscale PHATE visualization of UL15 expression, where color intensity denotes gene expression. (C and D) Box plots showing relative gene expression of cells at 24 hpi within Multiscale PHATE clusters for genes involved in HIV reactivation (C) and general antiviral immune responses (D). Values represent normalized and denoised gene expression levels for individual cells relative to average expression in mock-infected cells (**P < 0.01, ***P < 0.001, Welch’s t test). At 24 hpi, cells in the early cluster are mock-like, cells in the mid cluster are defined as bystanders, and those in the late are productively HSV-2–infected.
Figure 7
Figure 7. HSV-2–induced reactivation is decreased in the absence of MALAT1.
(A) 2D10 cells were exposed to TNF (10 ng/mL), romidepsin (6.25 nM), or HSV-2(SD90) (MOI = 1 PFU/cell) or mock-treated, and MALAT1 expression was determined 24 hours after treatment. Results are expressed as log10 fold change (FC) relative to mock-treated cells (n = 3 independent experiments, **P < 0.01, ****P < 0.0001, compared with mock-treated cells by 1-way ANOVA). (B) 2D10 or ΔMALAT1 cells were exposed to HSV-2(SD90) (MOI = 1 PFU/cell) and HSV-2 ICP0 expression determined 24 hpi as log10 fold change relative to mock-infected cells. (C and D) 2D10 or ΔMALAT1 cells were infected with HSV-2(SD90) (MOI = 1 PFU/cell) (C) or treated with TNF or romidepsin (D), and HIV ltr expression was determined 24 hours after treatment. Results are presented as fold change in gene expression relative to mock-treated cells. ****P < 0.0001, unpaired t test comparing 2D10 vs. ΔMALAT1 cells. (E) 2D10 cells were infected with live or UV-inactivated HSV-2(G) (MOI = 1), treated with romidepsin (6.25 nM), or left untreated (UT), and after 24 hours of incubation, the cells were harvested, nuclei isolated, and HDAC activity measured using a colorimetric HDAC activity assay. (F) Primary CD4+ T cells were stimulated by CD3/CD28 cross-linking for 72 hours and infected with HSV-2(G) (MOI = 1), treated with romidepsin, or left untreated (UT). HDAC activity was assayed as in E. **P < 0.01, ****P < 0.0001 relative to untreated cells, 1-way ANOVA.
Figure 8
Figure 8. HSV-2 VP16 triggers HIV reactivation, upregulates MALAT1, and induces histone modifications.
(A) Jurkat 2D10 cells were transfected with the indicated plasmids and mCherry-positive cells isolated 42 hours later by FACS. RNA was extracted, and log10 fold change (FC) in HIV ltr expression was quantified relative to empty vector (EV) control by RT-qPCR. (B) 2D10 cells were transfected with the indicated plasmids and processed as in A, and the fold change in MALAT1 expression was quantified relative to EV control. (C) 2D10 or ΔMALAT1 cells were transfected with VP16 or EV plasmids or treated with TNF (10 ng/mL) for 24 hours and then fixed and stained with DAPI (nuclei blue). Representative images show nuclei (blue, top left), eGFP+ cells (green, top right), transfected cells (red, bottom left), and merged images (bottom right) (original magnification, 63×1.4). Percentage of eGFP+ cells (HIV-reactivated) was quantified in 5 randomly selected fields and is indicated below. (D and E) 2D10 cells were transfected with VP16 or EV plasmids and, 42 hours later, were sorted on mCherry by FACS and analyzed for protein expression (D), or nuclei were extracted and histones isolated for evaluation of histone modifications (E). HIV proteins are highlighted in green and members of the PRC2 complex in red (D). (F and G) 2D10 cells were infected with HSV-2(G) at an MOI of 10 PFU/cell or mock-infected. After 24 hours of incubation, nuclei were extracted and histones isolated and evaluated by mass spectrometry. The percentages of H4 with 2, 3, or 4 acetylations (F) and acetylation of histone H3 already modified with the silencing modification H3K9me3 (G) were quantified. *P < 0.05, **P < 0.01, 1-way ANOVA (A and B) or unpaired t test (EG).
Figure 9
Figure 9. HSV-2–associated transcriptional changes promote HIV infection, replication, and virion production.
Shown are selected transcriptional changes identified in bulk and/or single-cell RNA-Seq analyses and their effects on HIV infection, replication, or virion production. Relationships shown with an arrow promote the indicated process; relationships shown with a blunted arrow inhibit the indicated process. Genes whose expression was increased in HSV-2–infected cells are shown in blue; those whose expression was decreased are shown in purple.

Similar articles

Cited by

References

    1. Looker KJ, et al. Effect of HSV-2 infection on subsequent HIV acquisition: an updated systematic review and meta-analysis. Lancet Infect Dis. 2017;17(12):1303–1316. doi: 10.1016/S1473-3099(17)30405-X. - DOI - PMC - PubMed
    1. Mole L, et al. The impact of active herpes simplex virus infection on human immunodeficiency virus load. J Infect Dis. 1997;176(3):766–770. doi: 10.1086/517297. - DOI - PubMed
    1. Nagot N, et al. Reduction of HIV-1 RNA levels with therapy to suppress herpes simplex virus. N Engl J Med. 2007;356(8):790–799. doi: 10.1056/NEJMoa062607. - DOI - PubMed
    1. Stinn T, et al. Subclinical genital herpes shedding in HIV/herpes simplex virus 2-coinfected women during antiretroviral therapy is associated with an increase in HIV tissue reservoirs and potentially promotes HIV evolution. J Virol. 2020;95(1):e01606–20. - PMC - PubMed
    1. Zhu J, et al. Persistence of HIV-1 receptor-positive cells after HSV-2 reactivation is a potential mechanism for increased HIV-1 acquisition. Nat Med. 2009;15(8):886–892. doi: 10.1038/nm.2006. - DOI - PMC - PubMed

Publication types