. 2023 Jun 1;133(11):e159928.
doi: 10.1172/JCI159928.

Transcription factor HNF4α2 promotes osteogenesis and prevents bone abnormalities in mice with renal osteodystrophy

Affiliations

Transcription factor HNF4α2 promotes osteogenesis and prevents bone abnormalities in mice with renal osteodystrophy

Marta Martinez-Calle et al. J Clin Invest. .

Abstract

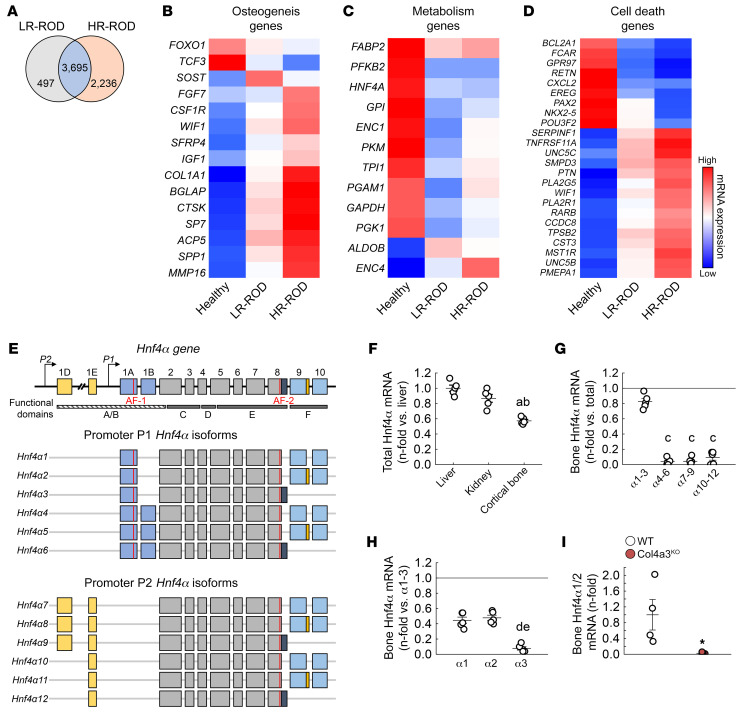
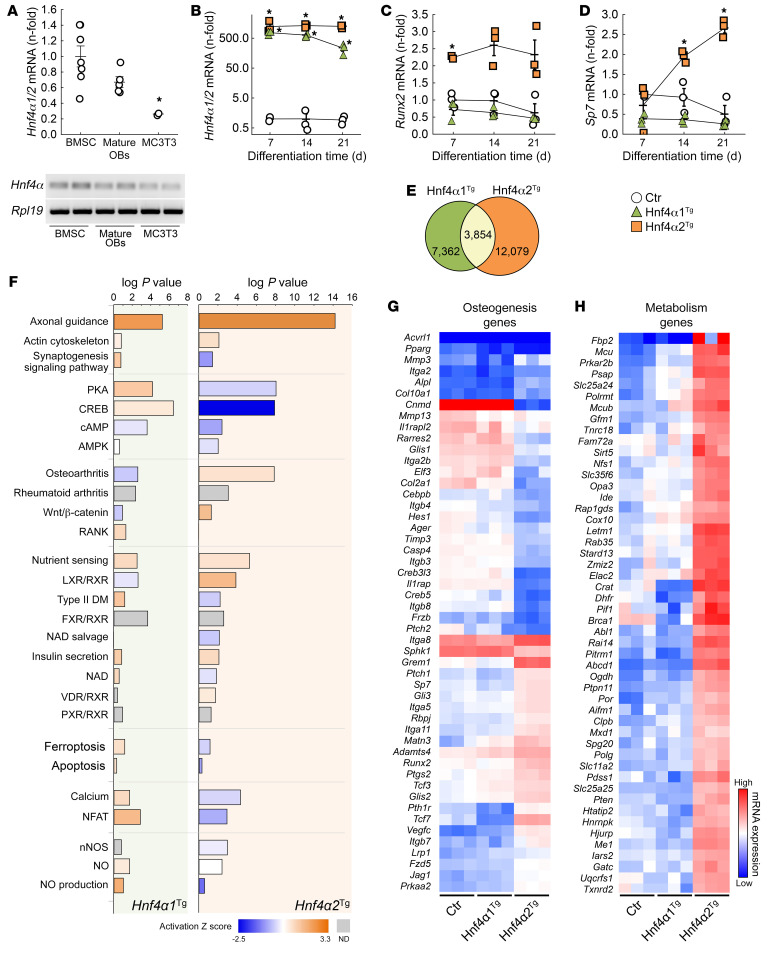
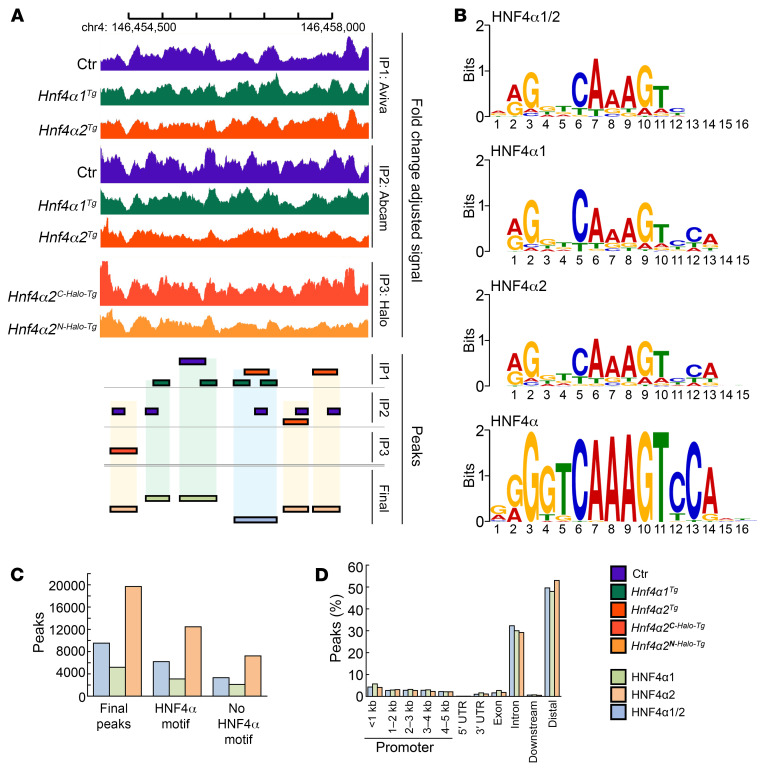
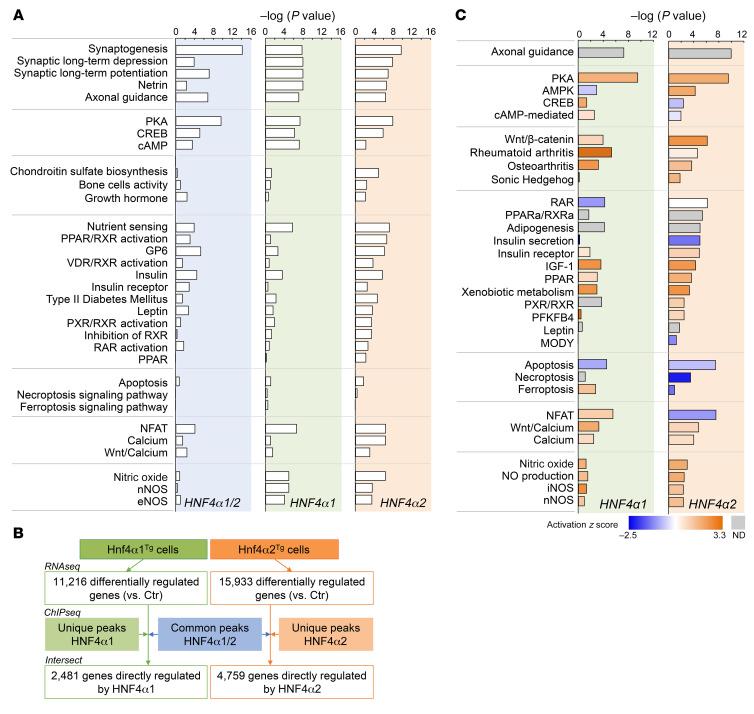
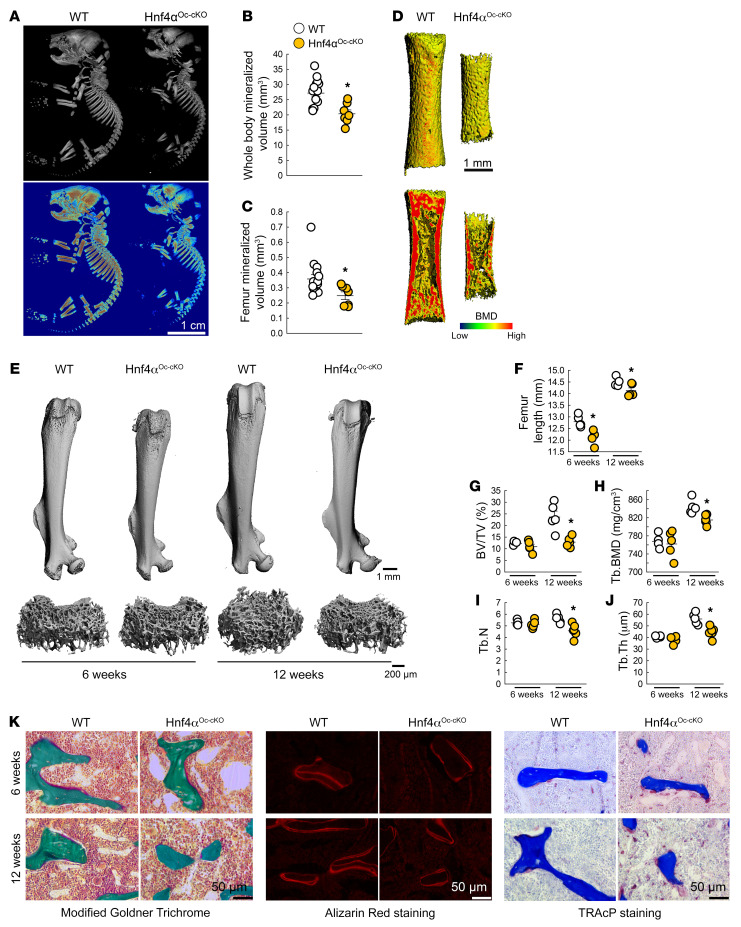
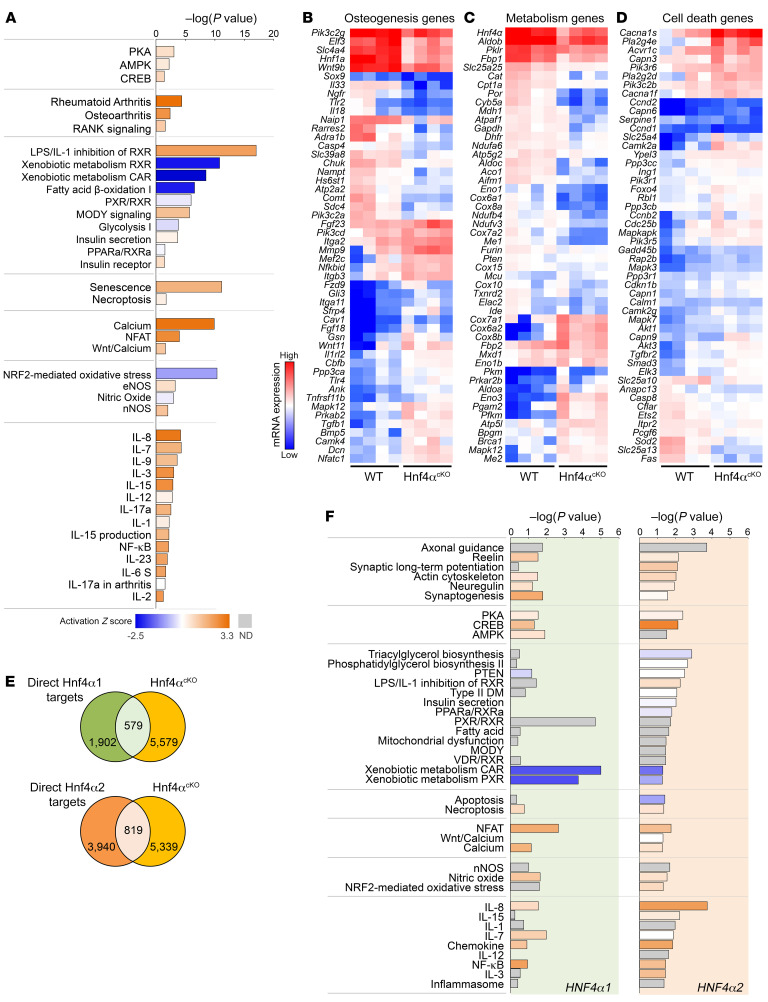
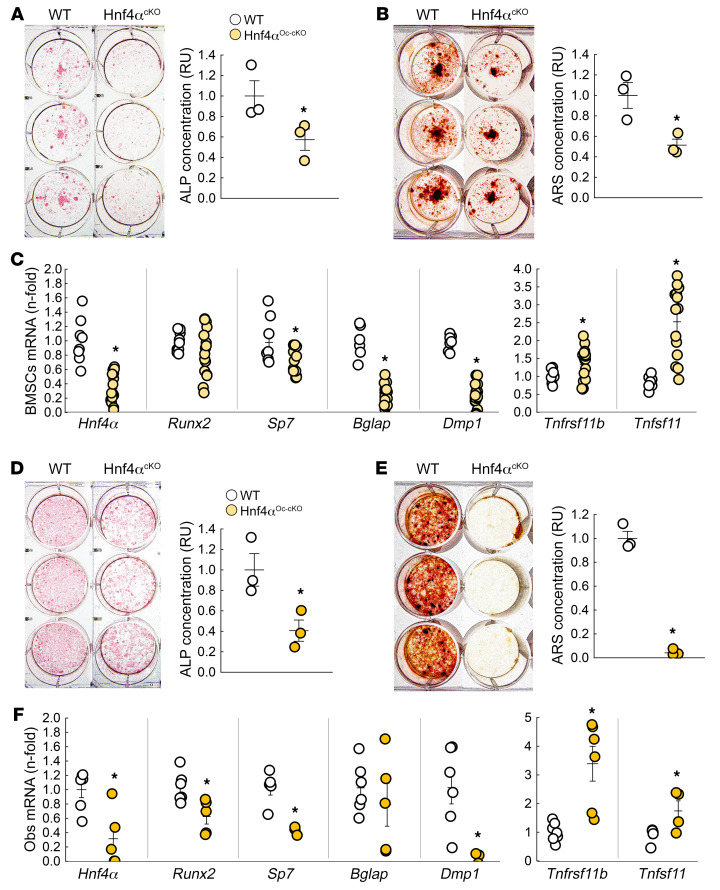
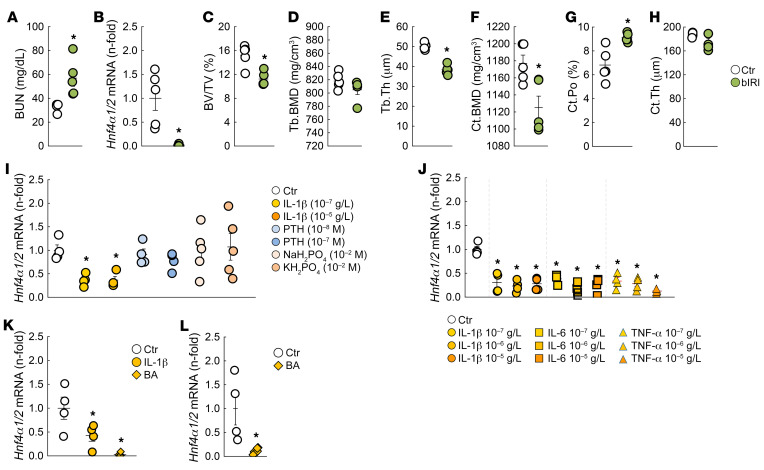
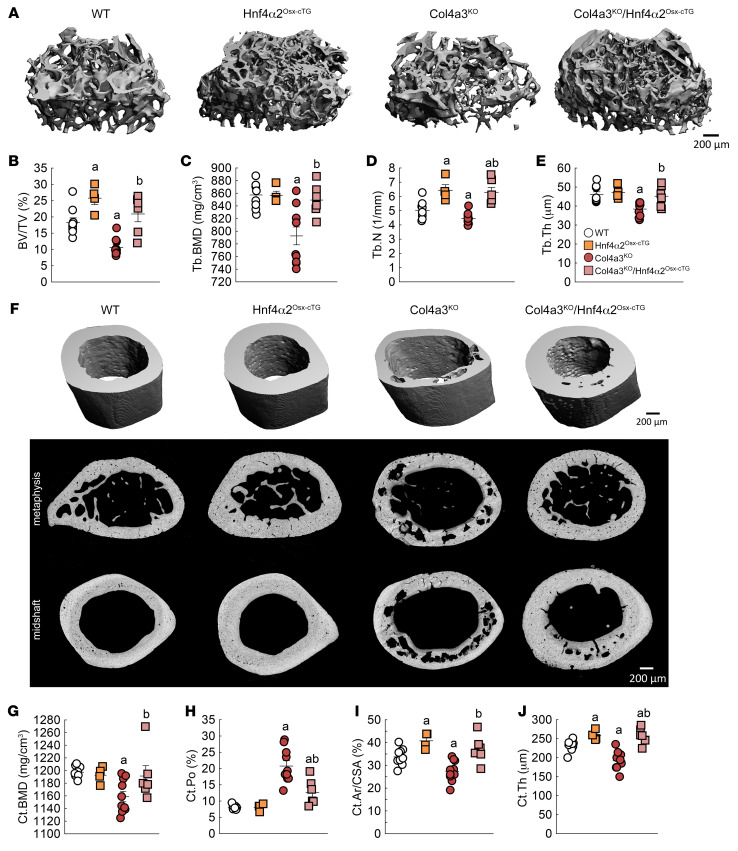
Renal osteodystrophy (ROD) is a disorder of bone metabolism that affects virtually all patients with chronic kidney disease (CKD) and is associated with adverse clinical outcomes including fractures, cardiovascular events, and death. In this study, we showed that hepatocyte nuclear factor 4α (HNF4α), a transcription factor mostly expressed in the liver, is also expressed in bone, and that osseous HNF4α expression was dramatically reduced in patients and mice with ROD. Osteoblast-specific deletion of Hnf4α resulted in impaired osteogenesis in cells and mice. Using multi-omics analyses of bones and cells lacking or overexpressing Hnf4α1 and Hnf4α2, we showed that HNF4α2 is the main osseous Hnf4α isoform that regulates osteogenesis, cell metabolism, and cell death. As a result, osteoblast-specific overexpression of Hnf4α2 prevented bone loss in mice with CKD. Our results showed that HNF4α2 is a transcriptional regulator of osteogenesis, implicated in the development of ROD.

Keywords: Bone Biology; Bone disease; Chronic kidney disease; Metabolism.


Conflict of interest statement

Conflict of interest: VD has received research funding from Akebia and from Vifor Pharma and consulting honoraria from Keryx Biopharmaceuticals, Vifor Pharma, Luitpold, and Amgen outside of the submitted work. TLN has had consultancy agreements with Pharmacosmos and has received research funding from Amgen and consulting honoraria from Amgen and Pharmacosmos outside of the submitted work. RMAM has received lecture honoraria from Amgen and Accord outside of the submitted work. IBS has received honoraria from Akebia, Inozyme, Ultragenyx, Amgen, and Abbvie outside of the submitted work.

Figures

Figure 1
Figure 1. HNF4A is expressed in bone and is reduced in humans and mice with CKD.
(A) Number of differentially regulated genes identified by RNA-Seq of bone biopsies from CKD patients with low–bone remodeling (LR) and high–bone remodeling (HR) renal osteodystrophy (ROD) versus healthy volunteers. (BD) Heatmap-represented expression of genes identified in the topmost differentially regulated pathways in LR-ROD and HR-ROD bone biopsies versus healthy volunteers. n = 9 (Healthy and LR-ROD) and 11 (HR-ROD); corrected P < 0.05. Statistical analysis was performed with an ANOVA test followed by unpaired Student’s t test and corrected by the FDR. (E) Schematic representation of Hnf4α gene and different promoter P1– and P2–driven Hnf4α isoforms. (FH) Comparative analysis of total Hnf4α mRNA in liver, kidney, and bone (F), Hnf4α isoforms 1 to 12 mRNA in bone (G), and Hnf4α isoforms 1 to 3 mRNA in bone of WT mice (H). (I) mRNA expression of Hnf4α1/2 in bone of WT and Col4a3KO mice with CKD. Values are expressed as the mean ± SEM. N = 5 per group. Corrected P < 0.05 versus aliver, bkidney, cHnf4α1–3, dHnf4α1, eHnf4α2, and *WT. Statistical analysis was performed with an unpaired Student’s t tests (I) or with an ANOVA followed by post hoc t tests to determine statistical differences and multiple-testing correction using the Holm-Bonferroni method (FH).
Figure 2
Figure 2. HNF4α2 is a major regulator of osteogenesis and metabolism in osteoblasts.
(A and B) Hnf4α1/2 mRNA expression in differentiated primary bone marrow stromal cells (BMSCs), mature osteoblasts (OBs), and MC3T3-E1 osteoblasts (A), and in MC3T3-E1 osteoblasts transfected with an empty vector (Ctr), Hnf4α1 (Hnf4α1Tg), and Hnf4α2 (Hnf4α2Tg) expression transgene (B). (C and D) mRNA expression of markers of osteoblast differentiation Runx2 and Sp7. Values are expressed as the mean ± SEM. n ≥ 3 per group of a representative experiment performed at least 3 times; corrected P < 0.05 versus *BMSC or Ctr. Statistical analysis was performed with an ANOVA test followed by post hoc t tests to determine statistical differences and multiple-testing correction using the Holm-Bonferroni method. (E) Number of differentially regulated genes identified by RNA-Seq in Hnf4α1Tg and Hnf4α2Tg osteoblasts versus Ctr. (F) Canonical pathway analysis and prediction of pathway activation of differentially regulated genes identified by RNA-Seq of Ctr, Hnf4α1Tg, and Hnf4α2Tg osteoblasts. (G and H) Heatmap-represented expression of genes modified and involved in osteogenesis and metabolism pathways in Ctr, Hnf4α1Tg, and Hnf4α2Tg osteoblasts. Corrected P < 0.05; n = 3 per group. Statistical analysis was performed with an unpaired Student’s t test and corrected by the FDR.
Figure 3
Figure 3. HNF4α-specific ChIP sequencing analysis of HNF4α targets in MC3T3-E1 osteoblasts.
(A) Representative illustration of final peak calls based on overlapping naive peaks found in MC3T3-E1 osteoblasts overexpressing an empty vector (Ctr), Hnf4α1 (Hnf4α1Tg), or Hnf4α2 (Hnf4α2Tg). (B) Enriched HNF4α motif sequences found in final peaks from position frequency matrices using MEME Suite (https://meme-suite.org/meme/tools/meme-chip) compared with the curated HNF4α consensus motif. (C and D) Number (C) and distribution across genomic regions (D) of HNF4α1, HNF4α2, or common HNF4α1/2 final peaks. n = 3 biological replicates per experimentally used antibody.
Figure 4
Figure 4. HNF4α2 is a direct transcriptional regulator of osteogenesis and metabolism in osteoblasts.
(A) Canonical pathway analysis of HNF4α targets identified by ChIP sequencing of Ctr, Hnf4α1Tg, and Hnf4α2Tg osteoblasts. n = 3 biological replicates per experimentally used antibody. (B) Number of genes differentially regulated in Hnf4α1Tg and Hnf4α2Tg osteoblasts versus Ctr and directly regulated by HNF4α, obtained from the intersection between genes identified by RNA-Seq in Figure 2 and genes identified by ChIP sequencing in Figure 3. (C) Canonical pathway analysis and prediction of pathway activation of direct HNF4α targets identified in A.
Figure 5
Figure 5. Bone-specific deletion of Hnf4α leads to low bone mass and impaired bone growth.
(AJ) 3D microtomography analysis of whole-body skeleton (A and B) and entire femur (C and D; bottom panel of D shows a longitudinal section) of WT and Hnf4αOc-cKO neonates, and of entire femur and femur metaphysis of young (6 weeks) and adult (12 weeks) WT and Hnf4αOc-cKO mice (EJ). BMD, bone mineral density; BV, bone volume; TV, total volume; Tb, trabecular; N, number; Th, thickness. (K) Microscopy analysis of modified Goldner Trichrome staining (left), alizarin red S staining (middle), and TRAcP staining (right) of femur trabecular bone from 6- and 12-week-old WT and Hnf4αOc-cKO mice. Values are expressed as the mean ± SEM. n ≥ 5 per group; P < 0.05 versus *age-matched WT. Statistical analysis was performed with unpaired Student’s t tests.
Figure 6
Figure 6. Low bone mass is associated with altered osteogenesis and impaired bone metabolism in Hnf4αOc-cKO mice.
(A) Canonical pathway analysis of differentially regulated genes identified by RNA-Seq of bone from 6-week-old Hnf4αOc-cKO mice versus WT. (BD) Heatmap-represented, log-normalized expression of genes identified in the topmost differentially regulated pathways in Hnf4αOc-cKO bone versus WT. (E) Number of genes differentially regulated in bone in Hnf4αOc-cKO versus WT identified by RNA-Seq and directly regulated by HNF4α1 or HNF4α2, obtained from the intersection with previously identified direct HNF4α targets in osteoblast ChIP sequencing in Figure 4B. (F) Canonical pathway analysis of direct HNF4α1 and HNF4α2 gene targets in bone identified in E. In A and F, prediction of pathway activation is indicated by z score on the heatmap. n = 4 per group; corrected P < 0.05 versus WT. Statistical analysis was performed with unpaired Student’s t tests and corrected by the FDR.
Figure 7
Figure 7. Osteoblast-specific deletion of Hnf4α alters osteoblast differentiation and function.
(AC) Alkaline phosphatase (ALP) (A) and alizarin red S (ARS) (B) staining and quantification and mRNA expression of Hnf4α and osteoblastic markers (C) in differentiated primary BMSC cultures isolated from 6-week-old WT and Hnf4αOc-cKO mice. (DF) ALP (D) and ARS (E) staining and quantification and mRNA expression of Hnf4α and osteoblastic markers (F) in differentiated primary mature osteoblast cultures isolated from 6-week-old WT and Hnf4αOc-cKO mice. Values are expressed as the mean ± SEM. n ≥ 3 per group of a representative experiment performed at least 3 times; P < 0.05 versus *WT. Statistical analysis was performed with an unpaired Student’s t test.
Figure 8
Figure 8. Bone Hnf4α expression is reduced in mice with CKD and in response to acute and chronic inflammation.
(A) Renal function in 20-week-old sham-operated and bilateral ischemia/reperfusion injury (bIRI) WT male mice assessed by measurements of blood urea nitrogen (BUN). (B) Bone Hnf4α expression levels in 20-week-old sham and bIRI male mice. (CH) Microtomography analysis of femur metaphysis secondary spongiosa (CE) and femur cortical bone at metaphysis (FH) in 20-week-old WT sham and bIRI mice. Ct, cortical; Po, porosity. Values are expressed as the mean ± SEM. n ≥ 4 per group; P < 0.05 versus *sham. (I and J) Hnf4α mRNA expression in a representative experiment performed at least 3 times in differentiated primary BMSC cultures isolated from WT mice treated for 6 hours with different concentrations of IL-1β, PTH, inorganic phosphate salts, IL-6, or TNF-α. (K and L) mRNA expression of bone Hnf4α in tibiae from WT mice injected with saline (Ctr), IL-1β, or heat-killed Brucella abortus (BA) 6 hours (K) or 14 days (L) after injection. Values are expressed as the mean ± SEM. n ≥ 4 per group; corrected P < 0.05 versus *Ctr. Statistical analysis was performed with an unpaired Student’s t test (AH and L) or with an ANOVA followed by post hoc t tests and multiple-testing correction using the Holm-Bonferroni method (IK).
Figure 9
Figure 9. Genetic overexpression of Hnf4α2 in osteoblasts prevents bone loss in mice with CKD.
Microtomography analysis of femur metaphysis secondary spongiosa (AE) and femur cortical bone at metaphysis (F, middle) and at midshaft (F, top and bottom, and GJ) in 20-week-old WT, Hnf4αOsx-cTG, Col4a3KO, and Col4a3KO/Hnf4αOsx-cTG mice. Ar, area; CSA, cross-sectional area. Values are expressed as the mean ± SEM. n ≥ 8 per group; P < 0.05 versus aWT, bCol4a3KO. Statistical analysis was performed with an ANOVA followed by post hoc t tests to determine statistical differences and multiple-testing correction using the Holm-Bonferroni method.

References

    1. Go AS, et al. Chronic kidney disease and the risks of death, cardiovascular events, and hospitalization. N Engl J Med. 2004;351(13):1296–1305. doi: 10.1056/NEJMoa041031. - DOI - PubMed
    1. Remuzzi G, et al. Mechanisms of progression and regression of renal lesions of chronic nephropathies and diabetes. J Clin Invest. 2006;116(2):288–296. doi: 10.1172/JCI27699. - DOI - PMC - PubMed
    1. Isakova T, et al. Fibroblast growth factor 23 is elevated before parathyroid hormone and phosphate in chronic kidney disease. Kidney Int. 2011;79(12):1370–1378. doi: 10.1038/ki.2011.47. - DOI - PMC - PubMed
    1. Stubbs JR, et al. Longitudinal evaluation of FGF23 changes and mineral metabolism abnormalities in a mouse model of chronic kidney disease. J Bone Miner Res. 2012;27(1):38–46. doi: 10.1002/jbmr.516. - DOI - PMC - PubMed
    1. Pereira RC, et al. Primary osteoblast-like cells from patients with end-stage kidney disease reflect gene expression, proliferation, and mineralization characteristics ex vivo. Kidney Int. 2015;87(3):593–601. doi: 10.1038/ki.2014.347. - DOI - PMC - PubMed

Publication types

MeSH terms

Substances