. 2023 Apr 20;21(4):e3002042.
doi: 10.1371/journal.pbio.3002042. eCollection 2023 Apr.

Breaking spore dormancy in budding yeast transforms the cytoplasm and the solubility of the proteome

Affiliations

Breaking spore dormancy in budding yeast transforms the cytoplasm and the solubility of the proteome

Samuel Plante et al. PLoS Biol. .

Abstract

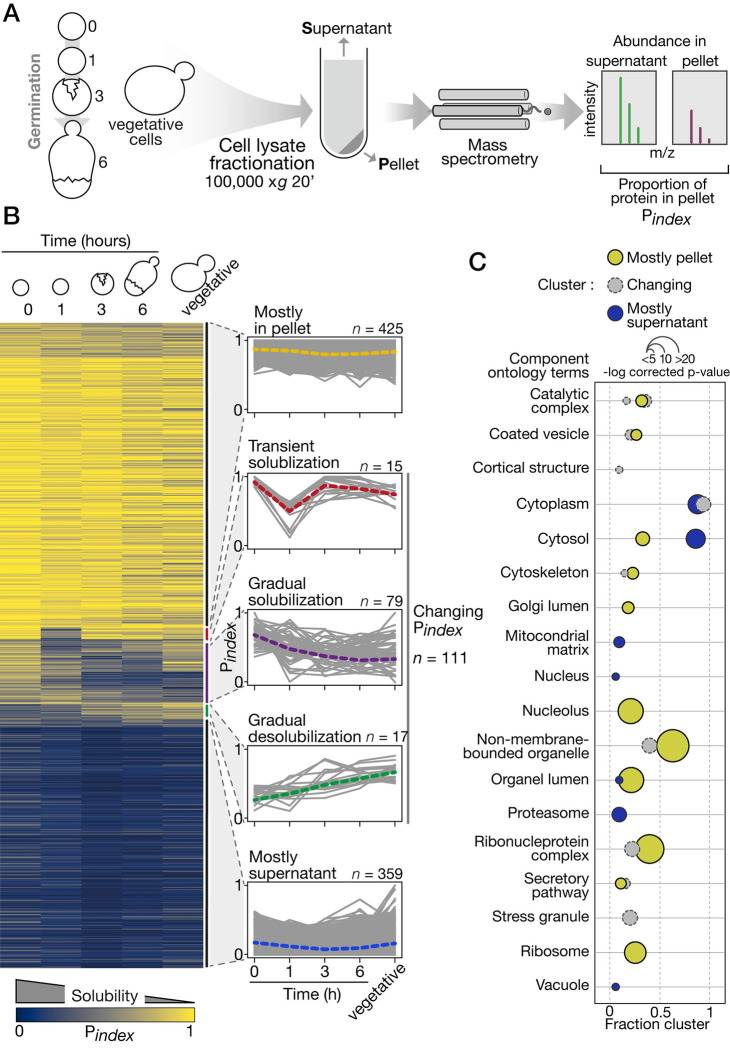
The biophysical properties of the cytoplasm are major determinants of key cellular processes and adaptation. Many yeasts produce dormant spores that can withstand extreme conditions. We show that spores of Saccharomyces cerevisiae exhibit extraordinary biophysical properties, including a highly viscous and acidic cytosol. These conditions alter the solubility of more than 100 proteins such as metabolic enzymes that become more soluble as spores transit to active cell proliferation upon nutrient repletion. A key regulator of this transition is the heat shock protein, Hsp42, which shows transient solubilization and phosphorylation, and is essential for the transformation of the cytoplasm during germination. Germinating spores therefore return to growth through the dissolution of protein assemblies, orchestrated in part by Hsp42 activity. The modulation of spores' molecular properties are likely key adaptive features of their exceptional survival capacities.


Conflict of interest statement

The authors have declared that no competing interests exist.

Figures

Fig 1
Fig 1. The cytoplasm of dormant spores displays high rigidity and density and is an acidic environment.
(A) Phase-contrast microscopic images of ascospore (same cell followed through time) at the indicated time after exposure to rich media, which activates germination. The scale bar represents 5 μm. (B) Optical density (A595) and (C) heat resistance of pure spore cultures through time after exposure to rich media. Heat resistance is the ratio of growth after a heat shock at 55°C for 10 min to growth without heat treatment. Experiments were performed in triplicate and values for individual replicates are shown. (D) Representative TEM images of spores at the indicated time after exposure to rich medium and of a vegetatively growing yeast cell (vegetative). Cells were prepared and stained at the same time. Imaging was performed on a single layer. The scale bar represents 1 μm. See S1A Fig for more examples. (E) Mean black level of spore cytosol at the indicated time after exposure to rich medium and of vegetative yeast. Spores at 0, 1-, and 2-h time points are merged into a single category since they are indistinguishable from one another. (F) Top, microscopic images of μNS-GFP particles in vegetative yeasts and spores. Underneath is the corresponding 1-min trajectories of the particles. Color indicates time scale. The scale bar represents 10 μm. Bottom, ensemble MSD of μNS-GFP particles in spores at the indicated time after exposure to rich medium and in vegetative cells. (G) Intracellular pH measured at the indicated time point after germination induction and in exponentially growing cells. Measurements in at least 2,000 cells are shown at each time point. The data underlying this figure can be found in S1 Datasheet. MSD, mean squared displacement; TEM, transmission electron microscopy.
Fig 2
Fig 2. Proteome-wide change in protein solubility during germination.
(A) Solubility measurement by LC-MS/MS estimates the proportion of each protein in the pellet (Pindex) at each major time point sampled during germination. The experiment was performed in triplicate for all time points. (B) Right, Pindex values in the course of germination show, from top to bottom, proteins consistently found in the pellet, that transiently solubilize, that gradually solubilize, that gradually accumulate in the pellet, and that are consistently found in the supernatant. Left, individual Pindex trajectories for each cluster determined by hierarchical clustering. The dotted line is the median trajectory for each cluster. (C) GO term analysis focused on cellular component terms. Terms enriched for each cluster (Mostly in pellet, Changing Pindex, and Mostly supernatant) are shown as bubble plots. Colors refer to the cluster, position on the x-axis indicates the portion of the proteins in a cluster assigned to a GO term, and size of the bubble is scaled to the -log (p-values). See S2 Fig for additional details. The data underlying this figure can be found in S2 Datasheet. GO, gene ontology; LC-MS/MS, liquid-chromatography-coupled tandem mass spectrometry.
Fig 3
Fig 3. Solubility changes reflect metabolism activation and mimic stress relief during germination.
(A) Enrichment for GO terms in each dynamically changing solubility cluster. Red, transiently solubilizing cluster; green, gradual desolubilization cluster; purple, gradual solubilization cluster. The position on the x-axis indicates the portion of the proteins in a cluster assigned to a GO term, and size of the bubble is scaled to the -log (p-values) from a hypergeometric test. (B) Individual Pindex trajectories for representative proteins through germination. Proteins are clustered by function; red, stress response proteins; blue, nitrogen metabolism proteins; gray, lipid and carbon metabolism proteins. Error bars represent standard deviation of 3 replicates. (C) Representative fluorescence microscopic images of spores expressing the indicated proteins tagged with GFP during germination. Top to bottom, Acetyl-CoA carboxylase Acc1 (lipid biosynthesis), CTP synthase Ura7 (pyrimidines synthesis), and Glucokinase Glk1 (glycolysis). The Glk1 foci formation and the dissolution of Acc1 and Ura7 foci in course of germination support that dormancy in spores is analogous to a stress state and germination alleviates this state. Dotted lines indicate cell contour determined by brightfield images. Scale bars represent 5 μm. (D) Measure of cellular heterogeneity (coefficient of variation) of the fluorescent proteins in spore at the indicated time after exposure to rich medium or in vegetative cells. Between 20 and 41 cells were analyzed at each time points. (E) Schematics highlighting effects on protein solubility of nutrient starvation and repletion during sporulation and germination, respectively. Pink and blue assemblies represent assemblies of enzymes needed for growth and metabolism during dormancy, which disassemble (pink and blue circles) during germination. The data underlying this figure can be found in S3 Datasheet. GO, gene ontology.
Fig 4
Fig 4. Hsp42 phosphorylation at S223 is synchronized with its transient solubilization.
(A) Relative abundance of the 36 phosphoproteins to the total abundance of each protein through germination. (B) Hsp42 is phosphorylated during germination and changes solubility. See S3 Fig for additional information. (C) Hsp42 is the only protein with dynamic solubility profile during germination that correlates with its dynamic phosphorylation, here at S223. Error bars represent standard deviation of 3 replicates. (D) Representative fluorescence microscopic images of spores expressing Hsp42-GFP at the indicated time after the induction of germination. Dotted lines represent cell contour. The scale bar represents 5 μm. Plot shows the cellular Hsp42-GFP heterogeneity score in spore at the indicated time after exposure to rich medium or in vegetative cells. (E) Left, disorder profile of Hsp42, predicted by Metapredict, shows the predicted structured ACD domain, and flanking disordered N- and C-terminal region. Right, predicted Hsp42 structure. The S223 highlighted in orange is located in a disordered region. The data underlying this figure can be found in S4 Datasheet. ACD, alpha-crystallin domain.
Fig 5
Fig 5. Active and phosphorylated Hsp42 is required for normal germination dynamics.
(A) Optical density of pure spore cultures of the indicated strains as a function of time following exposure to germination conditions. Shown are the mean values of 3 replicates. OD drop of the hsp42Δ spores is strongly delayed, indicating that germination is inhibited or slowed down. Spores expressing S223A Hsp42 mutant show a slight delay in germination, while germination of spores expressing S223E Hsp42 mutant is indistinguishable from that of WT spores. (B) Ensemble mean square displacement of μNS-GFP in WT and hsp42Δ spores at the indicated time after exposure to rich medium. At each time point for each strain, 25 to 35 particles, corresponding to the same number of cells, were tracked. Kruskal–Wallis test, ** indicates p-value < 0.0001, * indicates p-value < 0.01. (C) Fluorescence microscopy images of wild type (top) or hsp42Δ spores expressing Acc1-mCherry at the indicated time after exposure to germination conditions. Scale bar represents 5 μm. (D) Cellular Acc1-mCherry heterogeneity score in WT or hsp42Δ spores at the indicated time after exposure to rich medium. (E) Trehalose content (measured in equivalent of glucose concentration) in spores at the indicated time after exposure to rich medium, and in vegetative yeasts. Error bars represent standard deviation of 3 replicates. (F) Fluorescence microscopy images of spores expressing either WT, S223A, or S223E mutant Hsp42-GFP and Acc1-mCherry at the indicated time after exposure to germination conditions. Dotted lines represent cell contour. Scale bar represents 5 μm. Expression of S223A Hsp42-GFP mutant shows delay in Acc1 foci dissolution in spores. (G) Fluorescence heterogeneity score of spores expressing either WT, S223A or S223E mutant Hsp42-GFP and Acc1-mCherry at the indicated time after exposure to rich medium. Left, heterogeneity of GFP fluorescence. Right, heterogeneity of mCherry fluorescence. Kruskal–Wallis test compared to WT Hsp42-GFP, ** indicates p-value < 0.0001, * indicates p- value < 0.01. The data underlying this figure can be found in S5 Datasheet.

Comment in

References

    1. Gremer JR, Sala A. It is risky out there: the costs of emergence and the benefits of prolonged dormancy. Oecologia. 2013;172:937–947. doi: 10.1007/s00442-012-2557-8 - DOI - PubMed
    1. Miller AK, Brown JS, Enderling H, Basanta D, Whelan CJ. The Evolutionary Ecology of Dormancy in Nature and in Cancer. Front Ecol Evol. 2021:9. doi: 10.3389/fevo.2021.676802 - DOI
    1. Guidetti R, Altiero T, Rebecchi L. On dormancy strategies in tardigrades. J Insect Physiol. 2011;57:567–576. doi: 10.1016/j.jinsphys.2011.03.003 - DOI - PubMed
    1. García-Roger EM, Lubzens E, Fontaneto D, Serra M. Facing Adversity: Dormant Embryos in Rotifers. Biol Bull. 2019;237:119–144. doi: 10.1086/705701 - DOI - PubMed
    1. Vlaar LE, Bertran A, Rahimi M, Dong L, Kammenga JE, Helder J, et al.. On the role of dauer in the adaptation of nematodes to a parasitic lifestyle. Parasit Vectors. 2021;14:554. doi: 10.1186/s13071-021-04953-6 - DOI - PMC - PubMed

Publication types

MeSH terms