. 2023 Apr 20;18(4):e0284735.
doi: 10.1371/journal.pone.0284735. eCollection 2023.

A novel task to investigate vibrotactile detection in mice

Affiliations

A novel task to investigate vibrotactile detection in mice

Mariel Muller et al. PLoS One. .

Abstract

Throughout the last decades, understanding the neural mechanisms of sensory processing has been a key objective for neuroscientists. Many studies focused on uncovering the microcircuit-level architecture of somatosensation using the rodent whisker system as a model. Although these studies have significantly advanced our understanding of tactile processing, the question remains to what extent the whisker system can provide results translatable to the human somatosensory system. To address this, we developed a restrained vibrotactile detection task involving the limb system in mice. A vibrotactile stimulus was delivered to the hindlimb of head-fixed mice, who were trained to perform a Go/No-go detection task. Mice were able to learn this task with satisfactory performance and with reasonably short training times. In addition, the task we developed is versatile, as it can be combined with diverse neuroscience methods. Thus, this study introduces a novel task to study the neuron-level mechanisms of tactile processing in a system other than the more commonly studied whisker system.


Conflict of interest statement

The authors have declared that no competing interests exist.

Figures

Fig 1
Fig 1. Vibro-tactile behavioural task.
(A) Schematic representation of the behavioural set-up. The mouse enters the PVC tube, it is fixed to the head-fixation supports, and its hindlimb is surrounded with a plastic cable (orange) which delivers a vibrotactile stimulus from an attached vibratory motor. A second motor, not attached to a limb, is used to deliver a control vibration during probe trials and verify that mice do not respond to the sound produced by vibratory motors. A lick spout delivers a reward if a lick is detected by an infrared (IR) lick detector following the delivery of tactile stimuli. Reprinted from Biorender under a CC BY license, with permission from Biorender, original copyright 2023. See also S1A Fig for a photo of the setup. (B) Lick response raster plot from one session recorded during the Final Stage. Blue dots correspond to individual licks. The brown bar between 0 and 0.1 s indicates a no reward window. Licks detected in this window are not rewarded, accounting for physiological reactions time. Dark vertical lines at 0 and 1 second indicate the response window. Note that the lick distribution is time-locked to stimulus presentation, indicating that the mouse responded to tactile stimuli. (C) Outline of the Go and No-Go trials (Final Stage). Black circles and waves represent the vibratory motors and their stimuli. Stimulus time goes on from 0 to 1 second and ITI lasts from 3 to 15 seconds, randomly. A reward is only delivered upon licking during Go trials. Panel A was created with BioRender.com. Vib.: vibratory; ITI: intertrial interval.
Fig 2
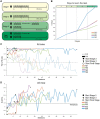
Fig 2. Training stages and mice performance.
(A) Schematic representation of the training Stages. From top to bottom: Stages 1, 2, 3 and Final Stage (each characterized by a different colour, from yellow to dark green). The black circle and waves represent the vibratory motors and their stimuli. Stimulus time and ITIs are longer in the beginning and are reduced across stages. Control vibrations are introduced in Stage 3 and in the Final Stage. (B) Average Stage progression (measured in days) for all mice. The y axis shows the number of days. Coloured bars on the top indicate the corresponding training stage. Orange, Green, Violet and Blue lines are the learning progression curve of each mouse (M1-4). Values for M1 overlap with those of M3, thus its curve is hardly visible in the graph. (C) Time course of Hit and FA rates (solid and dashed lines, respectively) across Stage 2 and 3 all four mice (same colour coding as in panel B). The grey line at 50% defines the chance response level. This figure shows how FAs are decreasing across sessions, gradually, from 90% in the first session of Stage 2, to less than 25% at the end of Stage 3. Moreover, more than 85% of responses are Hit responses, a value that stays stable across sessions. (D) D-prime values across Stages 2 and 3 for all four mice (same colour coding as in panel B). There was a consistent increment in performance along Stage 2 and 3. The horizontal line indicates the D-prime of 1.5 that is commonly considered to be satisfactory performance. Note that both D-prime and FA rate were used to determine the transition from Stage 3 to the Final stage. ITI: intertrial interval; FA: false alarm.
Fig 3
Fig 3. Licking behaviour.
(A) Licking activity during one example session from M3 in the Final Stage (blue dot: individual lick). From left to right, each lick raster plot corresponds to increasing tactile intensities from probe trials to low, medium, and high intensity tactile trials. The vertical lines indicate the start and end of sensory stimuli. (B) Same as panel A, but for lick peristimulus time histograms (time bin: 80 ms).
Fig 4
Fig 4. Behavioural performance.
(A) D-prime values for each of the tactile intensities (Low, Medium, High). Orange, Green, Violet, and Blue dots correspond to each mouse (M1-4). ***Significant difference between low and medium tactile intensity (one-way ANOVA, F (2,72) = [105.1], P = 4.44 x 10⁻²², Bonferroni post hoc test, P = 4.7 x 10⁻¹⁴) as well as between low and high intensity (one-way ANOVA, F (2,72) = [105.1], P = 4.44 x 10⁻²², Bonferroni post hoc test, P = 4.23 x 10⁻²²). (B) FA rates across all sessions in the Final Stage. (C) Psychometric curves of all mice. Coloured dashed lines are individual sessions belonging to each mouse (M1-4). The solid black line is the average from all sessions. The dashed black line corresponds to the example session shown in Fig 3A and 3B. (D-G) Threshold, sensitivity, lapse rate and guess rate computed from the psychometric curves. NS.: Statistical significance was not found between mice for any of these five features (one-way ANOVA).
Fig 5
Fig 5. Lick quantification.
(A-B) Lick rate (A) and latency (B) from all sessions across conditions. Significant differences between lick rates were found between the null condition and all other tactile intensities (***One-way ANOVA, F (3, 96) = [171.4], P = 2.04 x 10−38, Bonferroni post hoc test: probe vs. low intensity, P = 1.09 x 10⁻⁵; probe vs. medium intensity: P = 4.35 x 10⁻²⁷, probe vs. high intensity, P = 1.81 x 10⁻³⁵). The average latencies were significantly different between probe trials and the strongest intensity (***One-way ANOVA, F (3,96) = [13.55], P < 1.92 x 10⁻⁷, Bonferroni post hoc test, P = 0.0019). In all panels: Box plots show the median value with a red horizontal line; horizontal black lines indicate the 75 and 25 quartiles.

Similar articles

References

    1. de Lafuente V, Romo R. Neuronal correlates of subjective sensory experience. Nat Neurosci. 2005;8: 1698–1703. doi: 10.1038/nn1587 - DOI - PubMed
    1. Romo R, de Lafuente V. Conversion of sensory signals into perceptual decisions. Progress in Neurobiology. 2013;103: 41–75. doi: 10.1016/j.pneurobio.2012.03.007 - DOI - PubMed
    1. Margolis DJ, Lütcke H, Helmchen F. Microcircuit dynamics of map plasticity in barrel cortex. Current Opinion in Neurobiology. 2014;24: 76–81. doi: 10.1016/j.conb.2013.08.019 - DOI - PubMed
    1. Abraira VE, Ginty DD. The Sensory Neurons of Touch. Neuron. 2013;79: doi: 10.1016/j.neuron.2013.07.051 - DOI - PMC - PubMed
    1. Crochet S, Lee S-H, Petersen CCH. Neural Circuits for Goal-Directed Sensorimotor Transformations. Trends in Neurosciences. 2019;42: 66–77. doi: 10.1016/j.tins.2018.08.011 - DOI - PubMed

Publication types