. 2023 Apr 20;18(4):e0284420.
doi: 10.1371/journal.pone.0284420. eCollection 2023.

Ageing, functioning patterns and their environmental determinants in the spinal cord injury (SCI) population: A comparative analysis across eleven European countries implementing the International Spinal Cord Injury Community Survey

Affiliations

Ageing, functioning patterns and their environmental determinants in the spinal cord injury (SCI) population: A comparative analysis across eleven European countries implementing the International Spinal Cord Injury Community Survey

Carla Sabariego et al. PLoS One. .

Abstract

Background: As the European population with Spinal Cord Injury (SCI) is expected to become older, a better understanding of ageing with SCI using functioning, the health indicator used to model healthy ageing trajectories, is needed. We aimed to describe patterns of functioning in SCI by chronological age, age at injury and time since injury across eleven European countries using a common functioning metric, and to identify country-specific environmental determinants of functioning.

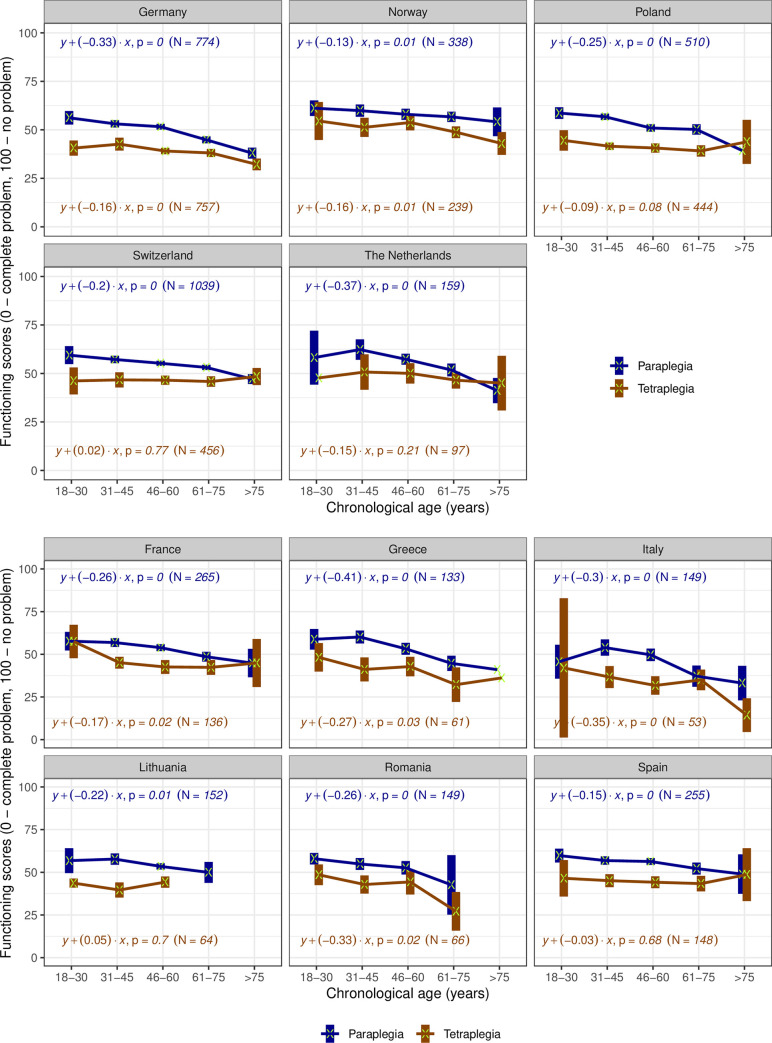
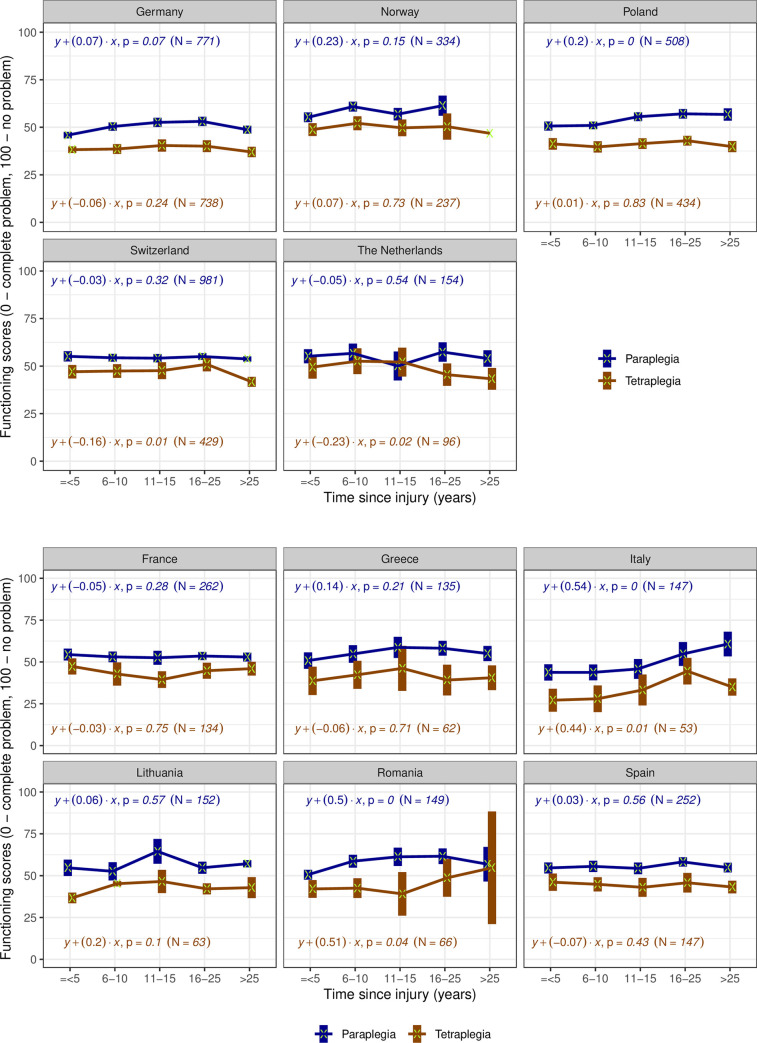
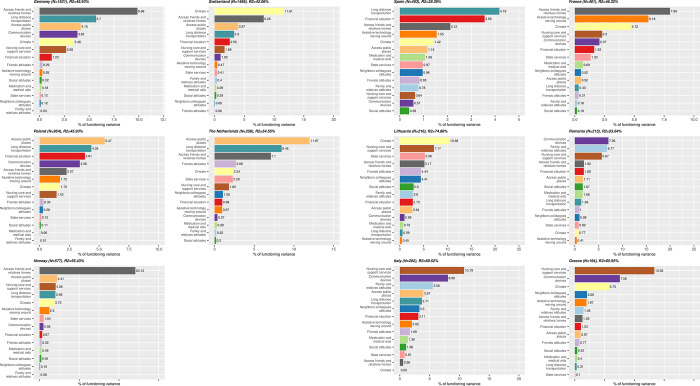
Methods: Data from 6'635 participants of the International Spinal Cord Injury Community Survey was used. The hierarchical version of Generalized Partial Credit Model, casted in a Bayesian framework, was used to create a common functioning metric and overall scores. For each country, linear regression was used to investigate associations between functioning, chronological age, age at SCI or time since injury for persons with para- and tetraplegia. Multiple linear regression and the proportional marginal variance decomposition technique were used to identify environmental determinants.

Results: In countries with representative samples older chronological age was consistently associated with a decline in functioning for paraplegia but not for tetraplegia. Age at injury and functioning level were associated, but patterns differed across countries. An association between time since injury and functioning was not observed in most countries, neither for paraplegia nor for tetraplegia. Problems with the accessibility of homes of friends and relatives, access to public places and long-distance transportation were consistently key determinants of functioning.

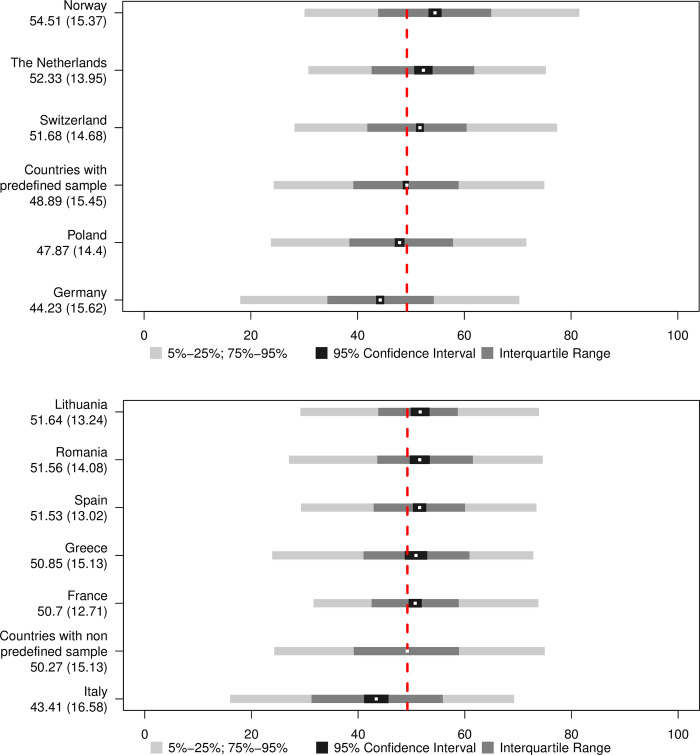
Conclusions: Functioning is a key health indicator and the fundament of ageing research. Enhancing methods traditionally used to develop metrics with Bayesian approach, we were able to create a common metric of functioning with cardinal properties and to estimate overall scores comparable across countries. Focusing on functioning, our study complements epidemiological evidence on SCI-specific mortality and morbidity in Europe and identify initial targets for evidence-informed policy-making.


Conflict of interest statement

The authors have declared that no competing interests exist.

Figures

Fig 1
Fig 1
a. Distributions of overall functioning scores by country with a pre-defined sampling frame strategy and representative samples. The red dashed line cuts across the mean of the displayed countries. Mean and the standard deviation are displayed below the country name. The mean is also displayed in the graph by the white dots. b. Distributions of overall functioning scores by countries with convenience samples. The red dashed line cuts across the mean of the displayed countries Mean and the standard deviation are displayed below the country name. The mean is also displayed in the graph by the white dots.
Fig 2
Fig 2
a. Trends of functioning scores by chronological age groups and type of injury in countries with representative samples. For each group, the mean (marked with a green x) and its 95% Confidence Interval (the box around the mean) of functioning scores are displayed. The coefficient of the regression with functioning score as outcome (y) and continuous chronological age variable as predictor (x), their correspondent p-value and used number of cases are displayed for each country and lesion level (tetraplegia in blue versus paraplegia in brown). The groups where only mean is displayed have a sample of one person. b. Trends of functioning scores by chronological age groups and type of injury in countries with convenience samples. For each group, the mean (marked with a green x) and its 95% Confidence Interval (the box around the mean) of functioning scores are displayed. The coefficient of the regression with functioning score as outcome (y) and continuous chronological age variable as predictor (x), their correspondent p-value and used number of cases are displayed for each country and lesion level (tetraplegia in blue versus paraplegia in brown). The groups where only mean is displayed have a sample of 1 person.
Fig 3
Fig 3
a. Trends of functioning scores by age at SCI groups and type of injury in countries with representative samples. For each group, the mean (marked with a green x) and its 95% Confidence Interval (the box around the mean) of functioning scores are displayed. The coefficient of the regression with functioning score as outcome (y) and continuous chronological age variable as predictor (x), their correspondent p-value and used number of cases are displayed for each country and lesion level (tetraplegia in blue versus paraplegia in brown). The groups where only mean is displayed have a sample of 1 person. b. Trends of functioning scores by age at SCI groups and type of injury in countries with convenience samples. For each group, the mean (marked with a green x) and its 95% Confidence Interval (the box around the mean) of functioning scores are displayed. The coefficient of the regression with functioning score as outcome (y) and continuous chronological age variable as predictor (x), their correspondent p-value and used number of cases are displayed for each country and lesion level (tetraplegia in blue versus paraplegia in brown). The groups where only mean is displayed have a sample of 1 person.
Fig 4
Fig 4
a. Trends of functioning scores by type since injury groups and type of injury in countries with representative samples. For each group, the mean (marked with a green x) and its 95% Confidence Interval (the box around the mean) of functioning scores are displayed. The coefficient of the regression with functioning score as outcome (y) and continuous chronological age variable as predictor (x), their correspondent p-value and used number of cases are displayed for each country and lesion level (tetraplegia in blue versus paraplegia in brown). The groups where only mean is displayed have a sample of 1 person. b. Trends of functioning scores by time since injury groups and type of injury in countries with convenience samples. For each group, the mean (marked with a green x) and its 95% Confidence Interval (the box around the mean) of functioning scores are displayed. The coefficient of the regression with functioning score as outcome (y) and continuous chronological age variable as predictor (x), their correspondent p-value and used number of cases are displayed for each country and lesion level (tetraplegia in blue versus paraplegia in brown).
Fig 5
Fig 5
a. Relative importance of each environmental factors in explaining the total variation of functioning scores in countries with representative samples, when controlling for chronological age and type of injury. For each country, the full model variation when considering EFs and chronological age and type since injury as predictors is indicated in each country figure’s title. b. Relative importance of each environmental factors in explaining the total variation of functioning scores countries with convenience samples, when controlling for chronological age and type of injury. For each country, the full model variation when considering EFs and chronological age and type since injury as predictors is indicated in each country figure’s title.

References

    1. Kirshblum SC, Burns SP, Biering-Sorensen F, Donovan W, Graves DE, Jha A, et al.. International standards for neurological classification of spinal cord injury [revised 2011]. J Spinal Cord Med. 2011;34[6]:535–46. - PMC - PubMed
    1. Grassner L, Marschallinger J, Dunser MW, Novak HF, Zerbs A, Aigner L, et al.. Nontraumatic spinal cord injury at the neurological intensive care unit: spectrum, causes of admission and predictors of mortality. Ther Adv Neurol Disord. 2016;9[2]:85–94. doi: 10.1177/1756285615621687 - DOI - PMC - PubMed
    1. Collaborators GBDN. Global, regional, and national burden of neurological disorders, 1990–2016: a systematic analysis for the Global Burden of Disease Study 2016. Lancet Neurol. 2019;18[5]:459–80. doi: 10.1016/S1474-4422(18)30499-X - DOI - PMC - PubMed
    1. Almada M, Brochado P, Portela D, Midao L, Costa E. Prevalence of Falls and Associated Factors among Community-Dwelling Older Adults: A Cross-Sectional Study. J Frailty Aging. 2021;10[1]:10–6. doi: 10.14283/jfa.2020.44 - DOI - PubMed
    1. Bickenbach JE, Biering-Sorensen F, Knott J, Shakespeare T, Stucki G, Tharion G. Understanding spinal cord injury. International perspectives on spinal cord injury. Geneva: WHO; 2013. p. 3–10.

LinkOut - more resources