. 2023 Apr 21;380(6642):eabj5559.
doi: 10.1126/science.abj5559. Epub 2023 Apr 21.

Induction of lysosomal and mitochondrial biogenesis by AMPK phosphorylation of FNIP1

Affiliations

Induction of lysosomal and mitochondrial biogenesis by AMPK phosphorylation of FNIP1

Nazma Malik et al. Science. .

Abstract

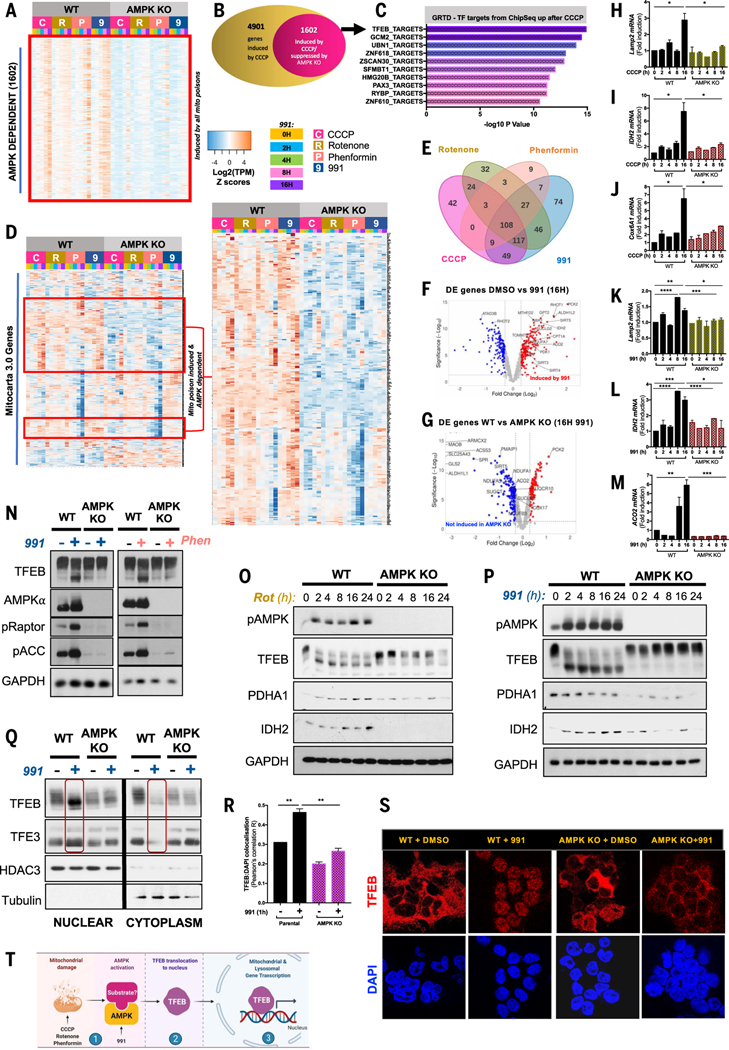
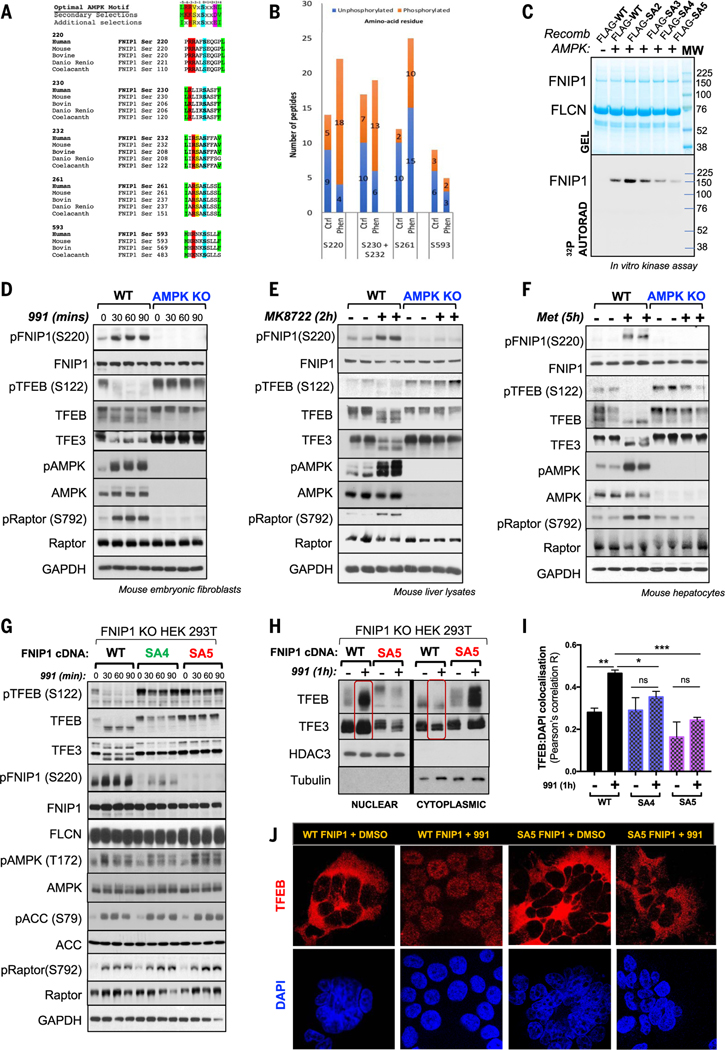
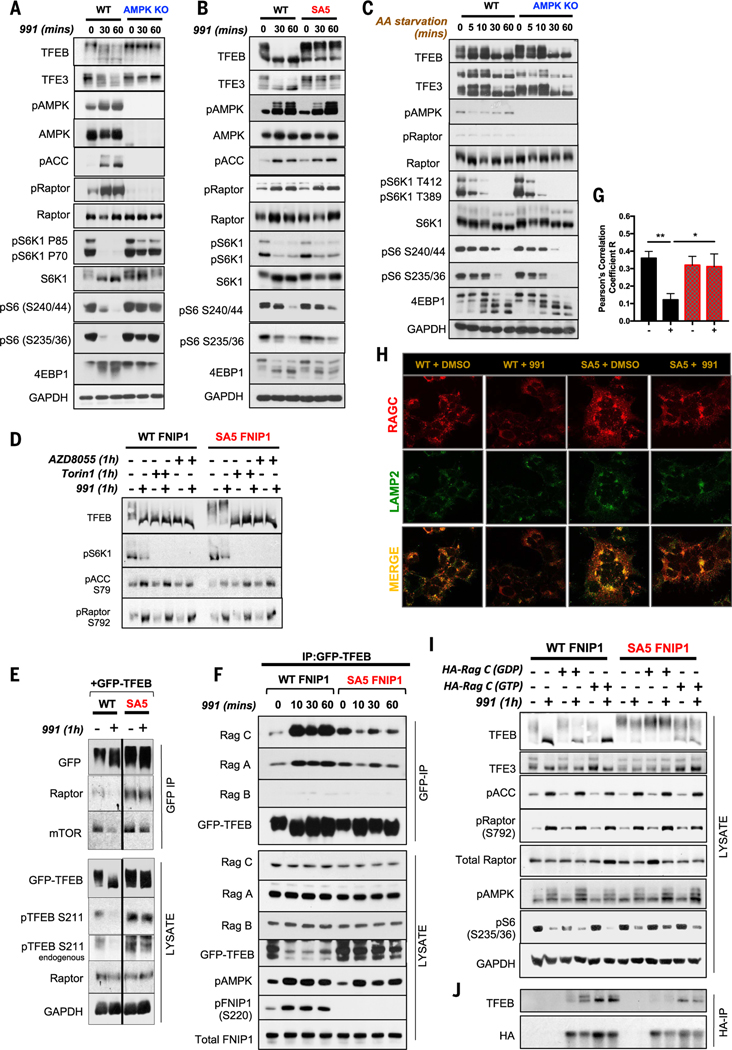
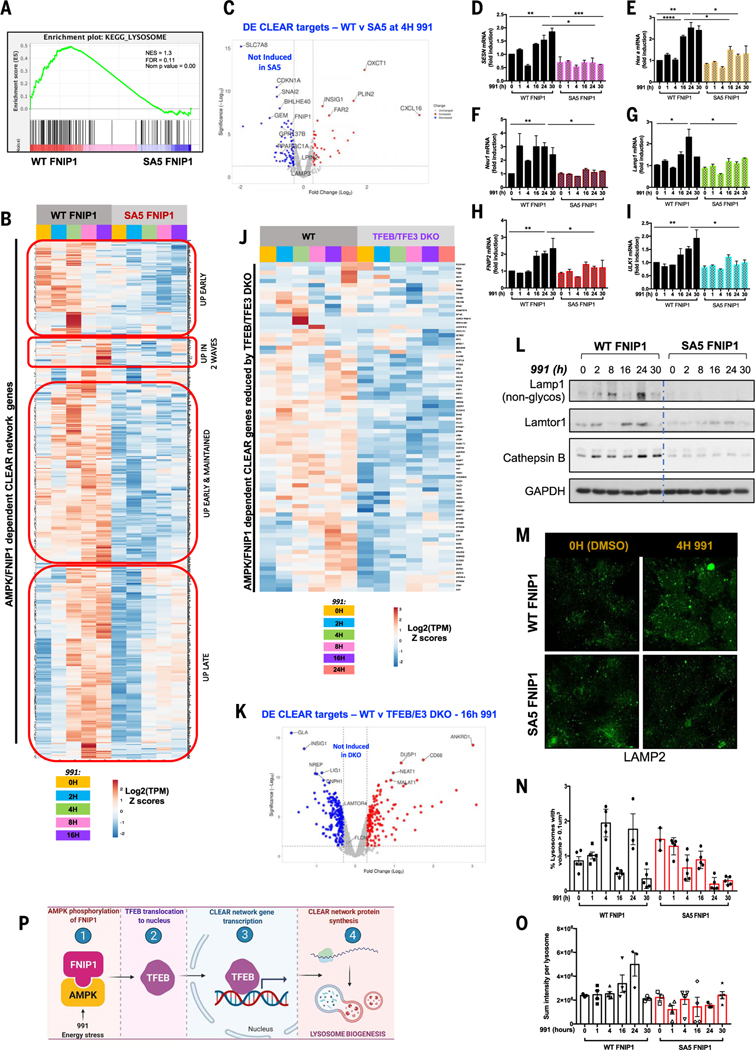
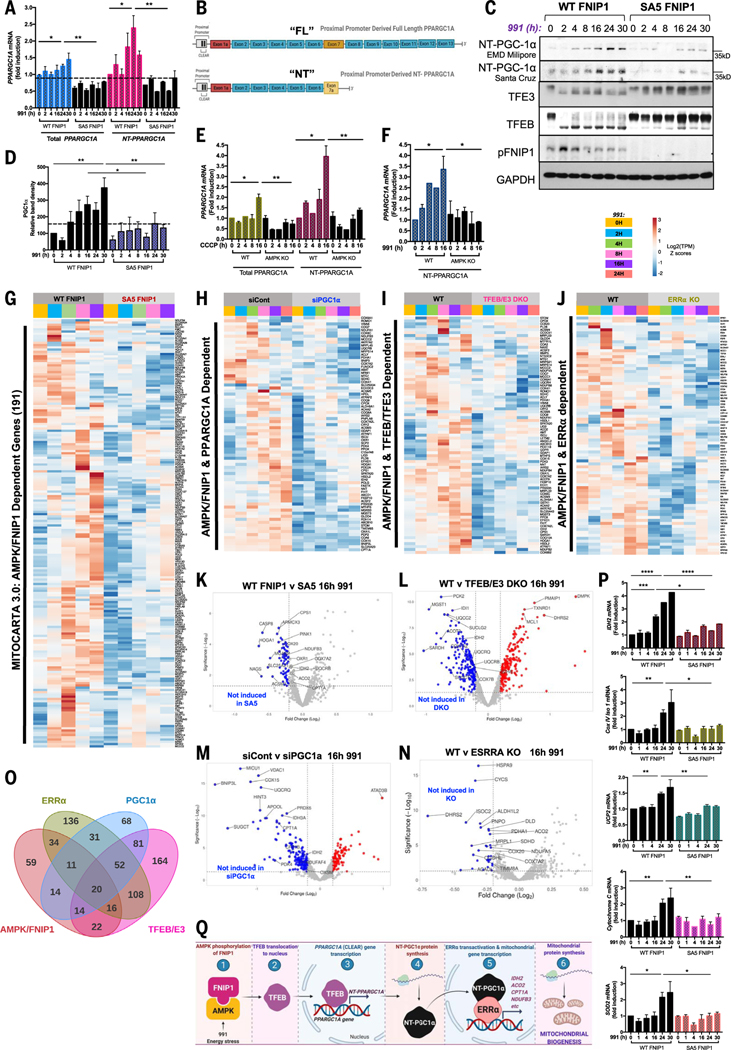
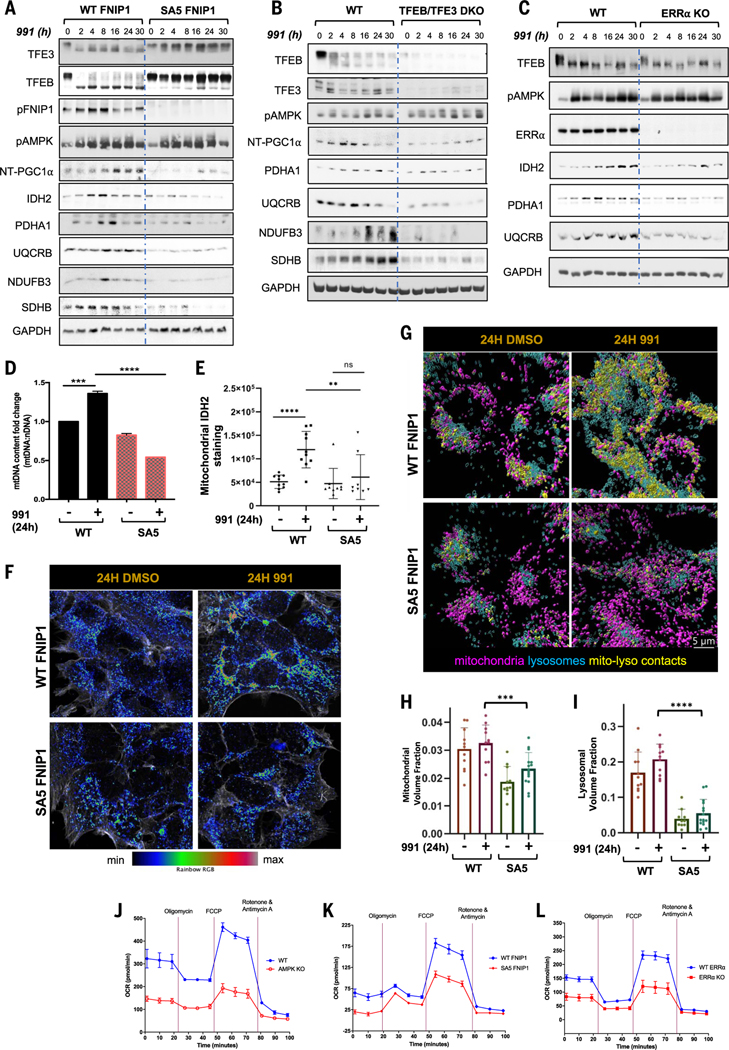
Cells respond to mitochondrial poisons with rapid activation of the adenosine monophosphate-activated protein kinase (AMPK), causing acute metabolic changes through phosphorylation and prolonged adaptation of metabolism through transcriptional effects. Transcription factor EB (TFEB) is a major effector of AMPK that increases expression of lysosome genes in response to energetic stress, but how AMPK activates TFEB remains unresolved. We demonstrate that AMPK directly phosphorylates five conserved serine residues in folliculin-interacting protein 1 (FNIP1), suppressing the function of the folliculin (FLCN)-FNIP1 complex. FNIP1 phosphorylation is required for AMPK to induce nuclear translocation of TFEB and TFEB-dependent increases of peroxisome proliferator-activated receptor gamma coactivator 1-alpha (PGC1α) and estrogen-related receptor alpha (ERRα) messenger RNAs. Thus, mitochondrial damage triggers AMPK-FNIP1-dependent nuclear translocation of TFEB, inducing sequential waves of lysosomal and mitochondrial biogenesis.


Conflict of interest statement

Competing interests: All authors declare that they have no competing interests.

Figures

Fig. 1.
Fig. 1.. Dominant role of AMPK in the transcriptional response to mitochondrial poisons through the MiT-TFE family of transcription factors.
RNA-seq analysis of WT and CRISPR-Cas9–mediated AMPK KO HEK293T cells upon 0- to 16-hour treatment with the mitochondrial poisons CCCP (5 μM), rotenone (100 ng/ml), phenformin (2 mM), and the AMPK-specific activation drug 991 (50 μM). (A) Unbiased heatmap displaying gene expression pattern of all AMPK-dependent, differentially expressed (DE) genes (FC ≥ 1.3, P ≤ 0.05) commonly regulated by all three mitochondrial poisons and 991. (B) Stacked Venn diagram showing the proportion of DE CCCP-induced genes that require AMPK. (C) GSEA analysis shows significantly up-regulated GTRD (ChIP-seq–based Gene Transcription Regulation Database) transcription factor targets upon CCCP treatment. (D) Gene clustering analysis and heat-map displaying the expression pattern of all mitochondria-specific genes as defined by the Mitocarta 3.0 inventory. Right heatmap is a zoomed-in view of the AMPK-dependent mitochondrial genes induced by the four drugs. (E) Overlap in regulation of AMPK-dependent mitochondrial genes in (D) by CCCP, rotenone, phenformin, and 991. (F) Volcano plot depicting DE mitochondrial genes from (D) after 991 compared with DMSO. Red dots represent genes significantly induced by 991 compared with DMSO. The y axis denotes −log10 P values, and the x axis shows log2 FC values. (G) Volcano plot denoting differential expression of mitochondrial genes between WT 16-hour 991-treated cells compared with AMPK KO 16-hour 991-treated cells. Blue dots represent genes significantly down-regulated by AMPK deletion compared with WT AMPK condition. The y axis denotes −log10 P values, and the x axis shows log2 FC values. (H to J) Quantitative RT-PCR (qRT-PCR) for lysosomal gene Lamp2 (H), mitochondrial genes IDH2 (I), and Cox6A1 (J) in WT and AMPK KO HEK293T cells after CCCP. (K to M) qRT-PCR for lysosomal gene Lamp2 (K) and mitochondrial genes IDH2 (L) and ACO2 (M) in WT and AMPK KO HEK293T cells after 991 treatment. All qRT-PCR graphs are shown as the means ± SEMs. *P < 0.05; **P < 0.01; ***P < 0.001; ****P < 0.0001; unpaired t test. (N) Analysis of AMPK signaling and TFEB protein immunoblotting of WT and AMPK KO HEK293T cells treated with DMSO, 991, or phenformin for 1 hour. (O) Analysis of AMPK, TFEB, and mitochondrial protein immunoblotting of WT and AMPK KO HEK293T cells treated with a rotenone (100 ng/ml) time course, ranging from 0 to 24 hours. (P) Analysis of AMPK, TFEB, and mitochondrial protein immunoblotting of WT and AMPK KO HEK293T cells treated with a 991 (50 μM) time course, ranging from 0 to 24 hours. (Q) Analysis of TFEB and TFE3 protein cytoplasm-to-nuclear shuttling by fractionation of WT and AMPK KO HEK293T cells with or without 1-hour 991 treatment, followed by immunoblotting. (R) Quantification of TFEB colocalization with DAPI-stained nuclei. Data are shown as the means ± SEMs of three independent experiments. *P < 0.05; **P < 0.01; unpaired t test. (S) Representative images from immunofluorescence microscopy of endogenous TFEB stained in WT and AMPK KO HEK293T cells, pretreated with 1 hour of DMSO or 991. Nuclei are stained with DAPI. (T) Model. After ETC poisons or the direct small-molecule activator 991, AMPK becomes activated and, through an unknown mechanism, triggers TFEB translocation to the nucleus, where TFEB induces expression of lysosomal and mitochondrial genes.
Fig. 2.
Fig. 2.. FNIP1 as a conserved AMPK substrate that regulates TFEB and TFE3.
(A) ClustalW alignment of five conserved AMPK phosphorylation sites on FNIP1 matching the AMPK substrate consensus motif. (B) AMPK phosphorylation sites on FNIP1 identified by MS in HEK293T cells, expressing FLAG-tagged FNIP1 cDNA, after treatment with vehicle or 1 hour of phenformin. (C) In vitro AMPK kinase assay. WT FNIP1 or FNIP1 mutants (SA2, SA3, SA4, SA5) were immunoprecipitated and incubated with recombinant active AMPK and [γ32P]-ATP. Kinase reactions were separated by SDS-PAGE and incorporation of [γ32P]-ATP was detected by autoradiography. (D) Immunoblot showing endogenous TFEB and FNIP1 (Ser220) phosphorylation status in WT (+/+) or AMPK DKO (−/−) MEFs after DMSO or a 991 time course, as detected by an antibody to FNIP1 P-Ser220. (E) Immunoblots of murine liver lysates from inducible KO of AMPKα1 and α2 (Alb-CreERT2; Prkaa1fl/fl; Prkaa2fl/fl) mice (AMPK KO) or control mice treated with vehicle or AMPK activator compound MK8722 for 2 hours, showing endogenous FNIP1 and TFEB phosphorylation status. (F) Immunoblots of lysates from primary mouse hepatocytes Prkaa2fl/fl) mice (AMPK liver DKO), treated with vehicle or metformin for 5 hours. (G) Immunoblots of endogenous pFNIP1 Ser220 and TFEB in in FNIP1 KO HEK293T cells stably reconstituted with WT, SA4, or SA5 FNIP1, treated with a 991 (50 μM) time course. (H) Nucleocytoplasmic fractionation of WT or SA5 FNIP1 HEK293T cells after 1-hour DMSO or 991 treatment, followed by immunoblotting. (I) Quantitation of TFEB colocalization with DAPI-stained nuclei in (J). Data are shown as the means ± SEMs of three independent experiments. *P < 0.05; **P < 0.01; ***P < 0.001; unpaired t test. (J) Representative immunofluorescence images of endogenous TFEB stained in WT FNIP1 and SA5-FNIP1 HEK293T cells, treated with 1-hour DMSO or 991. Nuclei are stained with DAPI.
Fig. 3.
Fig. 3.. AMPK phosphorylation of FNIP1 blocks FLCN-FNIP1 GAP activity to control RagC and thereby TFEB and TFE3 activity.
(A) WT and AMPK KO HEK293T cells were subjected to a short 991 (50 μM) time course, and lysates were immunoblotted with the indicated antibodies to probe for mTORC1 signaling. (B) WT FNIP1 and SA5 FNIP1 HEK293T cells were treated as in (A), and lysates were immunoblotted to probe for mTORC1 signaling. (C) WT parental or AMPK-null HEK29T cells were AA starved for the indicated times, and lysates were immunoblotted to examine mTORC1 signaling. (D) WT FNIP1 or SA5 FNIP1 HEK293T cells were administered with the mTOR inhibitors AZD8055 or Torin1 either individually or in combination with 991, as indicated. Lysates were subsequently immunoblotted to examine TFEB phosphorylation status. (E) WT or SA5 FNIP1 cells, stably expressing GFP-TFEB cDNA were treated with or without 50-μM 991 for 1 hour. GFP-TFEB was immunoprecipitated from the lysates, and immunoprecipitates were analyzed by Western blotting. (F) Immunoprecipitates of GFP-TFEB, stably expressed in WT FNIP1 and SA5 FNIP1 HEK293T cells, were subjected to immunoblotting to probe interactions with the Rag GTPases. (G) Quantitation of RagC colocalization with Lamp2 in (H). Data are shown as the means ± SEMs of three independent experiments. *P < 0.05; **P < 0.01; unpaired t test. (H) Representative immunofluorescence images of endogenous RagC costained with Lamp2 in WT FNIP1 and SA5 FNIP1 HEK293T cells treated with 1 hour of DMSO or 991 (50 μM). (I) WT FNIP1 or SA5 FNIP1 cells were transiently transfected with HA-RagC mutants locked in either the GTP-bound state (Q120L) or the GDP-bound state (S75N) and subsequently treated with or without 1-hour 991. Lysates were immunoblotted with the indicated antibodies. (J) HA-RagC mutants from (I) were immunoprecipitated from lysates using HA magnetic beads and immunoprecipitates analyzed by Western blotting.
Fig. 4.
Fig. 4.. Lysosomal biogenesis mediated by the MiT-TFE family of transcription factors is dependent on AMPK phosphorylation of FNIP1.
(A) GSEA plot for the “KEGG Lysosome” gene set, which was enriched in WT FNIP1 16-hour 991-treated but not SA5 conditions. (B) RNA-seq analysis of WT FNIP1 and SA5 FNIP1 cells subjected to a 0- to 16-hour 991 (50 μM) time course. Clusteringanalysis and heatmap displaysexpression patterns of AMPK-FNIP1–dependent CLEAR network genes that have been previously validated or GSEA defined. (C) Volcano plot depicting differential expression of CLEAR network genes after 4-hour 991 in WT FNIP1 versus SA5 FNIP1 conditions. Blue dots represent genes significantly down-regulated by mutation of AMPK sites on FNIP1. The y axis denotes −log10 P values, and the x axis shows log2 FC values. (D to I) qRT-PCR of CLEAR network genes SESN (C), Hex A (D), Neu1 (E), Lamp1 (F), FNIP2 (G), and ULK1 (H) in WT FNIP1 and SA5 FNIP1 HEK293T cells subjected to a 0- to 30-hour 991 (50 μM) time course. Graphs are shown as means ± SEMs. n = 3. *P < 0.05; **P < 0.01; ***P < 0.001; unpaired t test. (J) RNA-seq analysis of WT parental and CRISPR-Cas9–mediated TFEB-TFE3 DKO HEK293T cells treated with a 0- to 24-hour 991 time course. Heatmap shows AMPK-FNIP1–dependent genes whose expression is reduced by loss of TFEB-TFE3. (K) Volcano plot denoting CLEAR network DE genes after 16 hours of 991 in WT versus TFEB-TFE3 DKO FNIP1 cells. Blue dots represent genes significantly reduced by deletion of TFEB-TFE3. The y axis denotes −log10 P values, and the x axis shows log2 FC values. (L) Immunoblotting of lysosomal proteins in WT FNIP1 and SA5 FNIP1 HEK 293 cells after a 0- to 30-hour 991 time course. (M) Representative immunofluorescence images of lysosome structures stained with Lamp2 antibody after DMSO or 4-hour 991 treatment of WT FNIP1 and SA5 FNIP1 cells. (N) Quantitation of Lamp2 lysosomal structures from (M) and at the time points indicated, showing percentage of lysosome structures with volume greater than 0.1 μm3 after a 0- to 30-hour 991 time course in WT FNIP1 and SA5 FNIP1 cells. (O) Quantitation of Lamp2 sum intensity per lysosome in (M) and other time points from the same experiment. (P) Model. AMPK phosphorylation of FNIP1, induced by 991 or energetic stress, triggers TFEB entry into the nucleus, where it binds to CLEAR elements on lysosomal gene promoters, inducing lysosomal gene transcription, enhancing lysosomal protein expression and thereby lysosome biogenesis.
Fig. 5.
Fig. 5.. FNIP1 phosphorylation by AMPK is critical for induction of the PGC1α- and ERRα-mediated mitochondrial biogenesis program through MiT-TFE transcription factors.
(A) qRT-PCR showing expression of total PPARGC1A compared with expression of the shorter NT-PPARGC1A splice isoform. Graphs are shown as means ± SEMs. n = 3. *P < 0.05; **P < 0.01; unpaired t test. (B) Schematic of the two predominant splice isoforms of PPARGC1A induced in this cell type in our conditions. (C) Immunoblots reflecting changes in expression of NT-PGC1α protein levels in WT FNIP1 versus SA5 FNIP1 cells in the presence or absence of a 991 time course. Molecular weights are indicated on the right. (D) Densitometry analysis of NT-PGC1α immunoblots. (E) qRT-PCR comparing expression of total PPARGC1A compared with that of shorter NT-PPARGC1A splice isoform in WT and AMPK KO HEK293T after a 0- to 16-hour CCCP time course. (F) qRT-PCR comparing expression of NT-PPARGC1A splice isoform in WT and AMPK KO HEK293T after a 0- to 16-hour 991 time course. For (D) to (F), all values are shown as means ± SEMs. n = 3. *P < 0.05; **P < 0.01; ***P < 0.001; unpaired t test. (G) Gene clustering analysis of RNA-seq data from WT FNIP1 and SA5 FNIP1 cells subjected to 991 time course treatments. Heatmap displays expression pattern of AMPK- and FNIP1-dependent mitochondria specific genes, as defined by the Mitocarta 3.0 inventory. (H) RNA-seq analysis of HEK293T cells transfected with control siRNA (siCont) or siRNA targeting PGC1α (siPGC1α) and treated with 0 to 24 hours of 991, as indicated. Heatmap displays AMPK-FNIP1–dependent Mitocarta 3.0 genes whose expression is lost with PGC1α knockdown. (I) RNA-seq analysis of WT and TFEB-TFE3 DKO HEK293T cells treated with 0 to 24 hours of 991. Heatmap displays expression pattern of AMPK-FNIP1–dependent mitochondrial genes, as defined by Mitocarta 3.0, that are lost upon TFEB-TFE3 deletion. (J) RNA-seq analysis of WT versus ERRα KO HEK293T cells subjected to a 991 time course, as indicated. Heatmap visualizes the expression pattern of AMPK-FNIP1–dependent mitochondrial genes in WT and ERRα KO HEK293T cells. (K) Volcano plot displaying Mitocarta 3.0 DE genes after 16-hour 991 in WT versus SA5 FNIP1 cells. Blue dots represent genes significantly down-regulated by mutation of AMPK sites on FNIP1. (L) Volcano plot depicting DE Mitocarta 3.0 genes in 16-hour 991-treated WT versus 16-hour 991-treated TFEB-TFE3 DKO RNA-seq dataset. Blue dots represent genes significantly down-regulated by CRISPR deletion of TFEB-TFE3. (M) Volcano plot depicting DE Mitocarta 3.0 genes in 16-hour 991 siCont versus 16-hour 991 siPGC1α RNA-seq dataset. Blue dots represent genes significantly down-regulated by knockdown of PGC1α. (N) RNA-seq analysis of WT versus ERRα KO HEK293T cells. Volcano plot displaying DE Mitocarta 3.0 genes after 16-hour 991 in WT versus ERRα null cells. Blue dots represent genes significantly down-regulated by deletion of ERRα. (O) Four-way Venn diagram showing overlap of gene sets controlled by AMPK-FNIP1, TFEB-TFE3, PGC1α, and ERRα. (P) qRT-PCR of mitochondrial genes including IDH2, Cox IV, CytoC, UCP2, and SOD2 in WT FNIP1 and SA5 FNIP1 HEK293T cells subjected to a 0- to 30-hour 991 time course. All data are shown as means ± SEMs. n = 3. *P < 0.05; **P < 0.01; ***P < 0.001; ****P < 0.0001; unpaired t test. (Q) Model. AMPK phosphorylation of FNIP1 after energy stress or 991 facilitates TFEB nuclear entry where it binds to CLEAR network gene promoters, including the PPARGC1A promoter, which induces expression of the short ~35-kDa transcriptional coactivator NT-PGC1α isoform. In turn NT-PGC1α transactivates the ERRα transcription factor for induction of mitochondrial genes.
Fig. 6.
Fig. 6.. AMPK-FNIP1–mediated mitochondrial biogenesis affects mitochondrial function and behavior.
(A to C) Western blots probing mitochondrial protein expression after a 991 time course ranging from 0 to 30 hours in WT FNIP1 and SA5 FNIP1 HEK293T cells (A), WT and TFEB-TFE3 DKO HEK293T cells (B), and WT and ERRα KO HEK293T cells (C). (D) Mitochondrial DNA content analysis. The ratio of mitochondrial (16S) to nuclear (actin) DNA was determined by qRT-PCR after treatment for 24 hours with 991 or DMSO (vehicle), as indicated. (E) Quantitation of IDH2 staining in (F). (F) Representative Airyscan microscopy images of mitochondrial IDH2 staining in WT FNIP1 and SA5 FNIP1 HEK293T cells treated for 24 hours with 991 or DMSO, as indicated. (G) Representative Airyscan images of Lamp2-stained lysosomes and Cox IV–stained mitochondria in WT FNIP1 and SA5 FNIP1 HEK293T cells treated for 24 hours with DMSO or 991, as indicated. (H) Quantitation of mitochondrial volume in (G). (I) Quantitation of lysosomal volume in (G). (J) Seahorse assay to measure OCR in WT compared with AMPK KO HEK293T cells. (K) Seahorse assays displaying OCR in WT FNIP1 compared with SA5 FNIP1 HEK293T cells. (L) Seahorse assays measuring OCR in WT compared with ERRα KO HEK293T cells. Graphs are shown as the means ± SEMs. n = 3. *P < 0.05; **P < 0.01; ***P < 0.001; ****P < 0.0001; unpaired t test.

References

    1. González A, Hall MN, Lin SC, Hardie DG, AMPK and TOR: The Yin and Yang of Cellular Nutrient Sensing and Growth Control. Cell Metab. 31, 472–492 (2020). doi: 10.1016/j.cmet.2020.01.015; pmid: 32130880 - DOI - PubMed
    1. Hardie DG, Keeping the home fires burning: AMP-activated protein kinase. J. R. Soc. Interface 15, 20170774 (2018). doi: 10.1098/rsif.2017.0774; pmid: - DOI - PMC - PubMed
    1. Herzig S, Shaw RJ, AMPK: Guardian of metabolism and mitochondrial homeostasis. Nat. Rev. Mol. Cell Biol 19, 121–135 (2018). doi: 10.1038/nrm.2017.95; pmid: 28974774 - DOI - PMC - PubMed
    1. Kelly DP, Scarpulla RC, Transcriptional regulatory circuits controlling mitochondrial biogenesis and function. Genes Dev. 18, 357–368 (2004). doi: 10.1101/gad.1177604; pmid: 15004004 - DOI - PubMed
    1. Roczniak-Ferguson A. et al., The transcription factor TFEB links mTORC1 signaling to transcriptional control of lysosome homeostasis. Sci. Signal 5, ra42 (2012). doi: 10.1126/scisignal.2002790; pmid: 22692423 - DOI - PMC - PubMed

MeSH terms

Substances

LinkOut - more resources