. 2023 May 4;39(5):btad201.
doi: 10.1093/bioinformatics/btad201.

CONNECTOR, fitting and clustering of longitudinal data to reveal a new risk stratification system

Affiliations

CONNECTOR, fitting and clustering of longitudinal data to reveal a new risk stratification system

Simone Pernice et al. Bioinformatics. .

Abstract

Motivation: The transition from evaluating a single time point to examining the entire dynamic evolution of a system is possible only in the presence of the proper framework. The strong variability of dynamic evolution makes the definition of an explanatory procedure for data fitting and clustering challenging.

Results: We developed CONNECTOR, a data-driven framework able to analyze and inspect longitudinal data in a straightforward and revealing way. When used to analyze tumor growth kinetics over time in 1599 patient-derived xenograft growth curves from ovarian and colorectal cancers, CONNECTOR allowed the aggregation of time-series data through an unsupervised approach in informative clusters. We give a new perspective of mechanism interpretation, specifically, we define novel model aggregations and we identify unanticipated molecular associations with response to clinically approved therapies.

Availability and implementation: CONNECTOR is freely available under GNU GPL license at https://qbioturin.github.io/connector and https://doi.org/10.17504/protocols.io.8epv56e74g1b/v1.


Conflict of interest statement

L.T. has received research grants from Menarini, Merck KGaA, Merus, Pfizer, Servier and Symphogen. The other authors declare no conflicts.

Figures
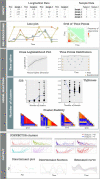
Figure 1.
Figure 1.
The framework pipeline of the CONNECTOR package. The four main stages of data processing are illustrated. The input data are the sampled curves, associated with annotation features. Data are pre-processed and curves are plotted. The heatmap of the full time grid is also provided. The model selection is supported with the cross-validated log-likelihoods and the positions of the knots for the choice of the dimension of the spline basis, and with violin plots for fDB (see Equation (5)) and the total tightness (see Equation (4)). Stability matrices are reported for the choice of the number of clusters. The output of the process is illustrated with the plots of the clustered curves.
Figure 2.
Figure 2.
CONNECTOR results. (A) CONNECTOR tumor growth classes (CTGCs) for three, four, and five clusters. The circos plots show the repositioning of the curves as the number of CTGCs changes. (B) CONNECTOR tumor growth classes with 2-fold clustering. The nine boxes result from a first run with a number of clusters equal to three followed by second runs on the CTGC-A (with five sub-classes) and on the CTGC-B (with three sub-classes). To make more appreciable the differences among the clusters the y-axis reaches the maximum value of 2500 mm3. (C) t-SNE visualization of the CTGCs induced on the parental tumors. Each dot corresponds to a parental tumor. The color of the dots matches the color of the assigned CTGC, see Panel B. The dimension of the dots is inversely proportional to the Shannon Index calculated on the distribution of the curves of the same parental tumor across CTGCs (large dots—small entropy).
Figure 3.
Figure 3.
CONNECTOR clusters molecular annotation and transcriptomic analyses. (A) Molecular and phenotypic characterization of the CONNECTOR clustered mCRC xenografts: each sample was annotated according to CRIS subtype, response to cetuximab and somatic alteration known to determine cetuximab resistance or sensitivity. (B) Differential expression of genes in the “keratinization” GO in CTGCs: volcano plot showing the magnitude of expression differential (x-axis, Log2 FoldChange) and significance (y-axis, −Log10 adjusted P value) of “keratinization” genes when comparing CTGCs enriched in PD versus Aa. Only comparisons involving CTGCs enriched in PD with at least nine total samples are reported for clarity. The top five upregulated genes in Bb are labeled (SPRR a family of proteins induced during the differentiation of keratinocytes). (C) HOPX expression in keratin-high and keratin-low samples: the y-axis shows DESeq2 corrected counts. (D) Survival analysis of TCGA COAD-READ (colon and rectum adenocarcinoma) patients stratified by HOPX expression levels: survival time is in months, 134 (high) and 237 (low) patients. Log-rank P-value 8.6×10³.

References

    1. Baralis E, Bertotti A, Fiori A. et al. Las: a software platform to support oncological data management. J Med Syst 2012;36(Suppl 1):S81–90. 10.1007/s10916-012-9891-6. - DOI - PubMed
    1. Benzekry S, Lamont C, Beheshti A. et al. Classical mathematical models for description and prediction of experimental tumor growth. PLoS Comput Biol 2014;10:e1003800. 10.1371/journal.pcbi.1003800. - DOI - PMC - PubMed
    1. Bertotti A, Migliardi G, Galimi F. et al. A molecularly annotated platform of patient-derived xenografts (”xenopatients”) identifies HER2 as an effective therapeutic target in cetuximab-resistant colorectal cancer. Cancer Discov 2011;1:508–23. 10.1158/2159-8290.CD-11-0109. - DOI - PubMed
    1. Bertotti A, Papp E, Jones S. et al. The genomic landscape of response to EGFR blockade in colorectal cancer. Nature 2015;526:263–7. 10.1038/nature14969. - DOI - PMC - PubMed
    1. Davies DL, Bouldin DW.. A cluster separation measure. IEEE Trans Pattern Anal Mach Intell 1979;1:224–7. - PubMed

Publication types