

Misinterpreting cognitive change over multiple timepoints: When practice effects meet age-related decline
- PMID: 37079809
- PMCID: PMC10313772
- DOI: 10.1037/neu0000903
Misinterpreting cognitive change over multiple timepoints: When practice effects meet age-related decline
Abstract
Objective: Practice effects (PE) on cognitive testing have been shown to delay detection of impairment and impede our ability to assess change. When decline over time is expected, as with older adults or progressive diseases, failure to adequately address PEs may lead to inaccurate conclusions because PEs artificially boost scores while pathology- or age-related decline reduces scores. Unlike most methods, a participant-replacement approach can separate pathology- or age-related decline from PEs; however, this approach has only been used across two timepoints. More than two timepoints make it possible to determine if PEs level out after the first follow-up, but it is analytically challenging because individuals may not be assessed at every timepoint.
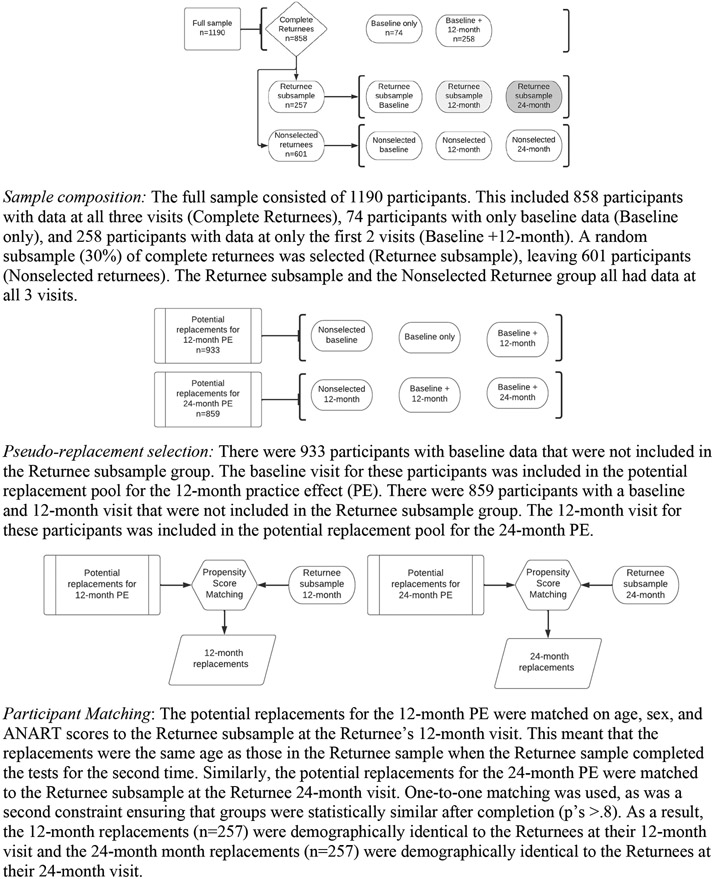
Method: We examined 1,190 older adults who were cognitively unimpaired (n = 809) or had mild cognitive impairment (MCI; n = 381). Participants completed six neuropsychological measures at three timepoints (baseline, 12-month, 24-month). We implemented a participant-replacement method using generalized estimating equations in comparisons of matched returnees and replacements to calculate PEs.
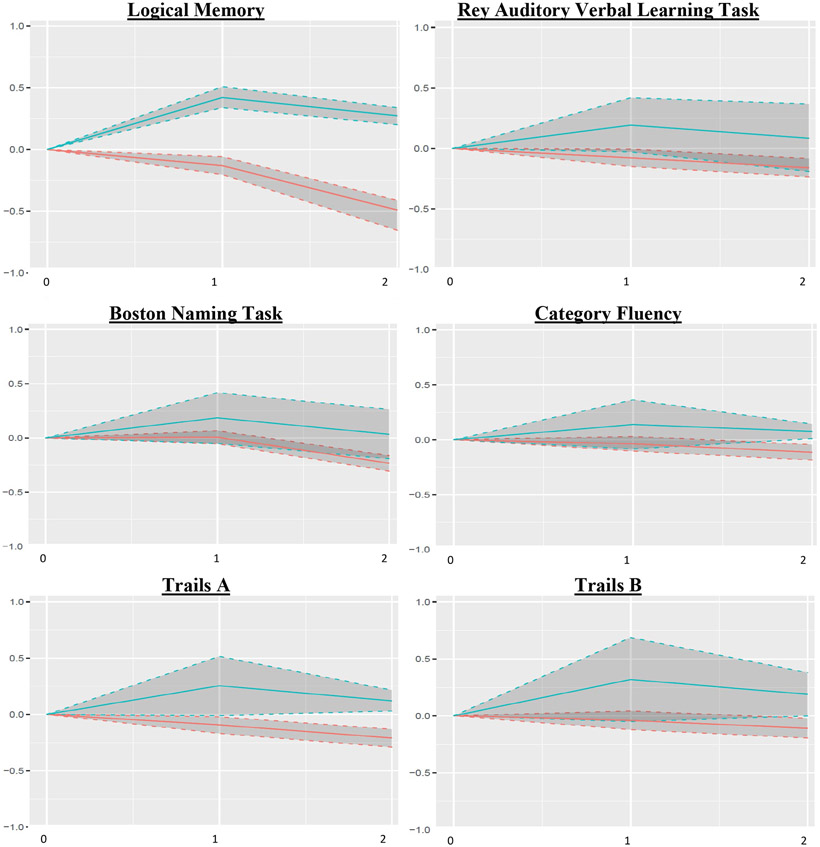
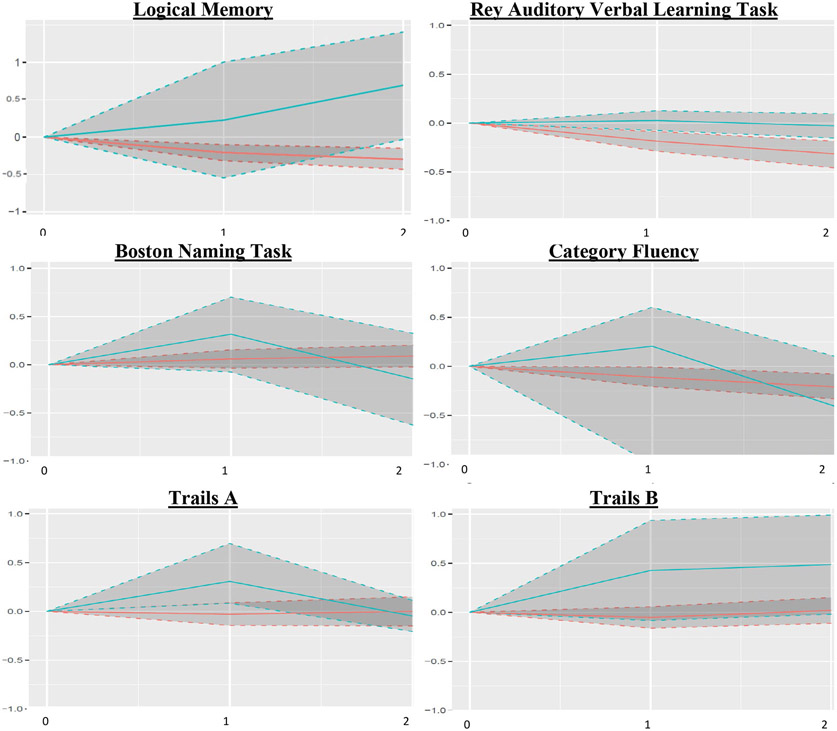
Results: Without accounting for PEs, cognitive function appeared to improve or stay the same. However, with the participant-replacement method, we observed significant PEs within both groups at all timepoints. PEs did not uniformly decrease across time; some-specifically on episodic memory measures-continued to increase beyond the first follow-up.
Conclusion: A replacement method of PE adjustment revealed significant PEs across two follow-ups. As expected in these older adults, accounting for PEs revealed cognitive decline. This, in turn, means earlier detection of cognitive deficits, including progression to MCI, and more accurate characterization of longitudinal change. (PsycInfo Database Record (c) 2023 APA, all rights reserved).
Figures
References
-
- Albert MS, DeKosky ST, Dickson D, Dubois B, Feldman HH, Fox NC, … Petersen RC (2011). The diagnosis of mild cognitive impairment due to Alzheimer's disease: recommendations from the National Institute on Aging-Alzheimer's Association workgroups on diagnostic guidelines for Alzheimer's disease. Alzheimer's & Dementia, 7(3), 270–279. - PMC - PubMed
-
- Byrd DA, & Rivera-Mindt MG (2022). Neuropsychology’s race problem does not begin or end with demographically adjusted norms. Nature Reviews Neurology, 1–2. - PubMed
-
- Calamia M, Markon K, & Tranel D (2012). Scoring higher the second time around: meta-analyses of practice effects in neuropsychological assessment. The Clinical neuropsychologist, 26(4), 543–570. - PubMed
-
- Chelune GJ, Bornstein RA, & Prifitera A (1990). The Wechsler memory scale—revised. In Advances in psychological assessment (pp. 65–99): Springer.
-
- Chelune GJ, Naugle RI, Lüders H, Sedlak J, & Awad IA (1993). Individual change after epilepsy surgery: Practice effects and base-rate information. Neuropsychology, 7(1), 41.
MeSH terms
Grants and funding
LinkOut - more resources
Full Text Sources
Medical
Research Materials
