. 2023 Jun:162:114714.
doi: 10.1016/j.biopha.2023.114714. Epub 2023 Apr 18.

Triciribine attenuates pathological neovascularization and vascular permeability in a mouse model of proliferative retinopathy

Affiliations

Triciribine attenuates pathological neovascularization and vascular permeability in a mouse model of proliferative retinopathy

Shengshuai Shan et al. Biomed Pharmacother. 2023 Jun.

Abstract

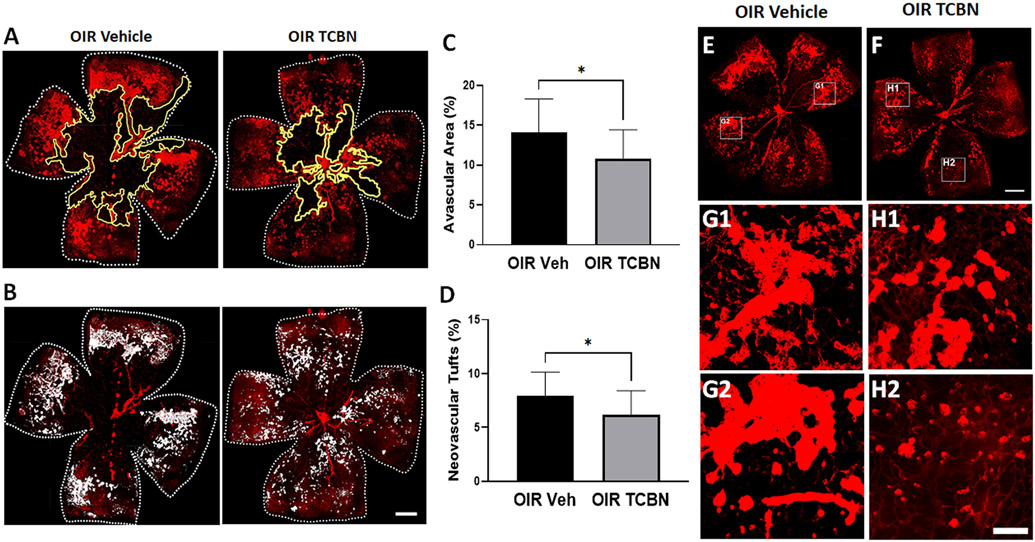
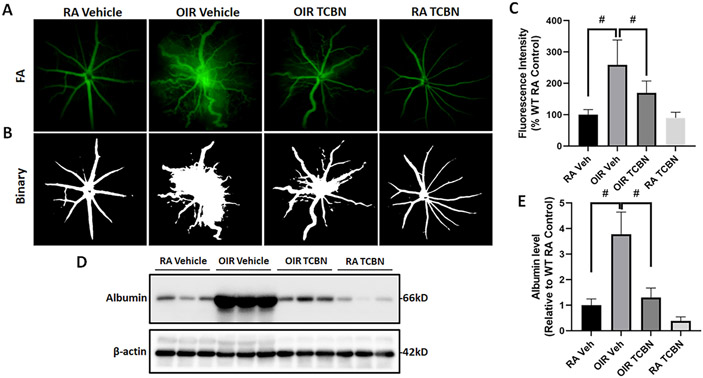
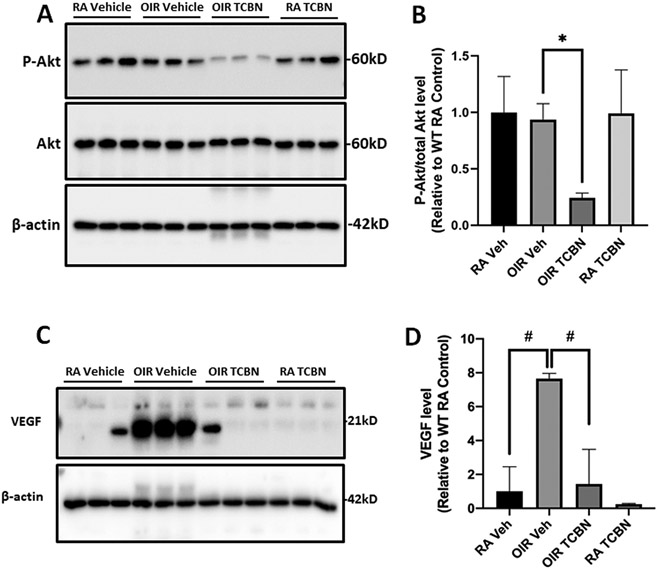
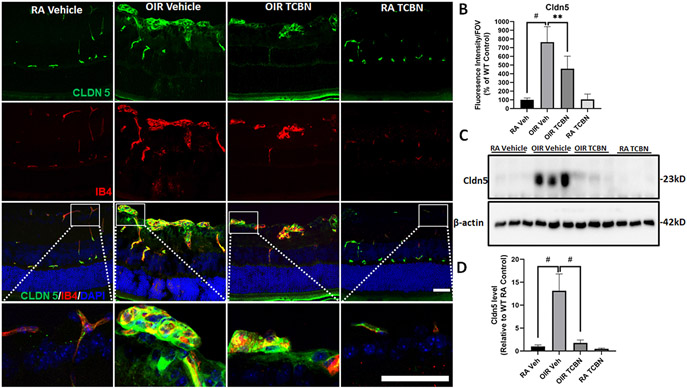
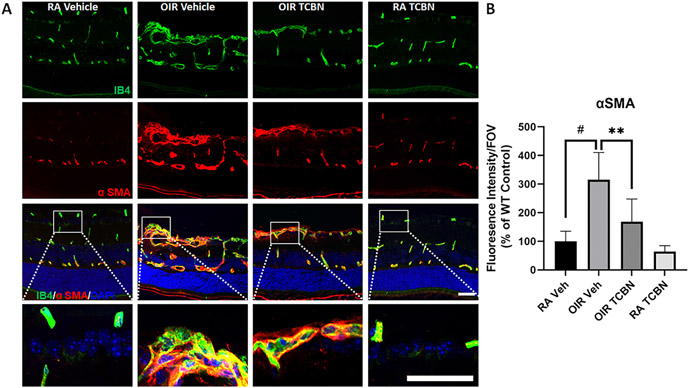
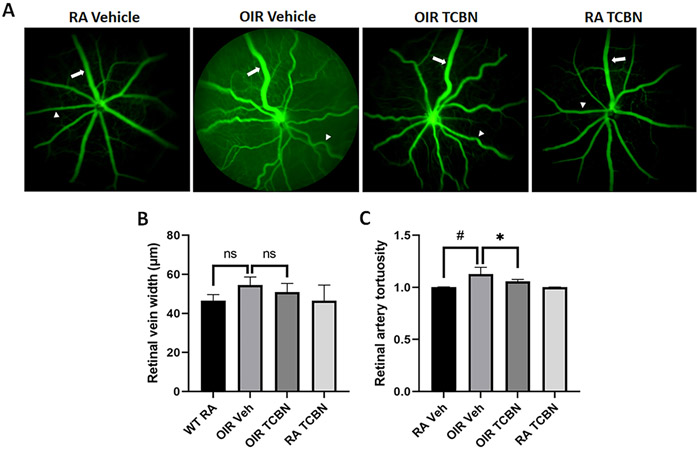
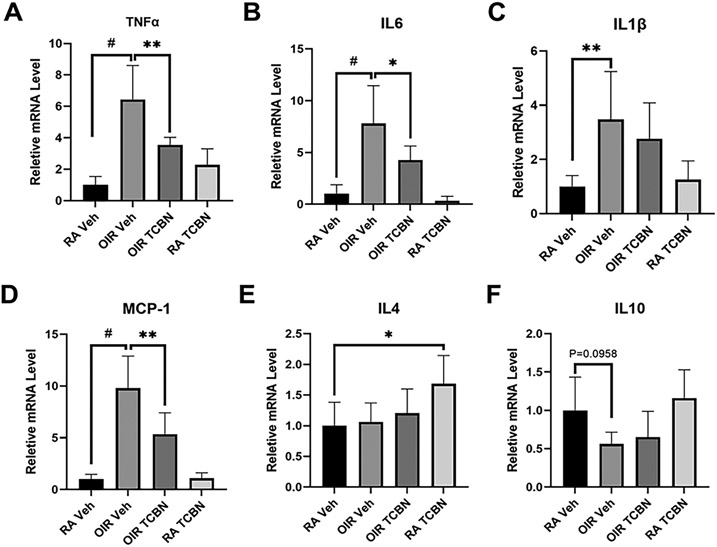
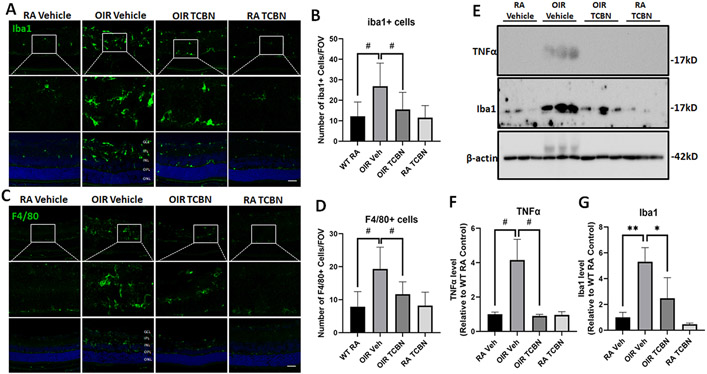
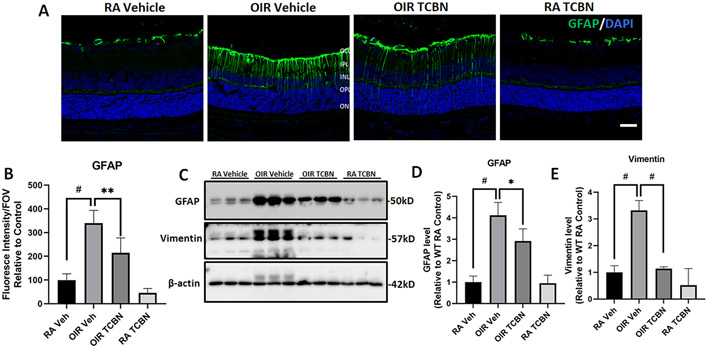
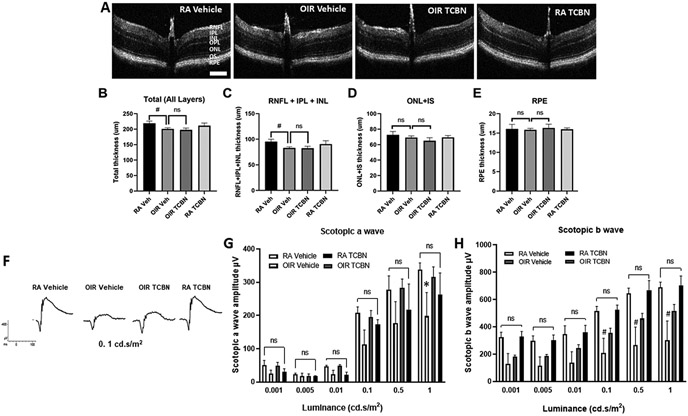
Proliferative retinopathies are the leading cause of irreversible blindness in all ages, and there is a critical need to identify novel therapies. We investigated the impact of triciribine (TCBN), a tricyclic nucleoside analog and a weak Akt inhibitor, on retinal neurovascular injury, vascular permeability, and inflammation in oxygen-induced retinopathy (OIR). Post-natal day 7 (P7) mouse pups were subjected to OIR, and treated (i.p.) with TCBN or vehicle from P14-P16 and compared with age-matched, normoxic, vehicle or TCBN-treated controls. P17 retinas were processed for flat mounts, immunostaining, Western blotting, and qRT-PCR studies. Fluorescein angiography, electroretinography, and spectral domain optical coherence tomography were performed on days P21, P26, and P30, respectively. TCBN treatment significantly reduced pathological neovascularization, vaso-obliteration, and inflammation marked by reduced TNFα, IL6, MCP-1, Iba1, and F4/80 (macrophage/microglia markers) expression compared to the vehicle-treated OIR mouse retinas. Pathological expression of VEGF (vascular endothelial growth factor), and claudin-5 compromised the blood-retinal barrier integrity in the OIR retinas correlating with increased vascular permeability and neovascular tuft formation, which were blunted by TCBN treatment. Of note, there were no changes in the retinal architecture or retinal cell function in response to TCBN in the normoxia or OIR mice. We conclude that TCBN protects against pathological neovascularization, restores blood-retinal barrier homeostasis, and reduces retinal inflammation without adversely affecting the retinal structure and neuronal function in a mouse model of OIR. Our data suggest that TCBN may provide a novel therapeutic option for proliferative retinopathy.

Keywords: Neovascular tufts; Neuroinflammation; Oxygen-induced retinopathy; Proliferative retinopathy; Triciribine; Vascular permeability.


Conflict of interest statement

Conflict of Interest Statement PRS is a scientific advisor of Ayma Therapeutics, NJ. All other authors declare that there are no financial or other conflicts of interest exist.

Figures

Fig. 1.
Fig. 1.
TCBN suppresses vaso-obliteration and pathological neovascularization in the OIR retina. (A-B) Representative confocal images of flat-mounted retinas (harvested on P17) stained with isolectin B4 (red, blood vessels) demonstrating avascular areas (the yellow outlined region represents the area of vaso-obliteration) and pathological angiogenesis (the white areas indicate areas of neovascular tufts). (C) The retinal avascular area was quantified using NIH ImageJ software. Assessment of vaso-obliteration is expressed as the central avascular areas divided by the total area of the retina. (D) Quantification analysis of the total area of neurovascular tufts was calculated as the percentage of the retinal neovascular tuft area, measured using the semi-automated thresholding technique in the NIH ImageJ. (E-F) Representative flat-mount images demonstrating changes in pathological neurovascular tufts in both OIR vehicle- and OIR TCBN-treated retinas, with two insets (boxed areas). G1 and G2 show representative neurovascular tuft areas from vehicle OIR retinas while H1 and H2 show representative neurovascular tuft areas from TCBN-treated OIR retinas. Data are presented as mean ± SD. *p < 0.05 versus OIR vehicle, n = 10–12 per group. Scale bar 500 μm.
Fig. 2.
Fig. 2.
TCBN treatment decreases vascular permeability in the OIR retina. (A-B) Fluorescein angiography (FA) analysis (performed at P21) of RA and OIR mice treated with vehicle or TCBN (P14-P17). Data presented are representative pictures taken at a constant interval of every mouse studied in each group, along with respective binary images. (C) The fluorescence intensity per mouse retina was calculated by the NIH ImageJ software. (D) Western blot analysis showing the extravasated retinal albumin in RA and OIR mice treated with vehicle or TCBN. (E) Quantification of albumin protein expression levels relative to the β-actin, compared with RA control, which was arbitrarily set at 1.0. Data are presented as mean ± SD. #p < 0.001; n = 6–14 per group for FA analysis. n = 6 per group for Western blot analysis.
Fig. 3.
Fig. 3.
TCBN treatment reduces Akt phosphorylation and VEGF expression in the OIR retina. (A) Representative Western blot images of retinal lysates (RA Vehicle, RA control, OIR, and OIR + TCBN) probed with phosphorylated Akt (Ser473), pan Akt, and β-actin. (B) Bar graph showing quantification of phosphorylated Akt expression (band densitometry) analyzed using NIH ImageJ software. (C) Representative Western blot images of retinal lysates (RA Vehicle, RA control, OIR, and OIR + TCBN) probed with VEGF and β-actin. (B) Bar graph showing quantification of VEGF expression (band densitometry) analyzed using NIH ImageJ software. Data are presented as mean ± SD. #p < 0.001; *p < 0.05. n = 3 per group.
Fig. 4.
Fig. 4.
Upregulation of claudin-5 (Cldn5) expression in the OIR retinal tufts is blunted by TCBN treatment. (A) Representative confocal images of RA and OIR retinas (with vehicle or TCBN treatment) immunostained with Cldn5 and IB4 showing markedly increased expression of Cldn5 in the tuft areas in the OIR retinas, compared with RA control and its suppression by TCBN administration. (B) Histogram presenting the quantification of Cldn5 expression measured as fluorescent intensity per field of view (FOV) used. (C) Western blot analysis showing the retinal Cldn5 expression in RA and OIR mice treated with vehicle or TCBN. (D) Quantification of Cldn5 protein expression levels relative to the β-actin, compared with RA control, which was arbitrarily set at 1.0. GCL, ganglion cell layer; IPL, inner plexiform layer; INL, inner nuclear layer; OPL, outer plexiform layer; ONL, outer nuclear layer. Data are presented as mean ± SD. #p < 0.001; * *p < 0.01; *p < 0.05. n = 5 per group for immunostaining analysis. n = 3 per group for Western blot analysis. Scale bar 50 μm.
Fig. 5.
Fig. 5.
TCBN attenuates pathological vascular remodeling in the OIR retina. (A) Representative confocal images of RA and OIR retinas showed a marked increase in αSMA expression in the tuft areas of the OIR retinas, which was blunted by TCBN treatment. (B) Histogram representing the quantification of the αSMA-covered blood vessel area. Fluorescence intensity was measured by the NIH ImageJ program and the mean values were calculated and expressed as the fluorescence intensity per field of view (FOV). Data are presented as mean ± SD. #p < 0.001; * *p < 0.01; n = 5 per group. Scale bar 50 μm.
Fig. 6.
Fig. 6.
TCBN treatment augments retinal vascular recovery in the late stage of OIR. (A) Representative FA retinal images showing changes in the vascular features such as retinal vein width (RVW) and retinal arterial tortuosity (RAT) on P30 by fluorescein angiography (FA) in the RA vehicle, OIR vehicle, TCBN OIR, and RA TCBN treatment groups. (B) Quantification of the RVW, performed using Matlab software demonstrates no difference among groups. (C) Analysis of the RAT index performed using Matlab software showing changes in OIR retinas and the impact of TCBN treatment. Arrows indicate representative vessel used for RVW and arrowheads represents those used for RAT analysis. Data are presented as mean ± SD. #p < 0.001; *p < 0.05; ns, No significance. n = 4–7 per group.
Fig. 7.
Fig. 7.
Elevated pro-inflammatory cytokines and chemokines in the OIR retinas were suppressed by TCBN. (A-D) Quantitative RT-PCR analysis demonstrating changes in the mRNA levels of pro-inflammatory cytokines and chemokines IL-1β, TNFα, IL-6, and MCP-1, respectively in the retinal samples from RA and OIR mice treated with vehicle or TCBN, normalized to GAPDH. (E-F) Quantitative RT-PCR analysis demonstrating changes in the mRNA levels of anti-inflammatory cytokines IL-4 and IL-10, respectively in the above samples (normalized to GAPDH). Data are presented as mean ± SD. #p < 0.001; **p < 0.01; * p < 0.05. n = 5–8 per group.
Fig. 8.
Fig. 8.
TCBN treatment reduces the number of microglia/macrophage cells in the OIR retina. (A) Representative immunofluorescence images of Iba1-labeled sections from RA and OIR retinas treated with vehicle or TCBN indicate the increased Iba1 positive cells and Iba1 expression level in the OIR retinas and its reversal by TCBN treatment. (B) Bar graph showing quantification of Iba1 positive cells and Iba1 expression level per FOV in RA and OIR groups treated with vehicle or TCBN. (C) Representative immunofluorescent images of F4/80-labeled sections from RA and OIR retinas treated with vehicle or TCBN indicate the increased F4/80 positive cells and F4/80 expression level in the OIR retinas, which were rescued by TCBN treatment. (D) Bar graph showing quantification of changes in F4/80 positive cells and F4/80 expression level per/FOV in tuft regions of the OIR retina and the impact of TCBN treatment. GCL, ganglion cell layer; IPL, inner plexiform layer; INL, inner nuclear layer; OPL, outer plexiform layer; ONL, outer nuclear layer. Nuclei were counter-stained with DAPI (blue). (E) Representative Western blot images of retinal lysates probed with TNFα and Iba1 antibodies, along with the loading control, β-actin. (F-G) Bar graph showing quantification of TNFα and Iba1 expression (band densitometry), respectively, analyzed using NIH ImageJ software. Data are presented as mean ± SD. #p < 0.001; * *p < 0.01; *p < 0.05. n = 5 per group for immunostaining analysis. n = 3 per group for Western blot analysis. Scale bar 50 μm.
Fig. 9.
Fig. 9.
TCBN treatment inhibits glial activation in the OIR retina. (A) Representative confocal images of retinal cryosections (P17) probed with GFAP antibodies. (B) Bar graph showing quantification of GFAP fluorescence intensity performed using NIH ImageJ software. Results are presented as percentage changes compared to the WT RA control. Nuclei were counter-stained with DAPI (blue). GCL, ganglion cell layer; IPL, inner plexiform layer; INL, inner nuclear layer; OPL, outer plexiform layer; ONL, outer nuclear layer. (C) Representative Western blot images of retinal lysates probed with GFAP and vimentin antibodies. (D-E) Bar graph showing quantification of GFAP and vimentin expression (band densitometry), respectively, analyzed using NIH ImageJ software. Data are presented as mean ± SD. #p < 0.001; * *p < 0.01; *p < 0.05. n = 5–8 per group for fluorescence intensity analysis. n = 3 per group for Western blot analysis. Scale bar 50 μm.
Fig. 10.
Fig. 10.
TCBN treatment does not affect the retinal architecture and function. (A) Representative images (B-scan) were obtained using the spectral domain optical coherence tomography (SD-OCT) on P30 from RA Veh, OIR Veh, TCBN OIR, and RA TCBN treatment groups. (B-E) Quantification of the total retinal thickness (from NFL to outer segment/RPE interface), and thickness for layers of RNFL+IPL+INL, ONL+IS, and RPE are presented. GCL, ganglion cell layer; IPL, inner plexiform layer; INL, inner nuclear layer; OPL, outer plexiform layer; ONL, outer nuclear layer; IS, inner segment; RPE, retinal pigment epithelium. Data are presented as mean ± SD. #p < 0.001; * *p < 0.01; *p < 0.05; ns, No significance. n = 5–8 per group. Scale bar 200 μm. (F-H) Retinal function by dark-adapted (scotopic) ERG in P26 RA control, RA TCBN, OIR, and OIR+TCBN treated mice were assessed. (F) Representative scotopic ERG responses at five stimulus contrasts (G) Scotopic a-wave amplitudes and (H) b-wave amplitudes for all four mouse groups plotted at the five light intensities. Changes in scotopic a wave and b wave amplitudes were studied at flash intensities ranging from 0.001 to 1.0 cd-seconds per meter squared (cd.s/m2). There were no significant differences between groups for rod or cone responses in P26 RA control and RA TCBN-treated mice. Data are shown as mean ± SEM. n = 3–6 per group.

Similar articles

Cited by

References

    1. Tonnies T, Brinks R, Isom S, Dabelea D, Divers J, Mayer-Davis EJ, Lawrence JM, Pihoker C, Dolan L, Liese AD, Saydah SH, D’Agostino RB, Hoyer A, Imperatore G, Projections of type 1 and type 2 diabetes burden in the U. S. population aged <20 years through 2060: the SEARCH for diabetes in youth study, Diabetes Care 46 (2) (2023) 313–320. - PMC - PubMed
    1. Teo ZL, Tham YC, Yu M, Chee ML, Rim TH, Cheung N, Bikbov MM, Wang YX, Tang Y, Lu Y, Wong IY, Ting DSW, Tan GSW, Jonas JB, Sabanayagam C, Wong TY, Cheng CY, Global prevalence of diabetic retinopathy and projection of burden through 2045: systematic review and meta-analysis, Ophthalmology 128 (11) (2021) 1580–1591. - PubMed
    1. Rivera JC, Dabouz R, Noueihed B, Omri S, Tahiri H, Chemtob S, Ischemic retinopathies: oxidative stress and inflammation, Oxid. Med. Cell Longev 2017 (2017) 3940241. - PMC - PubMed
    1. Rudraraju M, Narayanan SP, Somanath PR, Regulation of blood-retinal barrier cell junctions in diabetic retinopathy, Pharm. Res 161 (2020), 105115. - PMC - PubMed
    1. Miloudi K, Oubaha M, Ménard C, Dejda A, Guber V, Cagnone G, Wilson AM, Tétreault N, Mawambo G, Binet F, Chidiac R, Delisle C, Buscarlet M, Cerani A, Crespo-Garcia S, Bentley K, Rezende F, Joyal JS, Mallette FA, Gratton JP, Larrivée A, Sapieha P, NOTCH1 signaling induces pathological vascular permeability in diabetic retinopathy, Proc. Natl. Acad. Sci. U. S. A 116 (10) (2019) 4538–4547. - PMC - PubMed