

Transcriptional activators in the early Drosophila embryo perform different kinetic roles
- PMID: 37080162
- PMCID: PMC10473017
- DOI: 10.1016/j.cels.2023.03.006
Transcriptional activators in the early Drosophila embryo perform different kinetic roles
Abstract
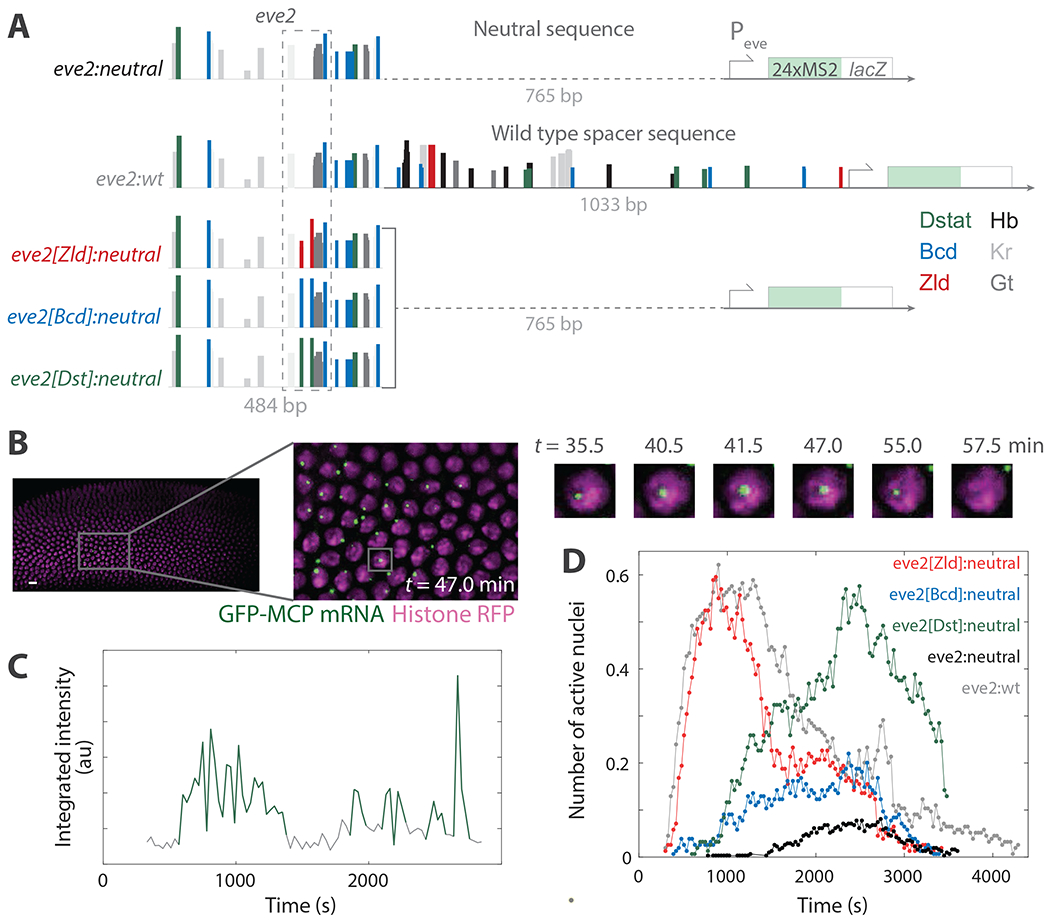
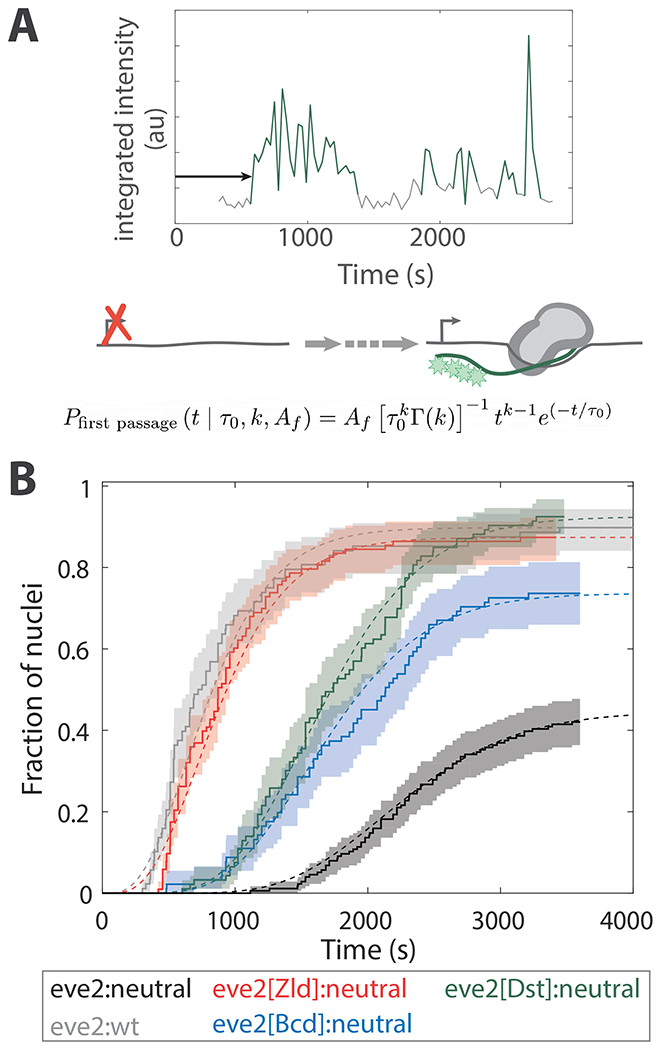
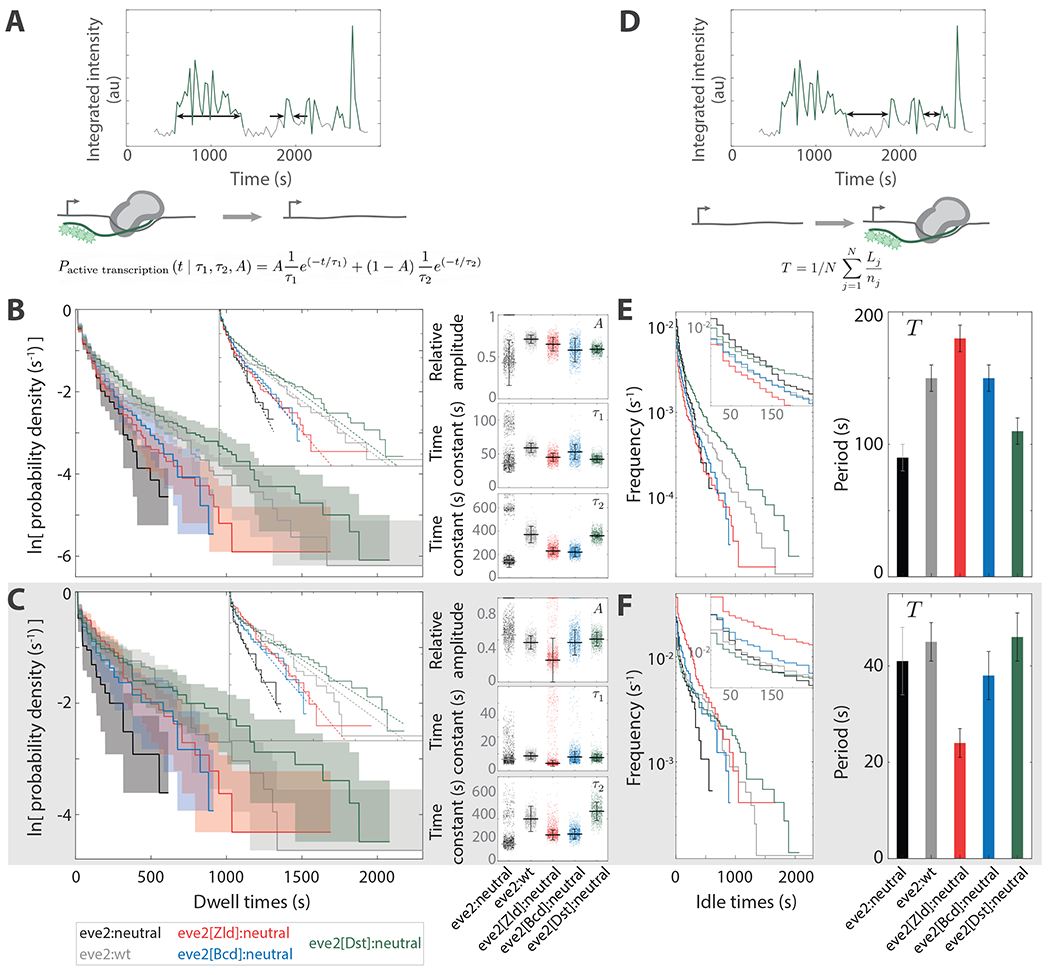
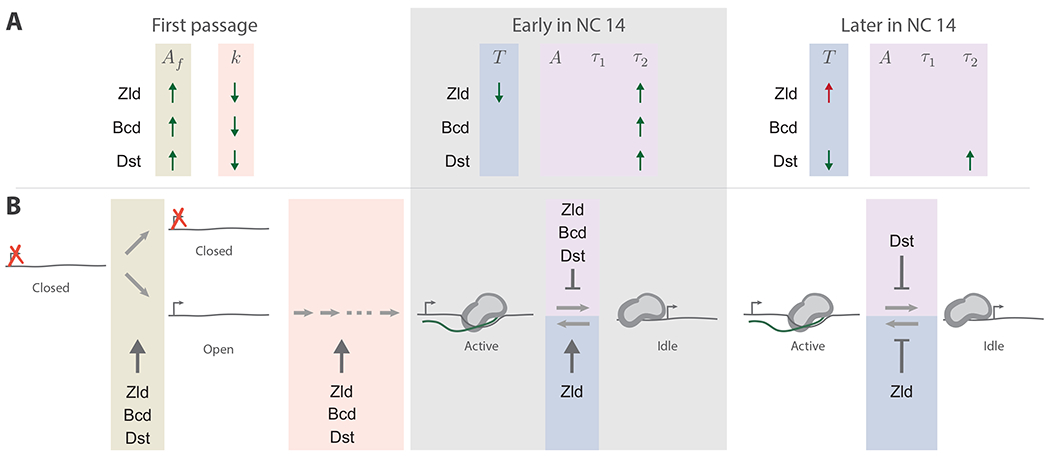
Combinatorial regulation of gene expression by transcription factors (TFs) may in part arise from kinetic synergy-wherein TFs regulate different steps in the transcription cycle. Kinetic synergy requires that TFs play distinguishable kinetic roles. Here, we used live imaging to determine the kinetic roles of three TFs that activate transcription in the Drosophila embryo-Zelda, Bicoid, and Stat92E-by introducing their binding sites into the even-skipped stripe 2 enhancer. These TFs influence different sets of kinetic parameters, and their influence can change over time. All three TFs increased the fraction of transcriptionally active nuclei; Zelda also shortened the first-passage time into transcription and regulated the interval between transcription events. Stat92E also increased the lifetimes of active transcription. Different TFs can therefore play distinct kinetic roles in activating the transcription. This has consequences for understanding the composition and flexibility of regulatory DNA sequences and the biochemical function of TFs. A record of this paper's transparent peer review process is included in the supplemental information.
Keywords: D. melanogaster embryo; MS2/MCP live imaging; diSPIM; kinetic modeling; transcription factors; transcription regulation.
Copyright © 2023 The Authors. Published by Elsevier Inc. All rights reserved.
Conflict of interest statement
Declaration of interests A.H.D. is a member of the advisory board of Cell Systems.
Figures
Comment on
-
Transcriptional kinetic synergy: A complex landscape revealed by integrating modeling and synthetic biology.Cell Syst. 2023 Apr 19;14(4):324-339.e7. doi: 10.1016/j.cels.2023.02.003. Cell Syst. 2023. PMID: 37080164 Free PMC article.
Similar articles
-
Bulk-level maps of pioneer factor binding dynamics during the Drosophila maternal-to-zygotic transition.Development. 2025 Jul 1;152(13):dev204460. doi: 10.1242/dev.204460. Epub 2025 Jul 3. Development. 2025. PMID: 40512118 Free PMC article.
-
Stress-induced Cdk5 activity enhances cytoprotective basal autophagy in Drosophila melanogaster by phosphorylating acinus at serine437.Elife. 2017 Dec 11;6:e30760. doi: 10.7554/eLife.30760. Elife. 2017. PMID: 29227247 Free PMC article.
-
Promoter strength delimits enhancer threshold in the early Drosophila embryo.Int J Dev Biol. 2025 Jun 13;69(2):81-90. doi: 10.1387/ijdb.240230jh. Int J Dev Biol. 2025. PMID: 40521685
-
Enhancer-promoter communication in Drosophila developmental gene transcription.Int J Dev Biol. 2024;68(4):169-188. doi: 10.1387/ijdb.230218gh. Int J Dev Biol. 2024. PMID: 38869221 Review.
-
Factors that influence parents' and informal caregivers' views and practices regarding routine childhood vaccination: a qualitative evidence synthesis.Cochrane Database Syst Rev. 2021 Oct 27;10(10):CD013265. doi: 10.1002/14651858.CD013265.pub2. Cochrane Database Syst Rev. 2021. PMID: 34706066 Free PMC article.
Cited by
-
Transcriptional kinetic synergy: A complex landscape revealed by integrating modeling and synthetic biology.Cell Syst. 2023 Apr 19;14(4):324-339.e7. doi: 10.1016/j.cels.2023.02.003. Cell Syst. 2023. PMID: 37080164 Free PMC article.
-
Emergence of activation or repression in transcriptional control under a fixed molecular context.bioRxiv [Preprint]. 2024 Jun 2:2024.05.29.596388. doi: 10.1101/2024.05.29.596388. bioRxiv. 2024. PMID: 38854049 Free PMC article. Preprint.
-
Minimal synthetic enhancers reveal control of the probability of transcriptional engagement and its timing by a morphogen gradient.Cell Syst. 2023 Mar 15;14(3):220-236.e3. doi: 10.1016/j.cels.2022.12.008. Epub 2023 Jan 24. Cell Syst. 2023. PMID: 36696901 Free PMC article.
-
Conservation of symmetry breaking at the level of chromatin accessibility between fly species with unrelated anterior determinants.bioRxiv [Preprint]. 2025 May 9:2025.01.13.632851. doi: 10.1101/2025.01.13.632851. bioRxiv. 2025. PMID: 39868093 Free PMC article. Preprint.
-
Comparative cofactor screens show the influence of transactivation domains and core promoters on the mechanisms of transcription.Nat Genet. 2024 Jun;56(6):1181-1192. doi: 10.1038/s41588-024-01749-z. Epub 2024 May 20. Nat Genet. 2024. PMID: 38769457
References
-
- Stampfel G, Kazmar T, Frank O, Wienerroither S, Reiter F, and Stark A (2015). Transcriptional regulators form diverse groups with context-dependent regulatory functions. Nature 528, 147–151. - PubMed
-
- Herschlag D, and Johnson FB (1993). Synergism in transcriptional activation: a kinetic view. Genes Dev. 7, 173–179. - PubMed
-
- Johnson AD (1995). The Price of Repression Minireview. Cell 81, 655–658. - PubMed
-
- Workman JL, and Buchman AR (1993). Multiple functions of nucleosomes and regulatory factors in transcription. Trends Biochem. Sci 18, 90–95. - PubMed
Publication types
MeSH terms
Substances
Grants and funding
LinkOut - more resources
Full Text Sources
Molecular Biology Databases
Miscellaneous
