. 2023 May 4;30(5):689-705.e4.
doi: 10.1016/j.stem.2023.03.016. Epub 2023 Apr 19.

Exercise reprograms the inflammatory landscape of multiple stem cell compartments during mammalian aging

Affiliations

Exercise reprograms the inflammatory landscape of multiple stem cell compartments during mammalian aging

Ling Liu et al. Cell Stem Cell. .

Abstract

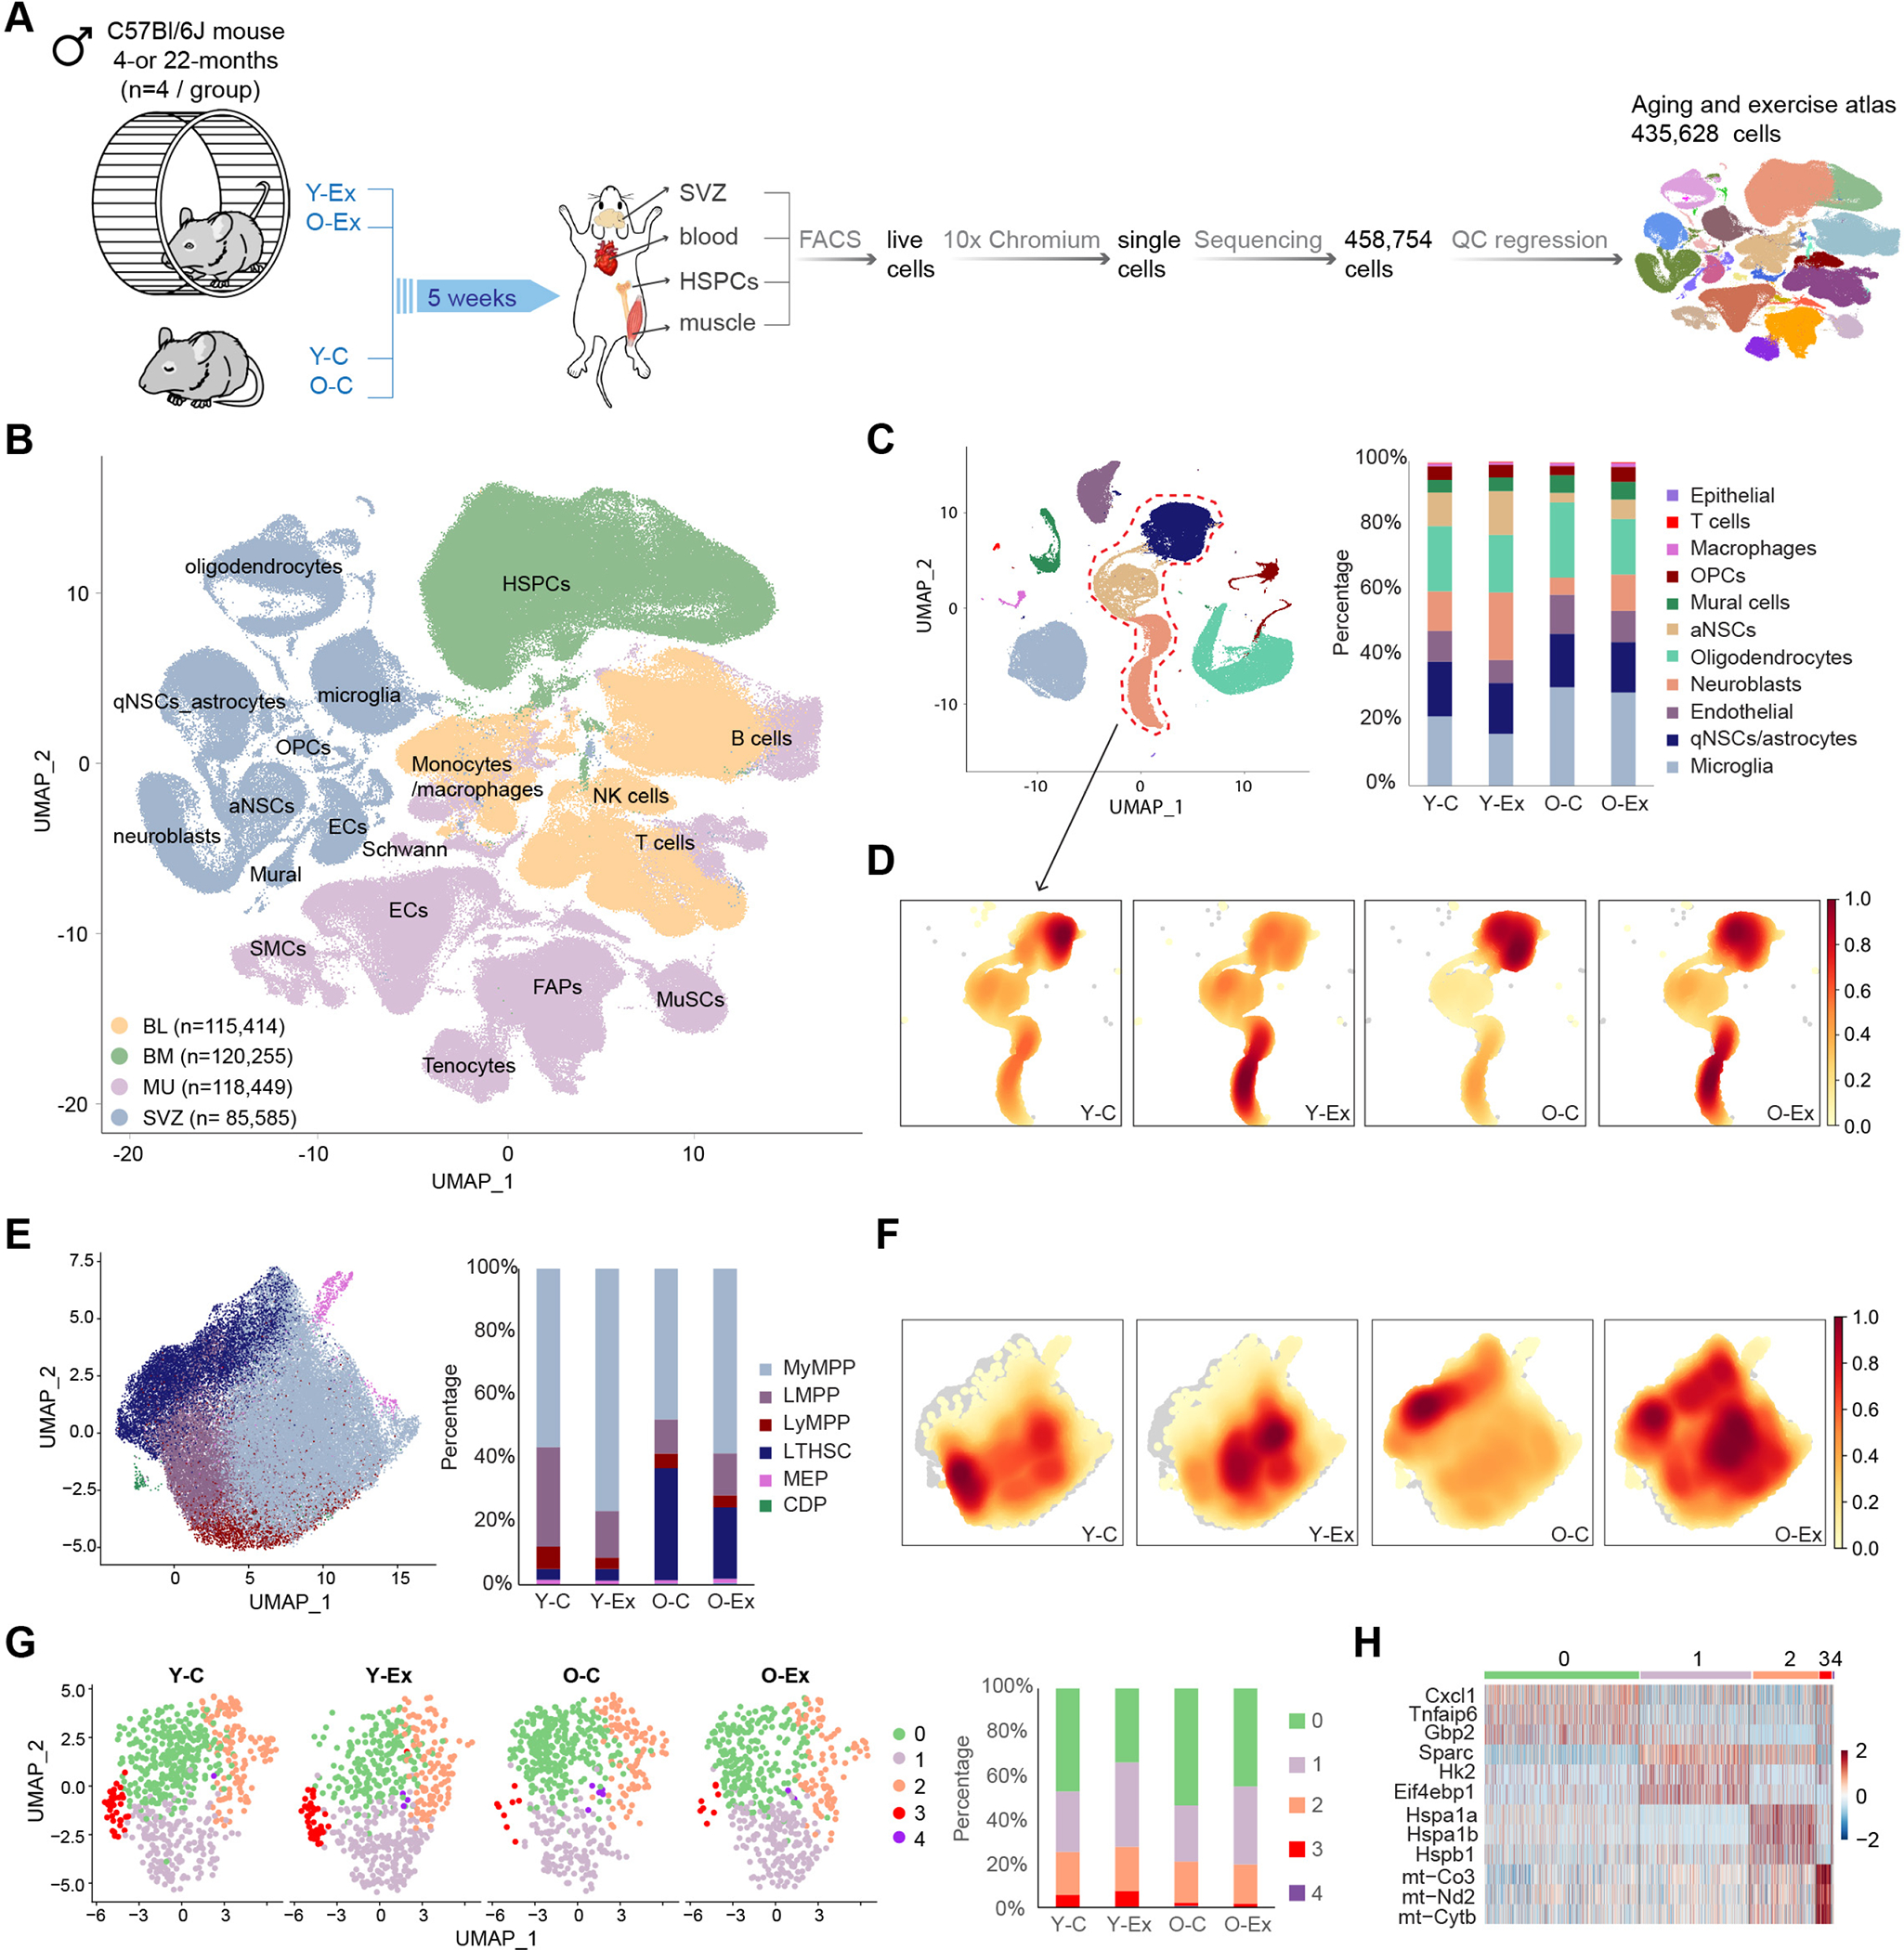
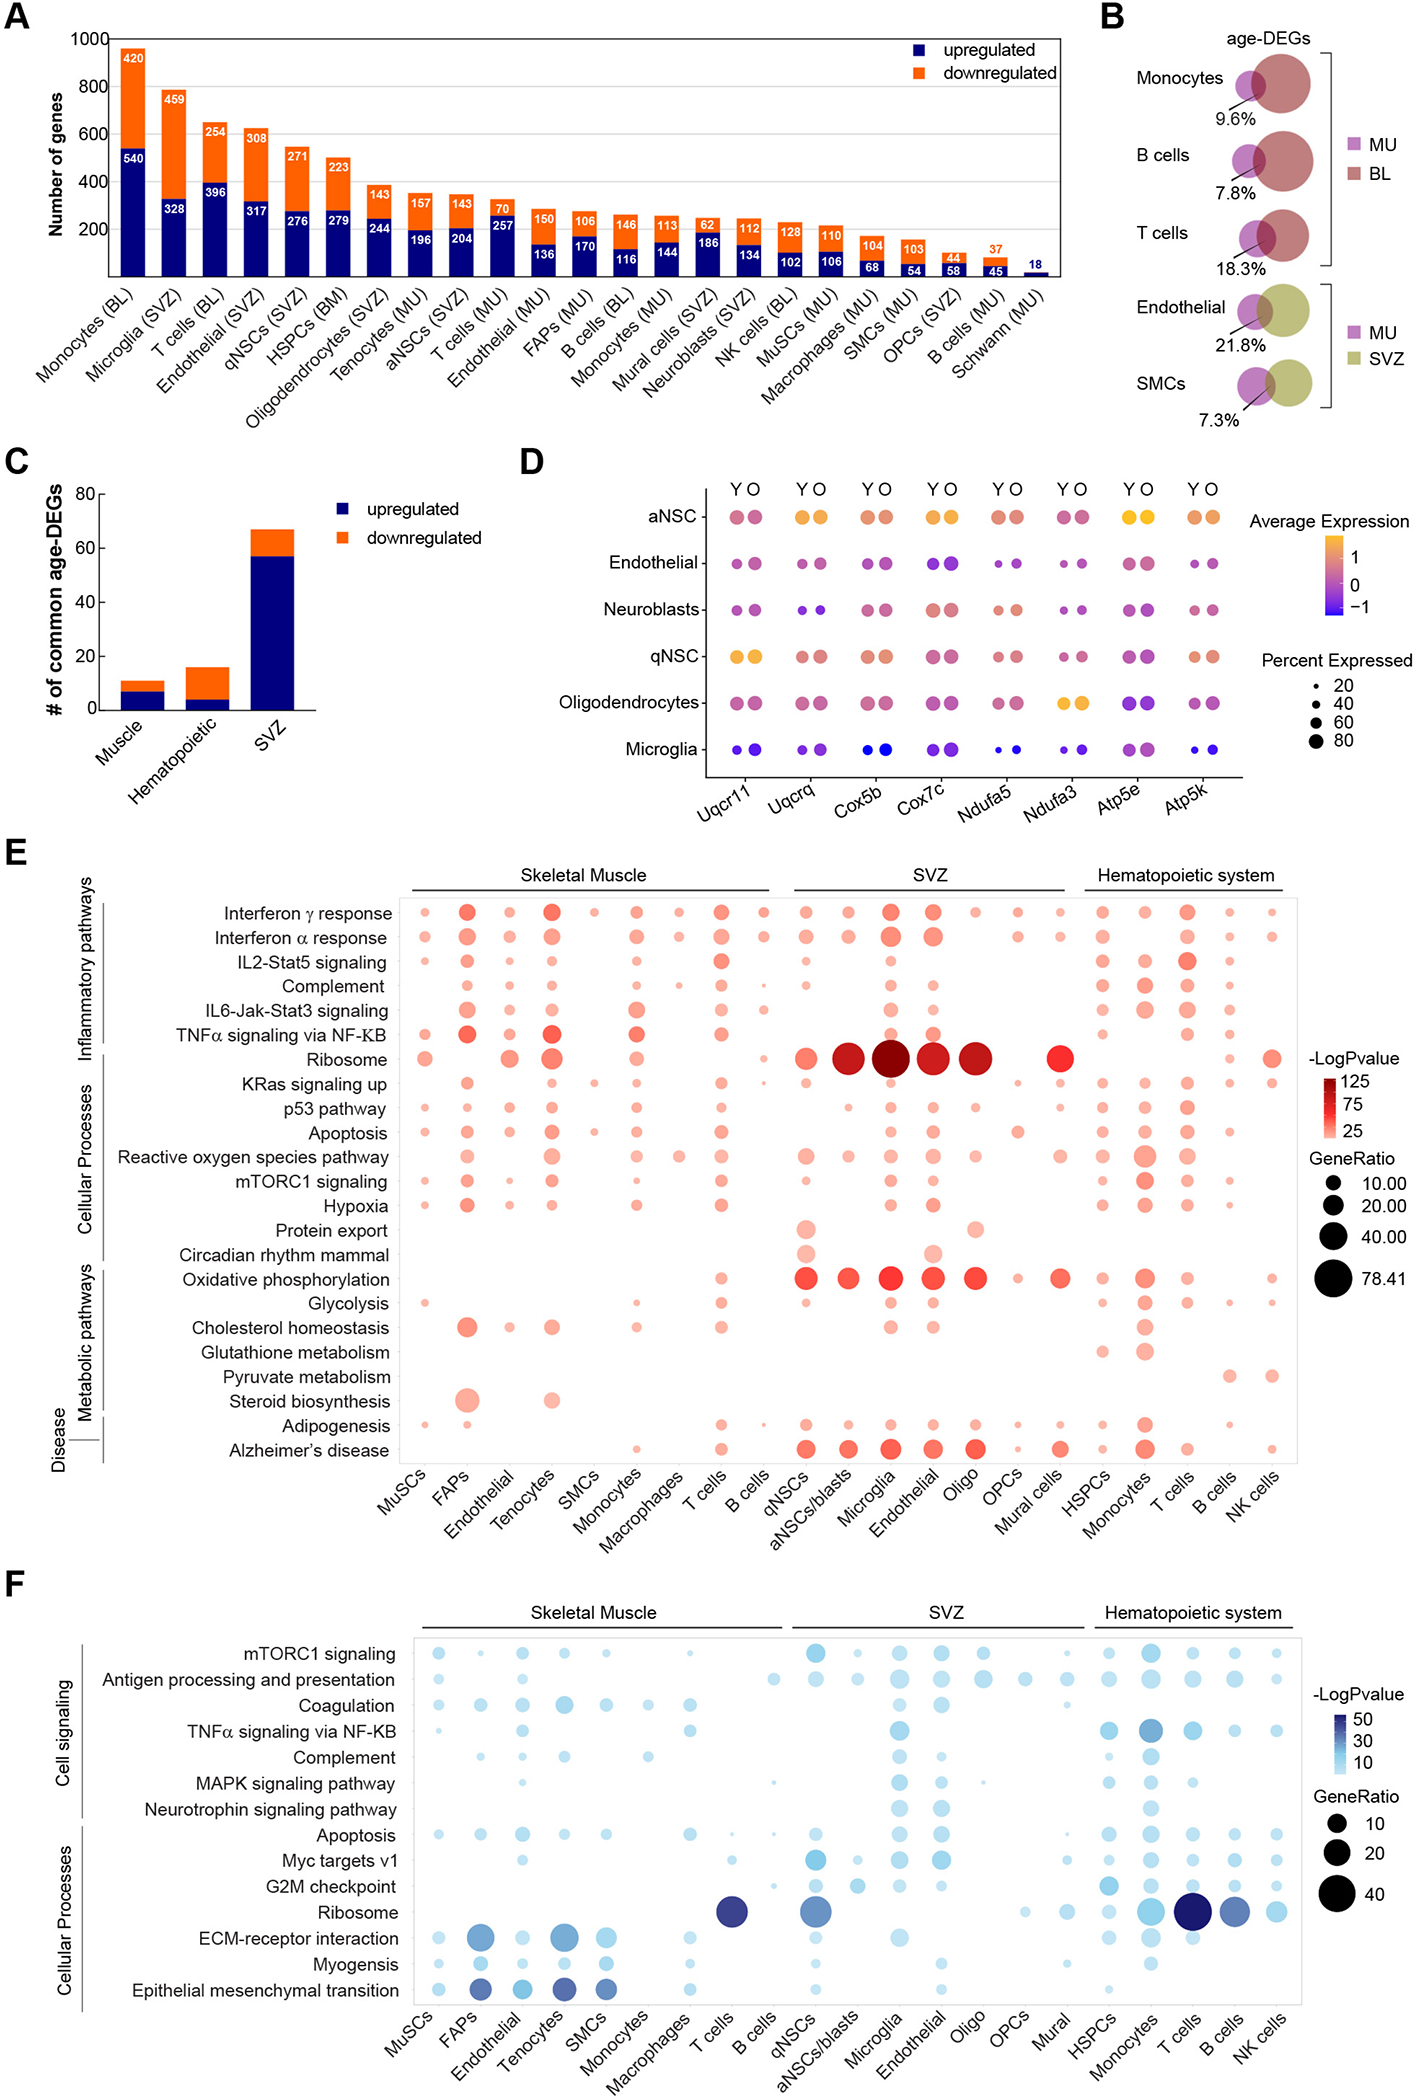
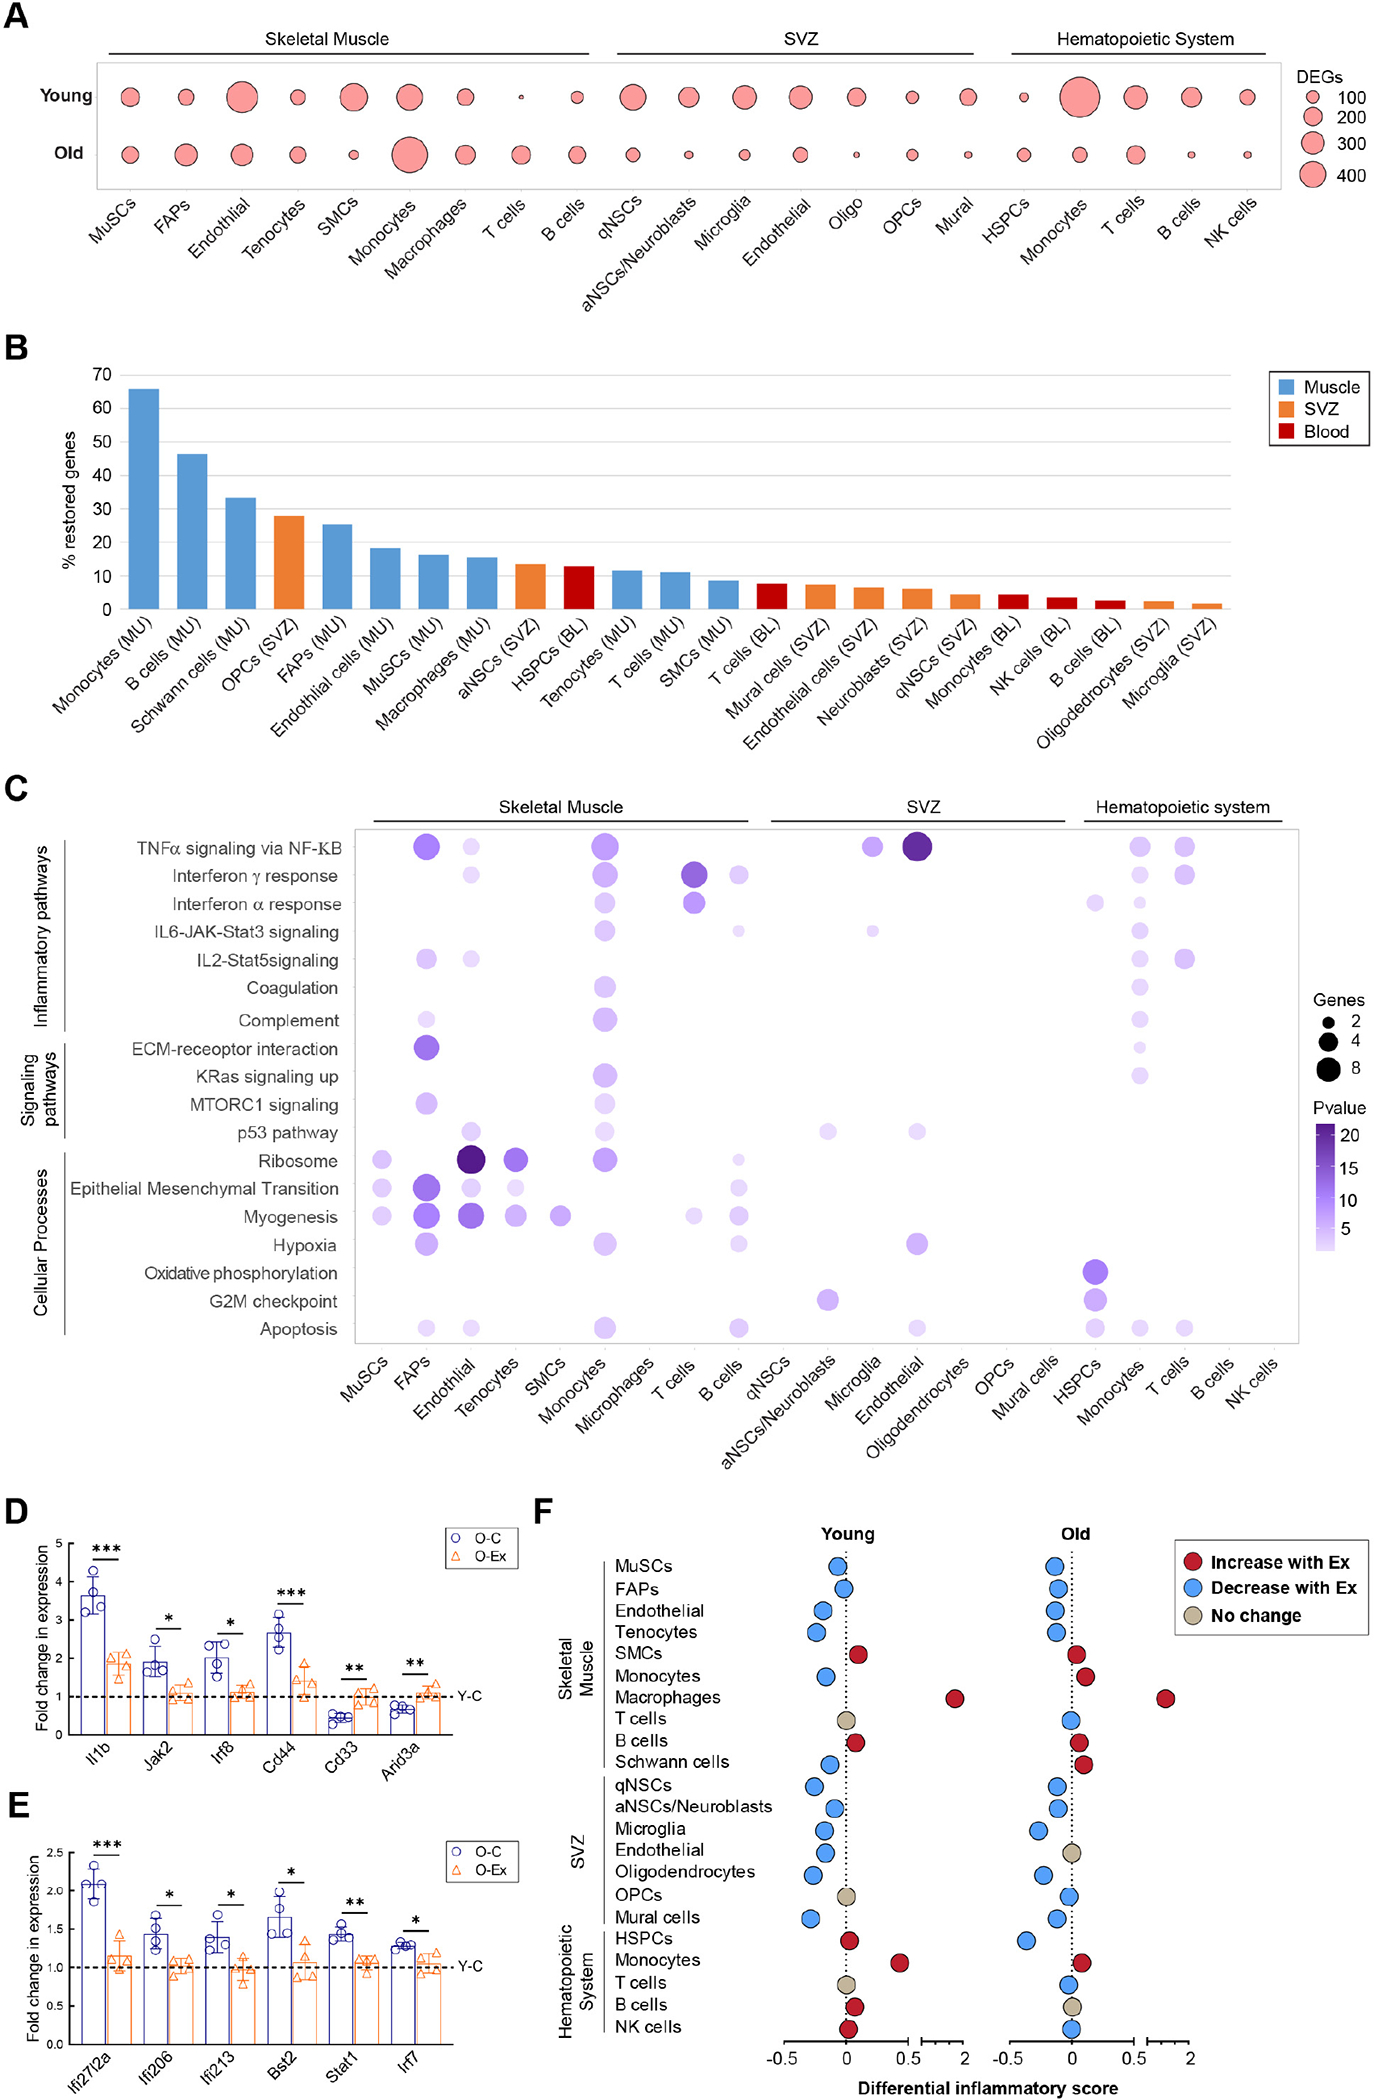
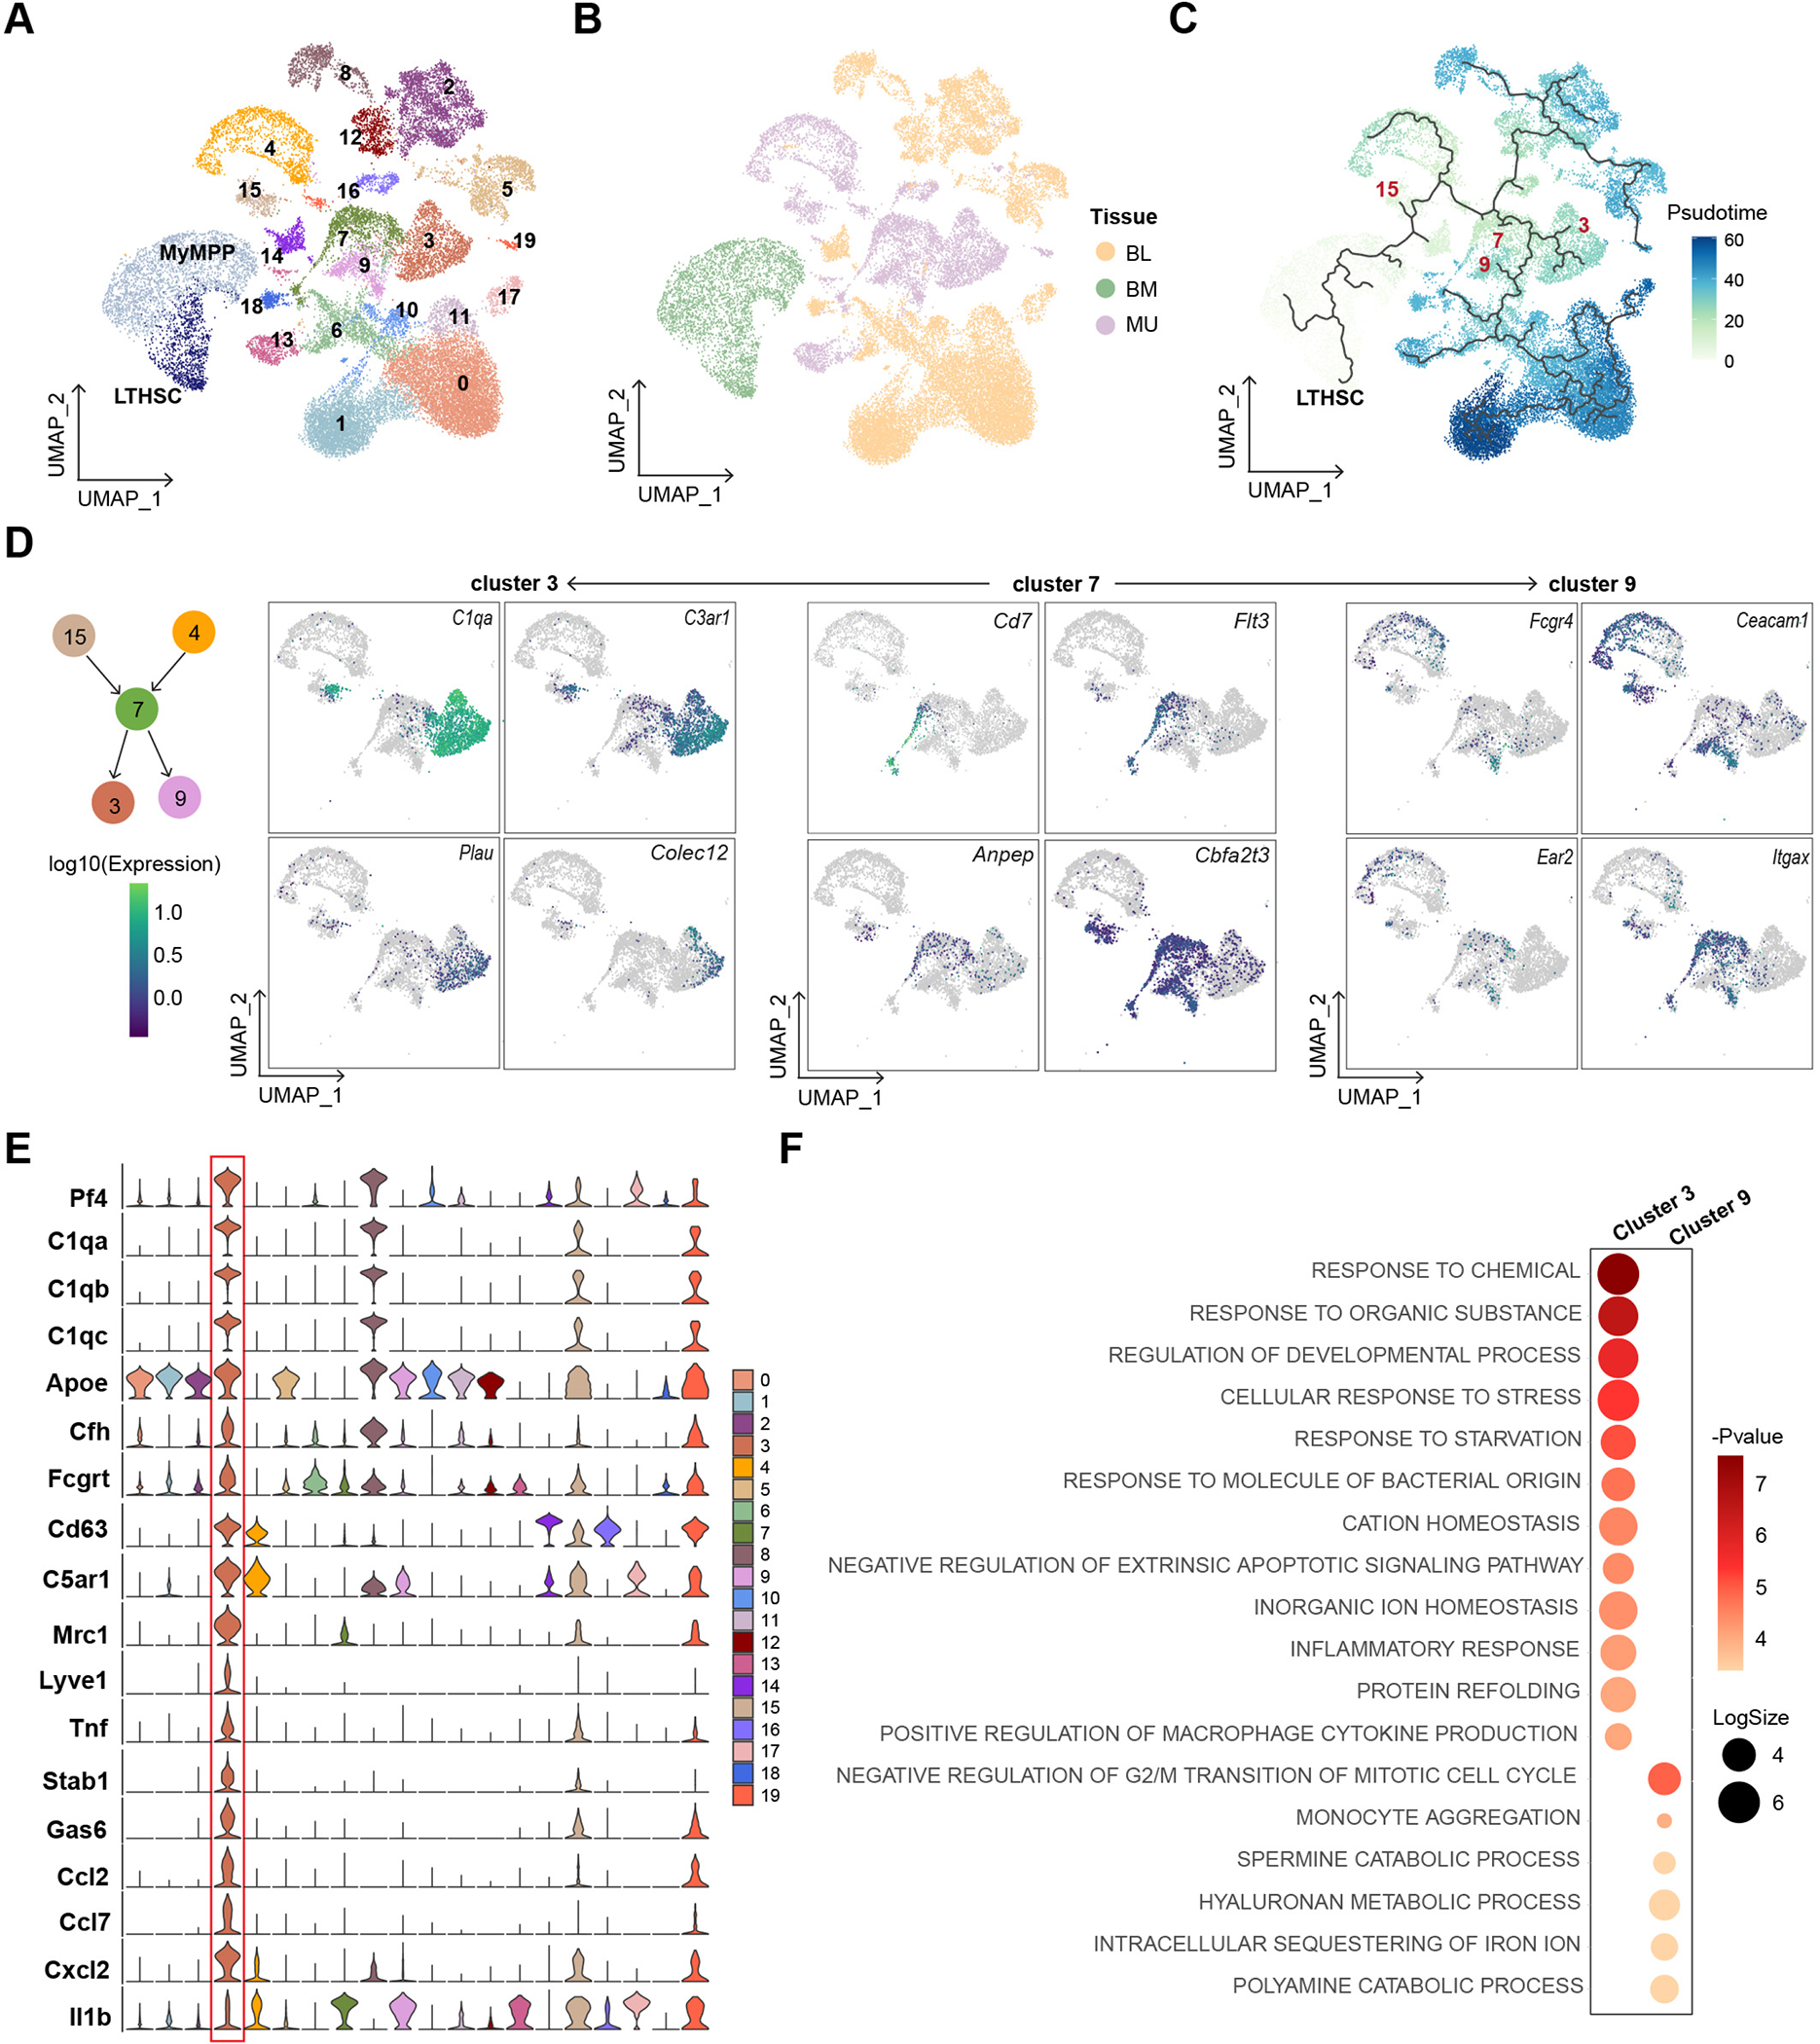
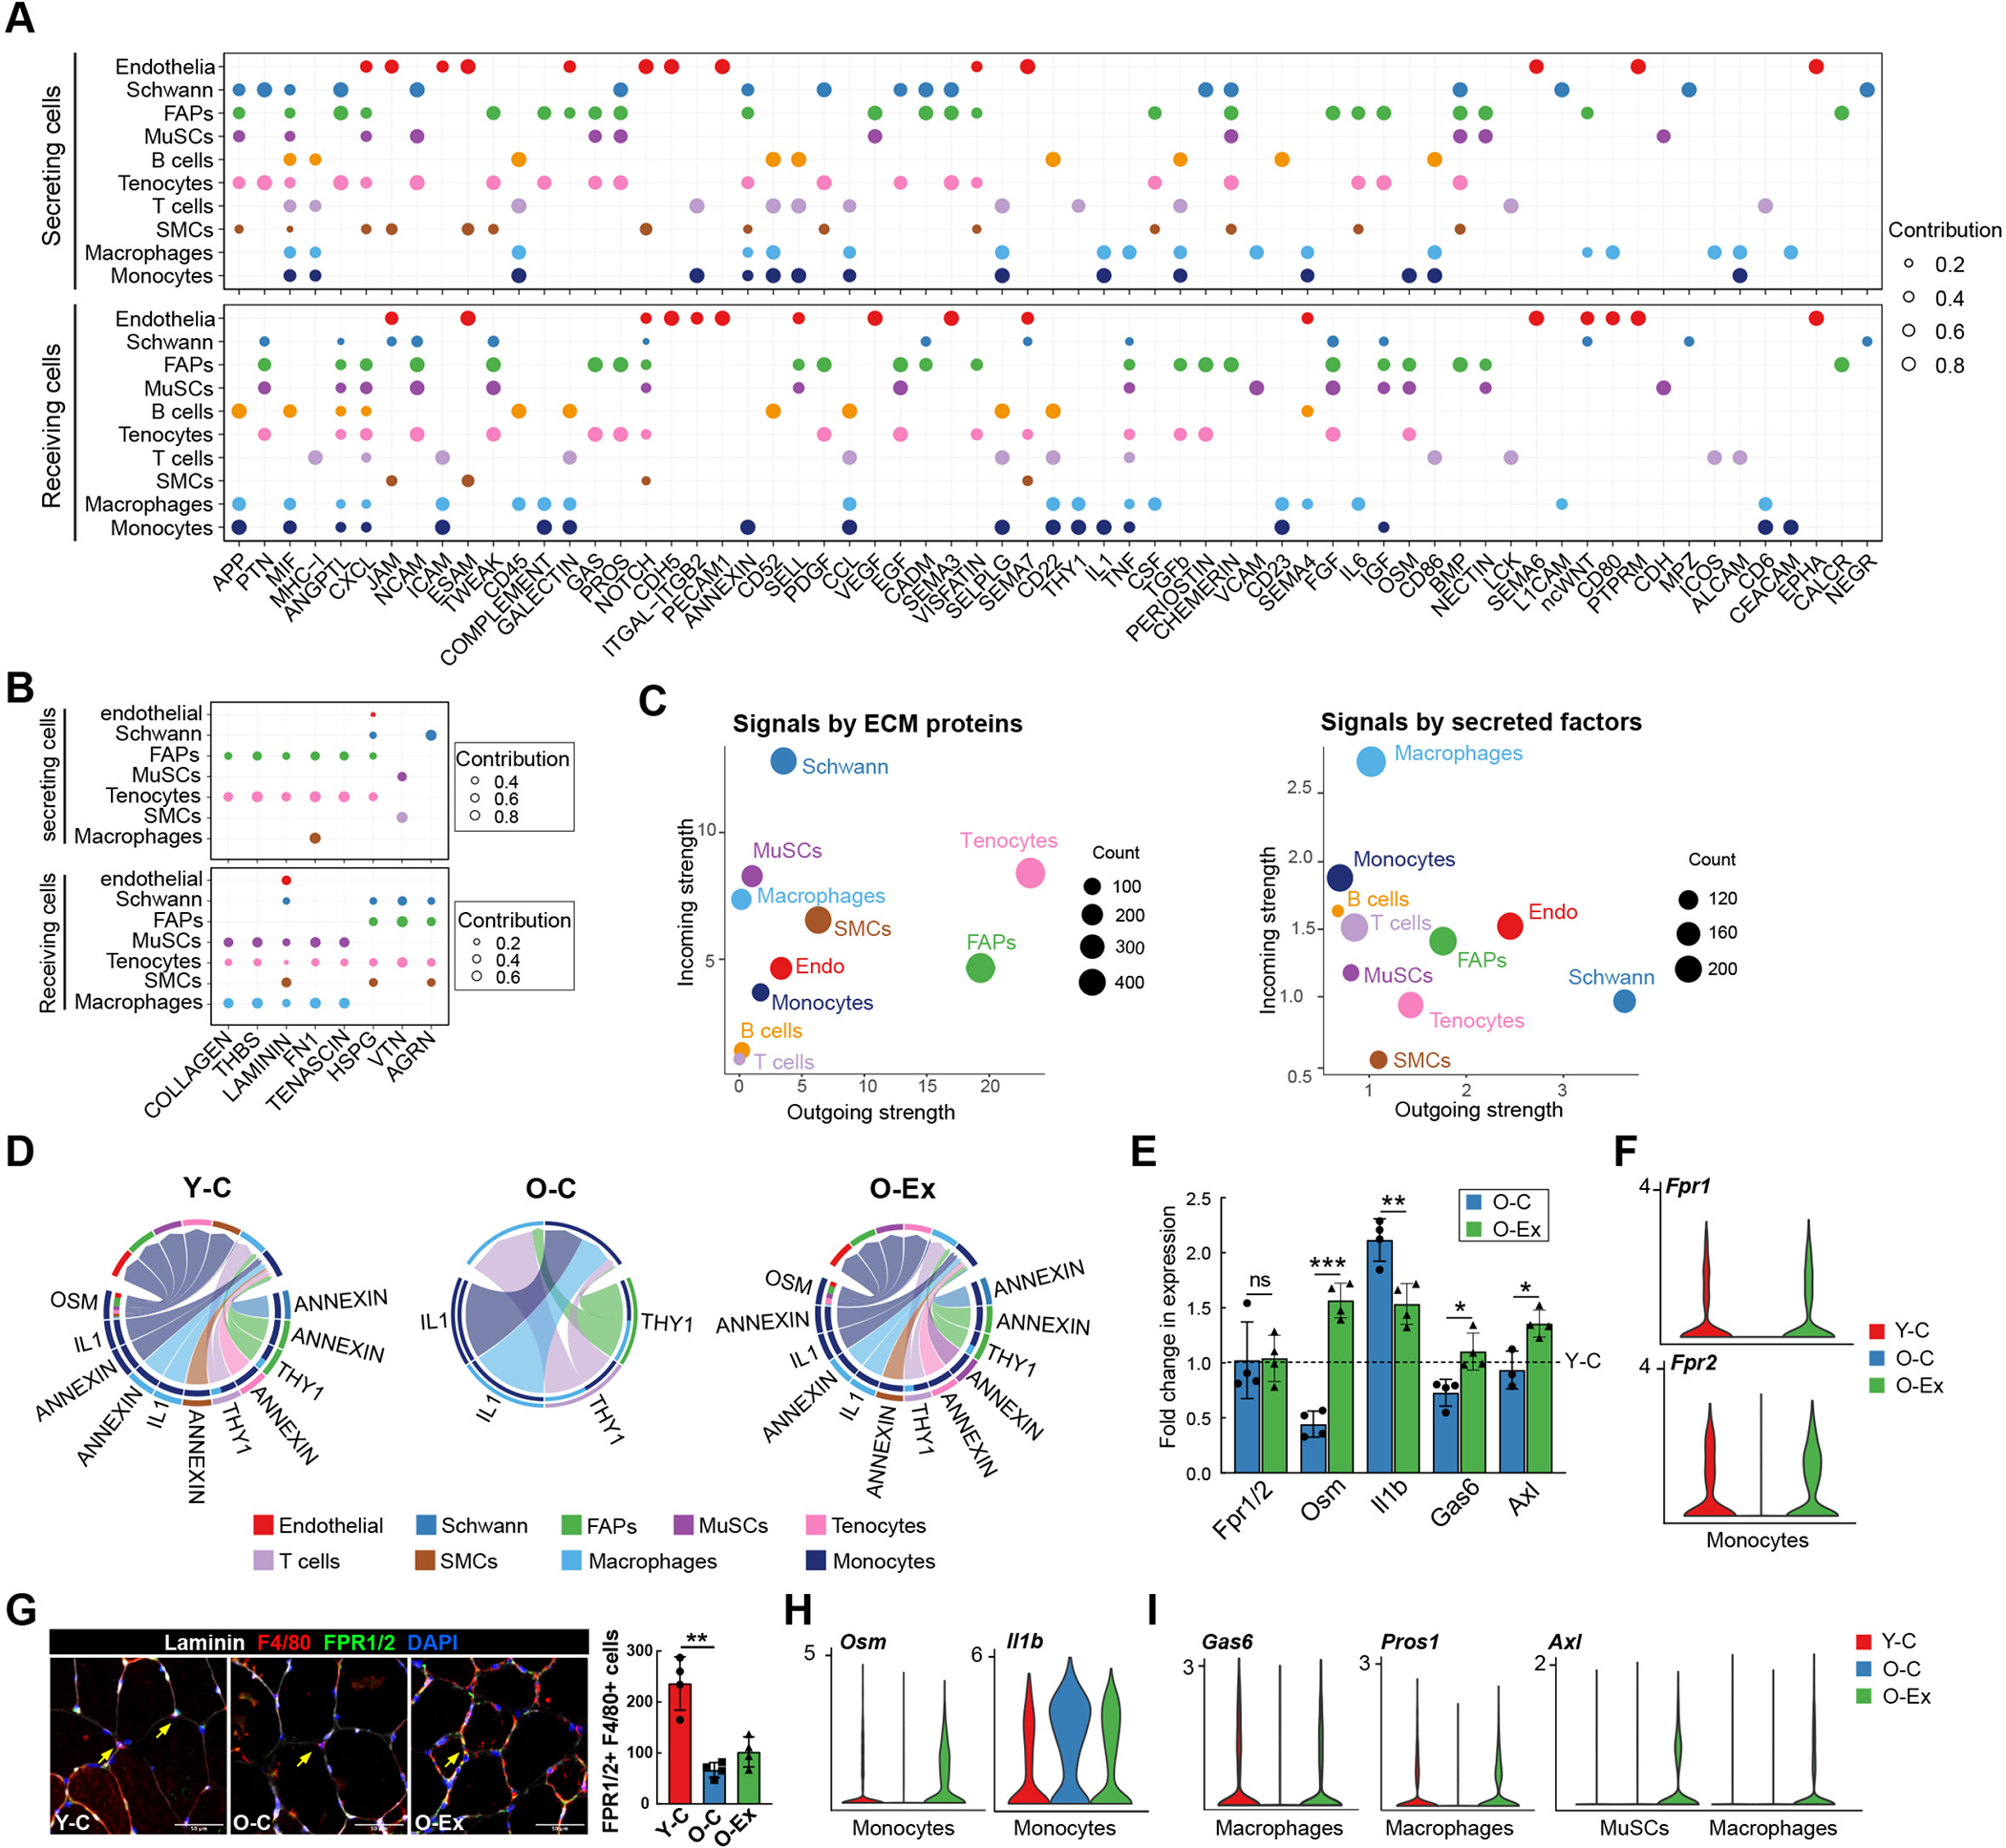
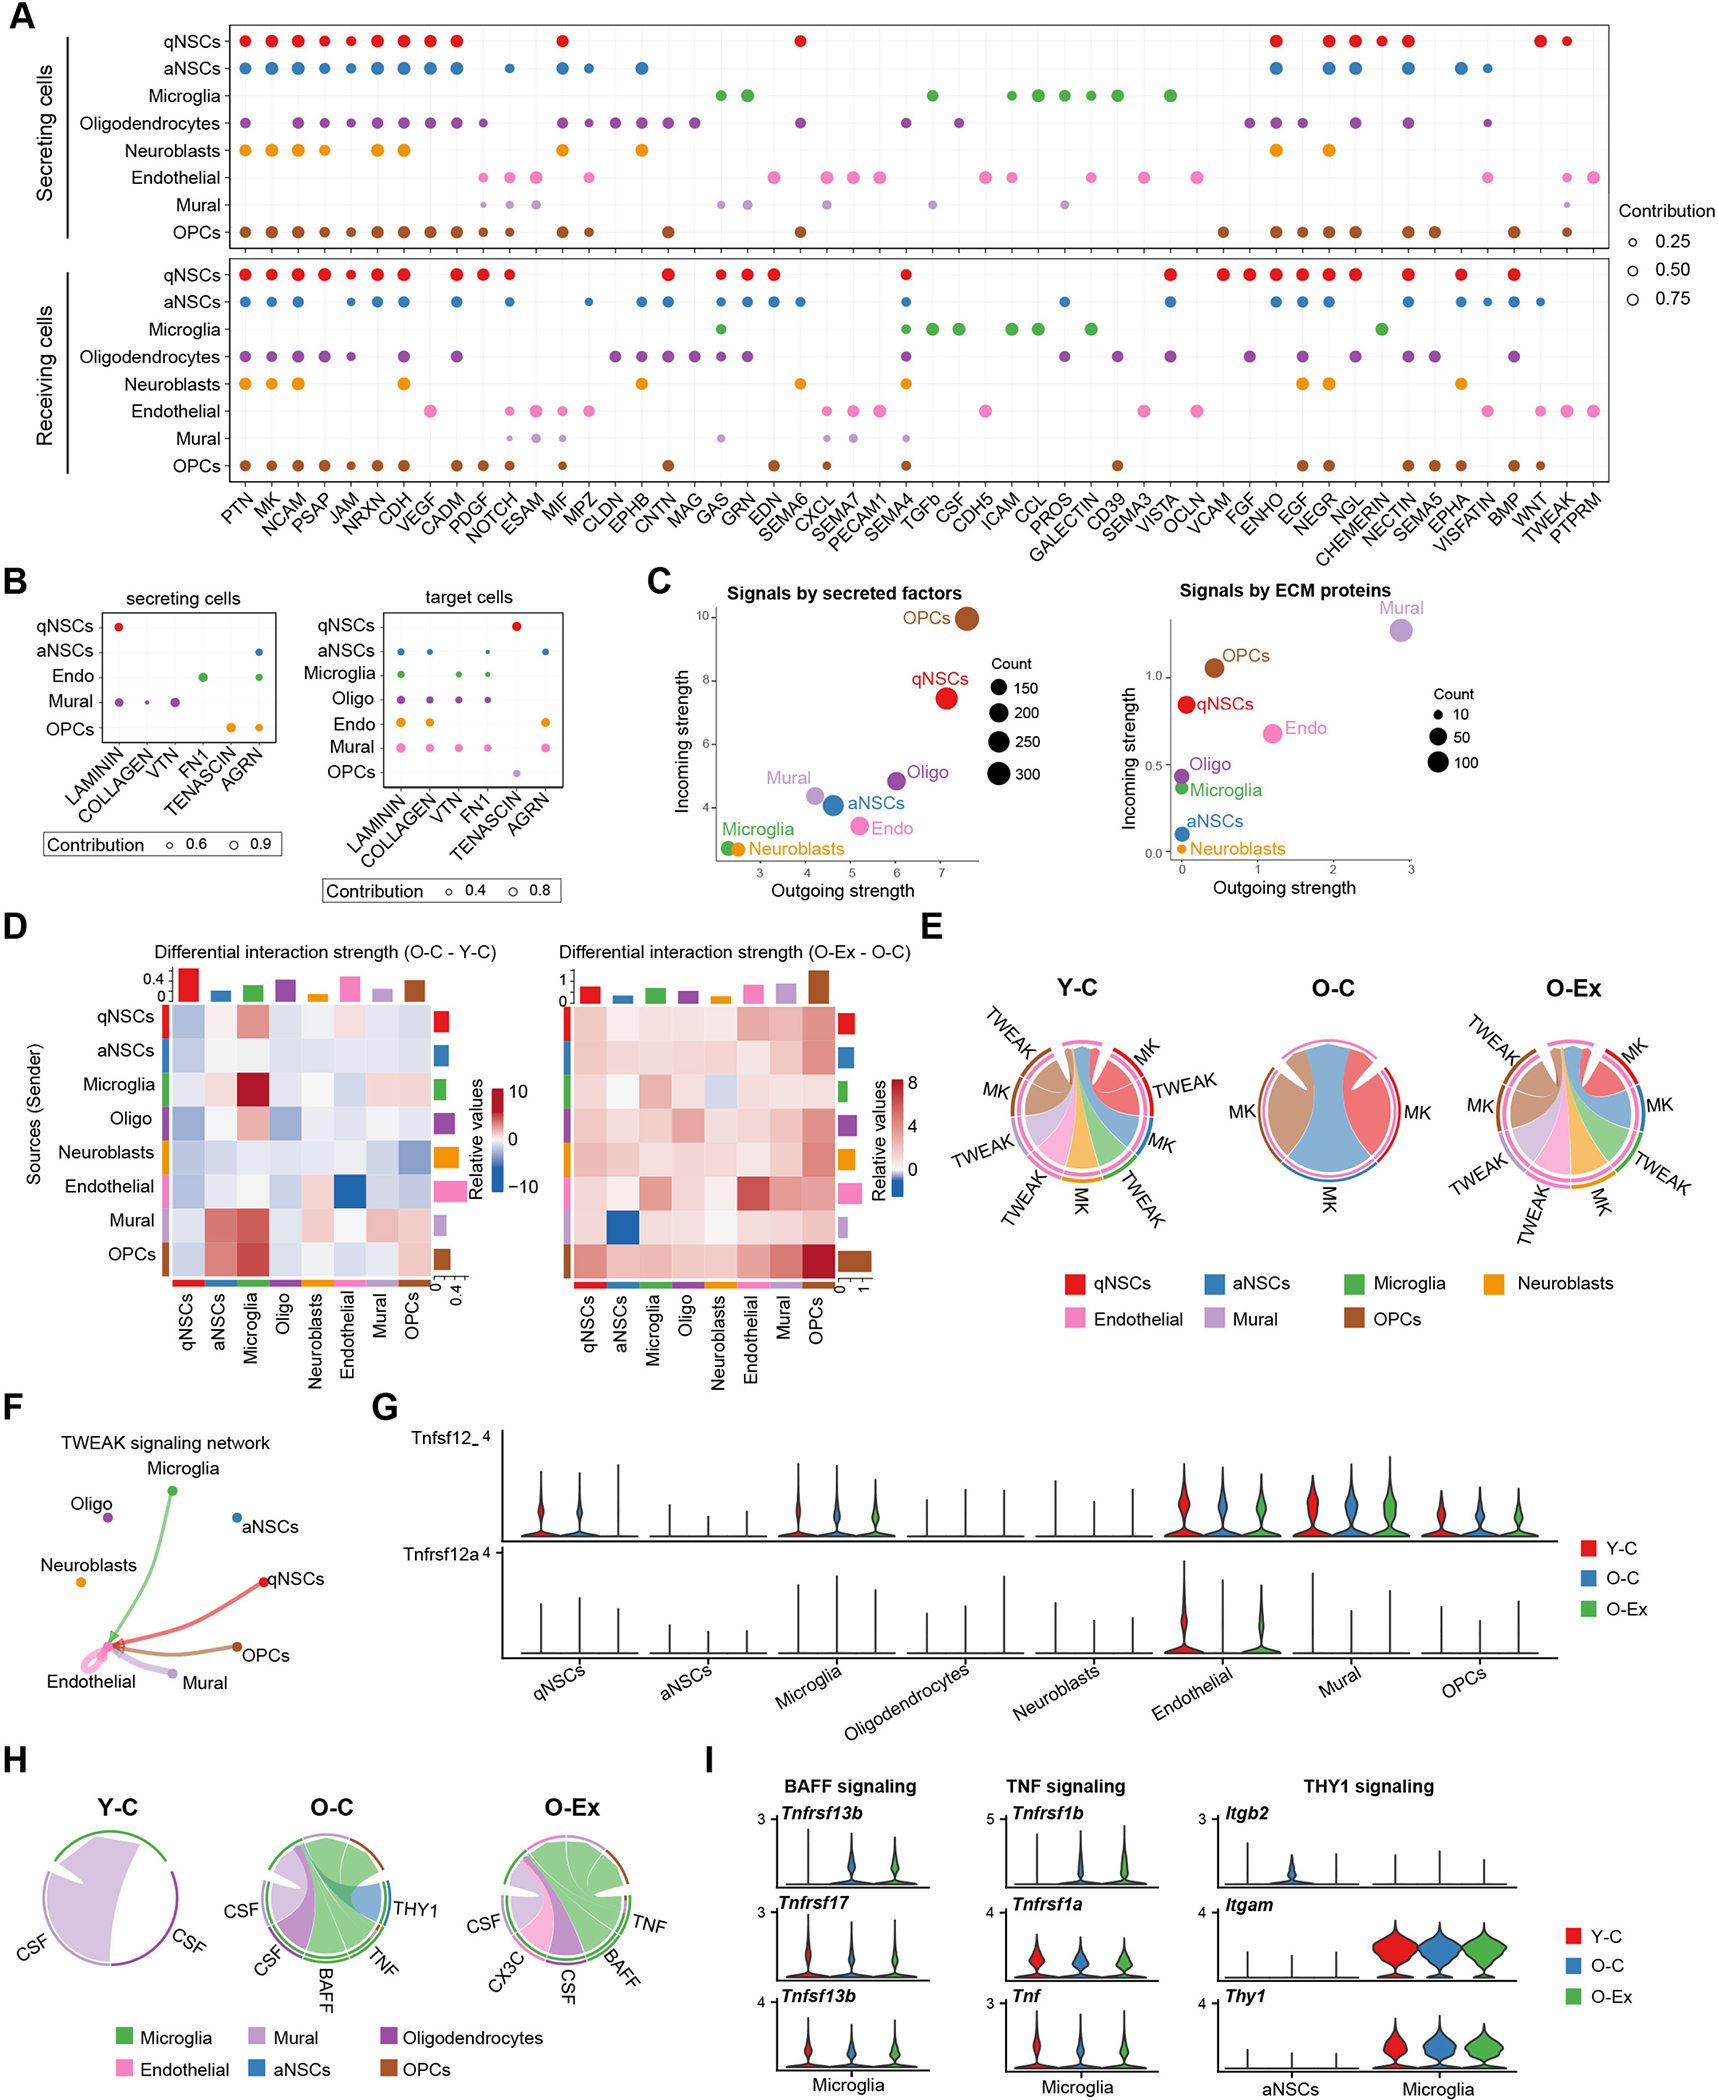
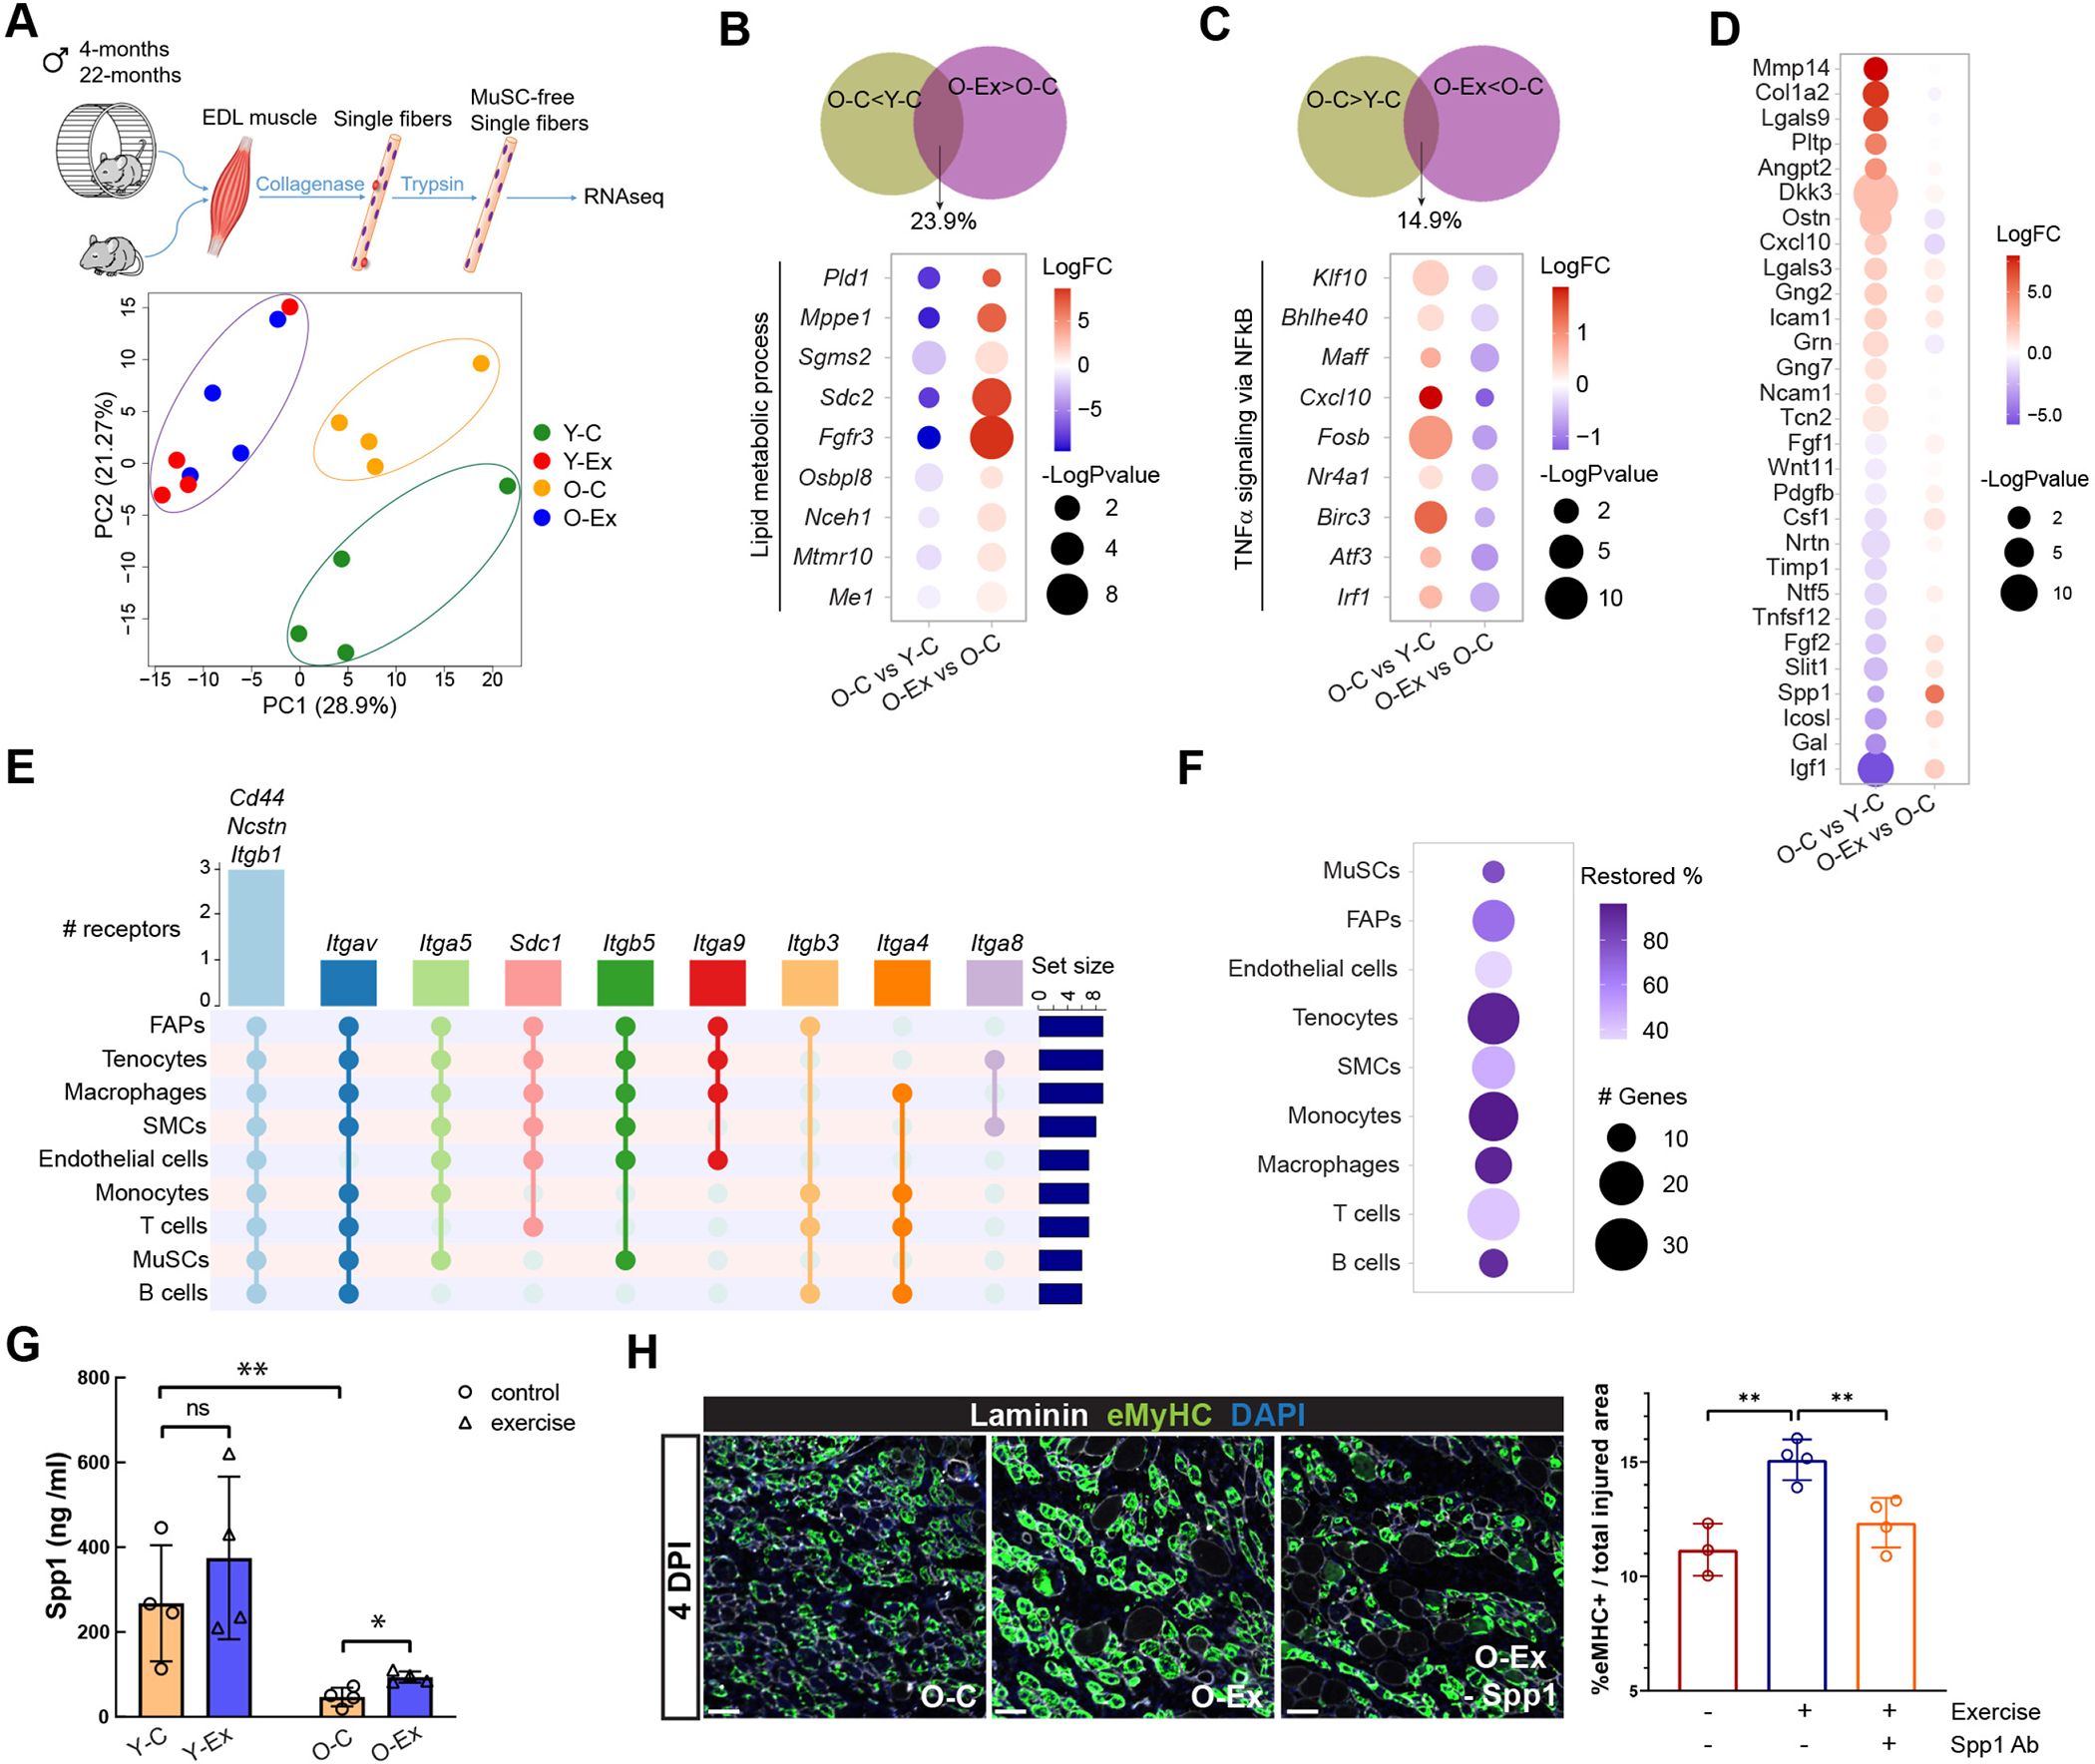
Exercise has the ability to rejuvenate stem cells and improve tissue regeneration in aging animals. However, the cellular and molecular changes elicited by exercise have not been systematically studied across a broad range of cell types in stem cell compartments. We subjected young and old mice to aerobic exercise and generated a single-cell transcriptomic atlas of muscle, neural, and hematopoietic stem cells with their niche cells and progeny, complemented by whole transcriptome analysis of single myofibers. We found that exercise ameliorated the upregulation of a number of inflammatory pathways associated with old age and restored aspects of intercellular communication mediated by immune cells within these stem cell compartments. Exercise has a profound impact on the composition and transcriptomic landscape of circulating and tissue-resident immune cells. Our study provides a comprehensive view of the coordinated responses of multiple aged stem cells and niche cells to exercise at the transcriptomic level.

Keywords: aging; exercise; hematopoietic stem cells; inflammation; muscle stem cells; myofibers; neural stem cells; scRNA-seq; skeletal muscle; subventricular zone.


Conflict of interest statement

Declaration of interests J.C.W. is a co-founder of Greenstone Biosciences but has no competing interests as the work presented was performed independently.

Figures

Figure 1:
Figure 1:. Changes in three stem cell compartments in response to aging and exercise revealed by scRNA-seq.
(A) Schematic diagram of the multi-tissue scRNA-seq experimental design. Y-C: young control mice; O-C: old control mice; Y-Ex: young exercised mice; O-Ex: old exercised mice; SVZ: subventricular zone; HSPCs: hematopoietic stem and progenitor cells, FACS: fluorescence-activated cell sorting. (B) UMAP of the multi-tissue exercise single cell atlas. Cell clusters are colored by the tissue type. The total number of cells in each tissue is indicated in the legend. BL: blood; BM: bone marrow; MU: muscle; ECs: endothelial cells; FAPs: fibro-adipogenic progenitors; OPCs: oligodendrocyte progenitor cells; MuSCs: muscle stem cells; aNSCs: activated neural stem cells; qNSCs: quiescent neural stem cells; SMCs: smooth muscle cells. (C) UMAP of cell types in the SVZ. Fraction of each cell type is shown on the right. Neural stem and progenitor cell clusters are circled and used in the density calculation presented in (D). (D) Cell density plots of the qNSCs, aNSCs and neuroblasts in control or exercised young and old mice. The color scale represents cell density normalized to a scale of 0 to 1 where 0 indicates an absence of cells and 1 represents the highest cell density. (E) UMAP of the HSPCs. Fraction of each cell type is shown on the right. MyMPP: myeloid multipotent progenitor; LMPP: lymphoid-primed multipotent progenitors; LyMPP: lymphoid multipotent progenitor; LT-HSC: long-term hematopoietic stem cell; MEP: megakaryocyte/erythroid progenitor; CDP: common dendritic cell progenitor. (F) Cell density plots of the HSPC compartment in control or exercised young and old mice. (G) UMAP of subclusters in MuSCs. Fraction of each cluster is shown on the right. (H) Heatmap of marker genes for the MuSC clusters.
Figure 2:
Figure 2:. Effect of aging on the transcriptome of stem cells and niches cells.
(A) Summary of the number of upregulated and downregulated age-DEGs in major cell clusters in all 3 tissues. Cell types are ranked by the total number of age-DEGs. (B) Venn diagrams demonstrating the percentage of common age-DEGs in specific cell types from different tissues. The size of the circles is proportional to the number of age-DEGs. (C) The number of common age-DEGs in the 3 stem cell compartments. (D) Dot plot demonstrating the expression of selected genes encoding enzymes involved in oxidative phosphorylation in SVZ cells from young and old animals. (E) Dot plot summarizing common biological pathways enriched among upregulated age-DEGs in major cell types of muscle, the SVZ, and the hematopoietic system. (F) Dot plot summarizing common biological pathways enriched among downregulated age-DEGs in major cell types of muscle, the SVZ, and the hematopoietic system.
Figure 3:
Figure 3:. Reversal of age-induced gene expression changes by exercise.
(A) Dot plot summarizing the number of Ex-DEGs in major cell types of muscle, the SVZ, and the hematopoietic system. (B) Bar graph demonstrating the percentage of exercise-restored genes in major cell types of the three tissues. Cell types are ranked from the highest percentage to the lowest. (C) Dot plot summarizing the biological pathways enriched among exercise-restored genes. (D) Bar graph demonstrating the relative expression levels of genes implicated in the TNFα pathway in muscle monocytes from old control and old exercised mice determined by RT-qPCR. For each gene, the fold changes in expression in comparison to the level in young control animals (Y-C, indicated by the dotted line) were plotted. n=4 mice. Data are shown as mean ± SEM. *p < 0.05, **p<0.01, ***p < 0.001 (unpaired t tests). (E) Bar graph demonstrating the relative expression level of genes implicated in the IFNγ pathway in muscle T cells from old control and old exercised mice determined by RT-qPCR. For each gene, the fold changes in expression in comparison to the level in young control animals (Y-C, indicated by the dotted line) were plotted. (F) Summary of differential inflammatory score in response to exercise in various cell types from young and old mice.
Figure 4:
Figure 4:. Aging and exercise-induced changes in immune cells.
(A-C) UMAPs of HSCs, MyMPPs, and all monocytes/macrophages indicated by Louvain clusters, by tissues, and by Pseudotime trajectory, respectively, using HSCs as the root cell type, (D) UMAPs showing the expression pattern of specific genes in clusters 3, 7, and 9 monocytes/macrophage. (E) Violin plots showing the expression of monocyte/macrophage cluster 3 marker genes. (F) Dot plot summarizing the GO terms enriched among marker genes of clusters 3 and 9 of monocytes/macrophages.
Figure 5:
Figure 5:. Cell-cell communication in the MuSC niche.
(A) Dot plot summarizing the signal sending and receiving cells for each listed pathway mediated by secreted or cell surface molecules in skeletal muscle. The size of the dots is proportional to the contribution of a cell type to a specific pathway. (B) Dot plot summarizing the signal sending and receiving cells for each listed pathway mediated by ECM signaling in skeletal muscle. (C) Scatter plot showing the contribution of each cell type in the muscle to secreted/cell surface molecule-mediated communication (left) and to ECM-mediated communication (right). The size of the dots is proportional to the total number of incoming and outgoing signaling pathways associated with a cell type. (D) Chord plots showing cell-cell communication mediated by the ANNEXIN, OSM, IL1, and THY1 pathways in the muscle stem cell niche. The lower section of the circle represents signal sending cells and the top section of the circle represents signal receiving cells. At the lower section, the color bars at the outer circle represent signal sending cells, and those at the inner circle represent signal receiving cells. The arrows point to signal receiving cells. Note that ANNEXIN signaling and OSM signaling become undetectable with age but are restored by exercise. (E) Bar graph demonstrating the relative expression Fpr1, Osm, Il1b, Gas6, and Axl in muscle macrophages from O-C and O-Ex mice. For each gene, the fold changes in expression in comparison to the level in young control animals (Y-C, indicated by the dotted line) were plotted. n=4 mice. Data are shown as mean ± SEM. *p < 0.05, **p<0.01, ***p < 0.001 (unpaired t tests). (F) Violin plots showing the expression of Fpr1 and Fpr2 in muscle monocytes. (G) Representative images of muscle cross sections stained with Fpr1/2 antibodies. Monocytes/macrophages were co-stained with the F4/80 antibody and marked by the arrows. The number of total Fpr1/2 expressing monocytes/macrophages were quantified on the entire cross section and plotted in the bar graph shown on the right. n=4 mice. Data are shown as mean ± SEM. *p < 0.05, **p<0.01, ***p < 0.001 (unpaired t tests). (H) Violin plots showing the expression of Il1b and Osm in muscle monocytes. (I) Violin plots showing the expression pattern of Axl, Gas6, and Pros1 in MuSCs and muscle macrophages.
Figure 6:
Figure 6:. Cell-cell communication in the NSC niche.
(A) Dot plot summarizing the expression pattern of secreted and cell surface signaling molecules and their receptors in the SVZ. The size of the dots is proportional to the contribution of a cell type to a specific pathway. (B) Dot plot summarizing the signal sending and receiving cells for each listed pathway mediated by ECM signaling in the SVZ. (C) Scatter plot showing the contribution of each cell type in the SVZ to secreted/cell surface molecule-mediated communication (left) and to ECM-mediated communication (right). The size of the dots is proportional to the total number of incoming and outgoing signaling pathways associated with a cell type. (D) Heatmaps showing the differential overall signaling strength in the SVZ between Y-C and O-C (left) and between O-C and Y-Ex (right) mice. The top bars and right bars represent the sum of incoming and outgoing signaling strength of each cell type, respectively. On the left, red and blue represent higher and lower signaling strength in the O-C mice, respectively, in comparison to Y-C mice. On the right, red and blue represent lower and higher signaling strength in the O-C mice, respectively, in comparison to O-Ex mice. (E) Chord plots showing the TWEAK and MK signaling network in the SVZ. Note that TWEAK signaling disappears in O-C and recovers in O-Ex. The arrows point to signal receiving cells. (F) Circle plot demonstrating the TWEAK signaling network in the SVZ. The thickness of the lines represents signaling strength; the color of the lines represents the source of the signal and the arrows point toward signal receiving cells. (G) Violin plots showing the expression pattern of the TNFSF12 ligand and the TNFRSF12A receptor in SVZ cells. (H) Chord plots showing the CSF, BAFF, TNF, THY1, and CX3C signaling networks in SVZ cells. (I) Violin plots showing the expression pattern of the BAFF, TNF, and THY1 signaling components in microglia.
Figure 7:
Figure 7:. Aging- and exercise-induced changes in myofibers.
(A) Schematic diagram of the single fiber RNA-seq methodology (top) and PCA analysis of data from fibers from young and old mice with and without exercise (bottom). (B) Venn diagram demonstrating the percentage of downregulated age-DEGs that were restored in myofibers from O-Ex mice (top) and dot plot summarizing the changes in the expression of genes in the lipid metabolic process (bottom). (C) Venn diagram demonstrating the percentage of upregulated age-DEGs that were restored in myofibers from O-Ex mice (top) and dot plot summarizing the changes in the expression of genes in the TNFα signaling pathway (bottom). (D) Dot plot demonstrating the differential expression of age-DEGs encoding secreted or cell surface ligands in myofibers from O-C mice in comparison to Y-C (left) and to O-Ex mice (right). The color indicates fold change and the size indicates the significance of the change. Red indicates higher and lower expression in O-C on the left and right, respectively. (E) UpSet plot showing the predicted receptors for Spp1 in cell types in skeletal muscle. (F) Dot plot demonstrating the number of predicted SPP1 target genes whose expression changed in old mice and was restored in exercised old mice, and the percentage of these genes among all SPP1 target genes whose expression changed in old mice. (G) Bar graph showing the level of Spp1 in Y-C, Y-Ex, O-C, and O-Ex mice detected by ELISA. n=4 mice. Data are shown as mean ± SEM. *p < 0.05, **p<0.01, ***p < 0.001 (unpaired t tests). (H) Comparison of muscle regeneration in O-C, O-Ex, and O-Ex mice injected with a neutralizing Spp1 antibody (O-Ex – Spp1). Cross sections were collected from the TA muscles of these mice 4 days after injury. Newly regenerated myofibers were identified by an antibody specific to embryonic myosin heavy chain (eMyHC). Scale bars represent 50 μm. The eMyHC-positive area normalized by total injured area is plotted and shown on the right. n=4 mice. Data are shown as mean ± SEM. *p < 0.05, **p<0.01, ***p < 0.001 (unpaired t tests).

References

    1. Brunet A, Goodell MA, and Rando TA (2023). Ageing and rejuvenation of tissue stem cells and their niches. Nat Rev Mol Cell Biol 24, 45–62. 10.1038/s41580-022-00510-w. - DOI - PMC - PubMed
    1. Artegiani B, Lyubimova A, Muraro M, van Es JH, van Oudenaarden A, and Clevers H (2017). A Single-Cell RNA Sequencing Study Reveals Cellular and Molecular Dynamics of the Hippocampal Neurogenic Niche. Cell Rep 21, 3271–3284. 10.1016/j.celrep.2017.11.050. - DOI - PubMed
    1. Dulken BW, Buckley MT, Navarro Negredo P, Saligrama N, Cayrol R, Leeman DS, George BM, Boutet SC, Hebestreit K, Pluvinage JV, et al. (2019). Single-cell analysis reveals T cell infiltration in old neurogenic niches. Nature 571, 205–210. 10.1038/s41586-019-1362-5. - DOI - PMC - PubMed
    1. Ibrayeva A, Bay M, Pu E, Jorg DJ, Peng L, Jun H, Zhang N, Aaron D, Lin C, Resler G, et al. (2021). Early stem cell aging in the mature brain. Cell Stem Cell 28, 955–966 e957. 10.1016/j.stem.2021.03.018. - DOI - PMC - PubMed
    1. Kalamakis G, Brune D, Ravichandran S, Bolz J, Fan W, Ziebell F, Stiehl T, Catala-Martinez F, Kupke J, Zhao S, et al. (2019). Quiescence Modulates Stem Cell Maintenance and Regenerative Capacity in the Aging Brain. Cell 176, 1407–1419 e1414. 10.1016/j.cell.2019.01.040. - DOI - PubMed

Publication types