. 2023 May:357:655-668.
doi: 10.1016/j.jconrel.2023.04.028. Epub 2023 Apr 27.

Sustained release hydrogel for durable locoregional chemoimmunotherapy for BRAF-mutated melanoma

Affiliations

Sustained release hydrogel for durable locoregional chemoimmunotherapy for BRAF-mutated melanoma

Jihoon Kim et al. J Control Release. 2023 May.

Erratum in

Abstract

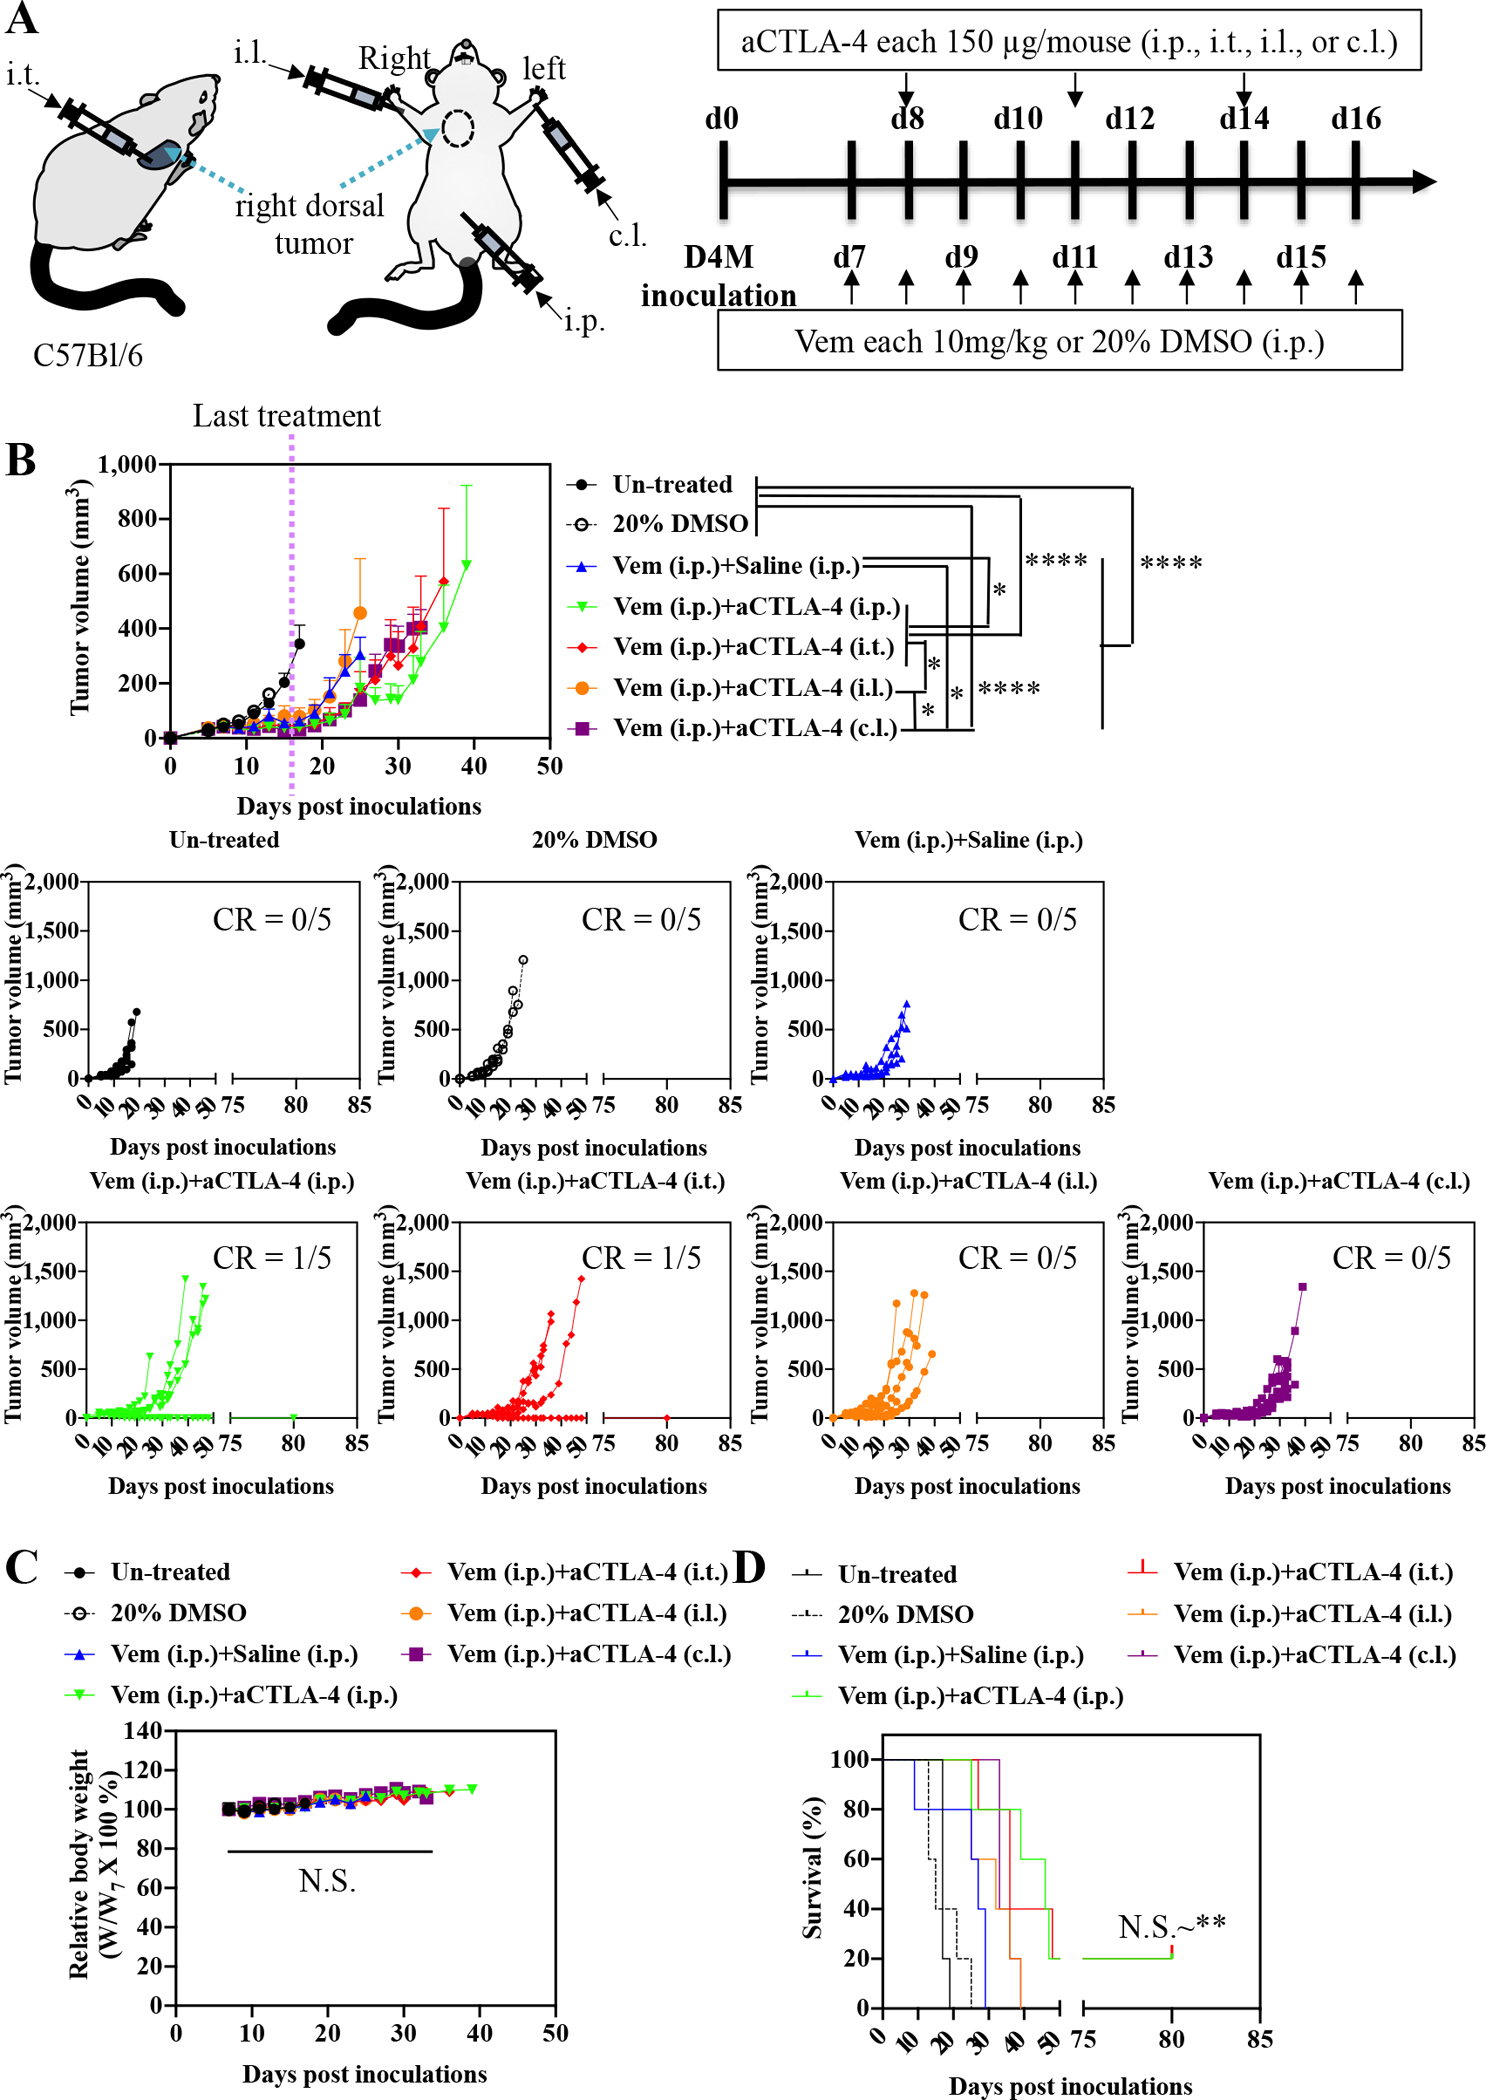
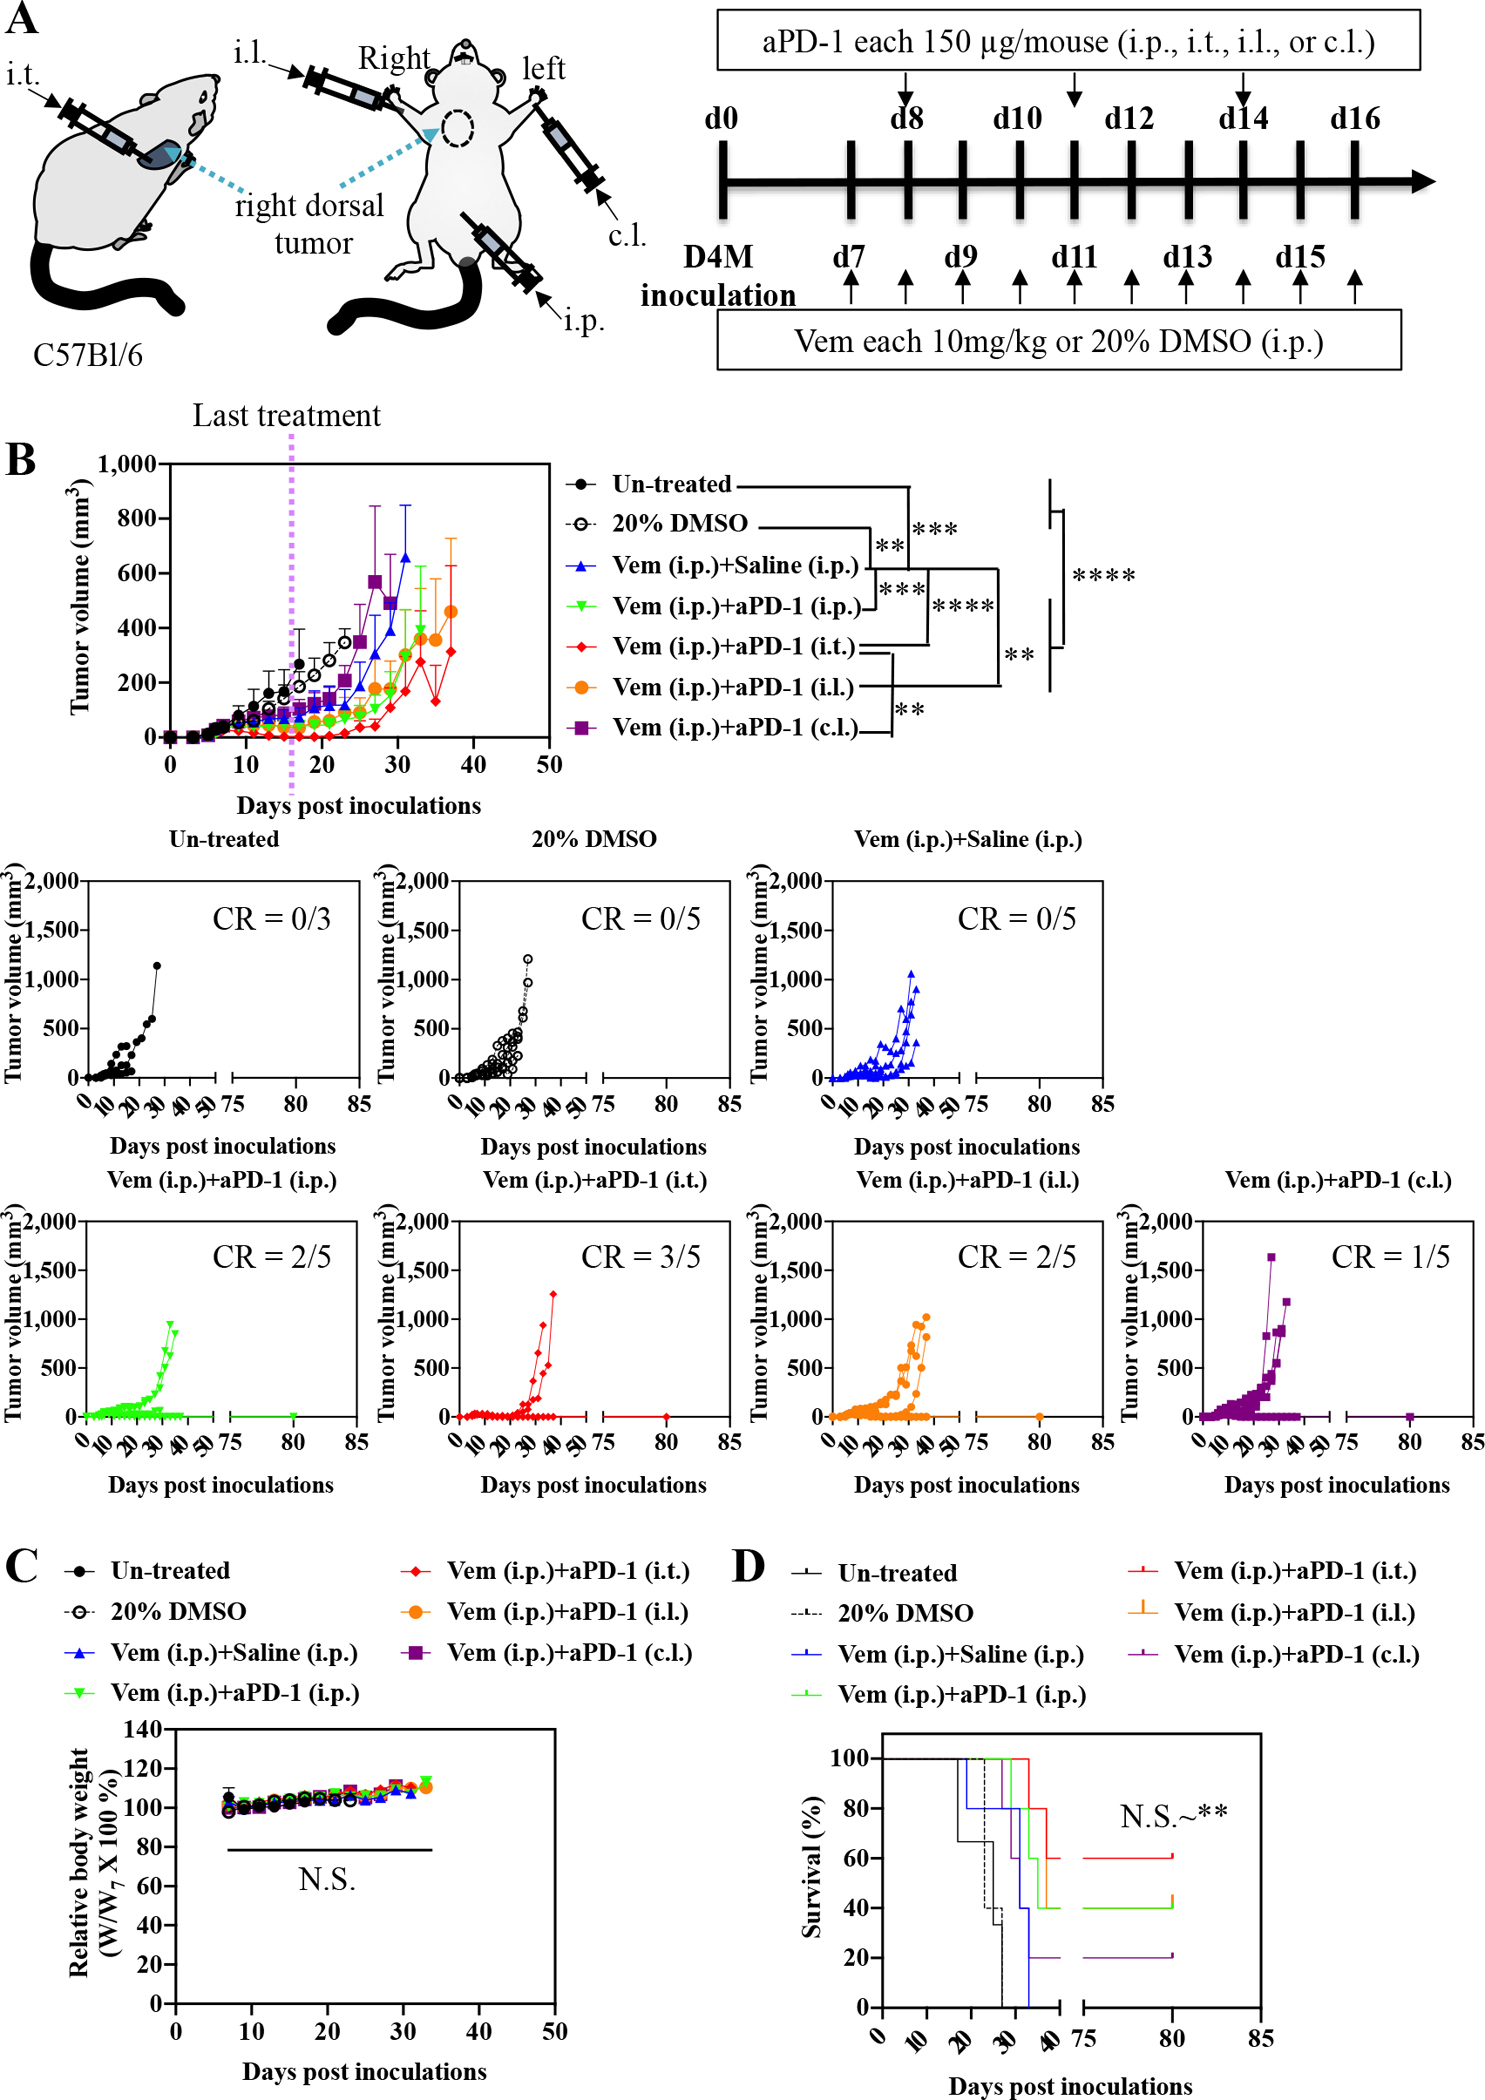
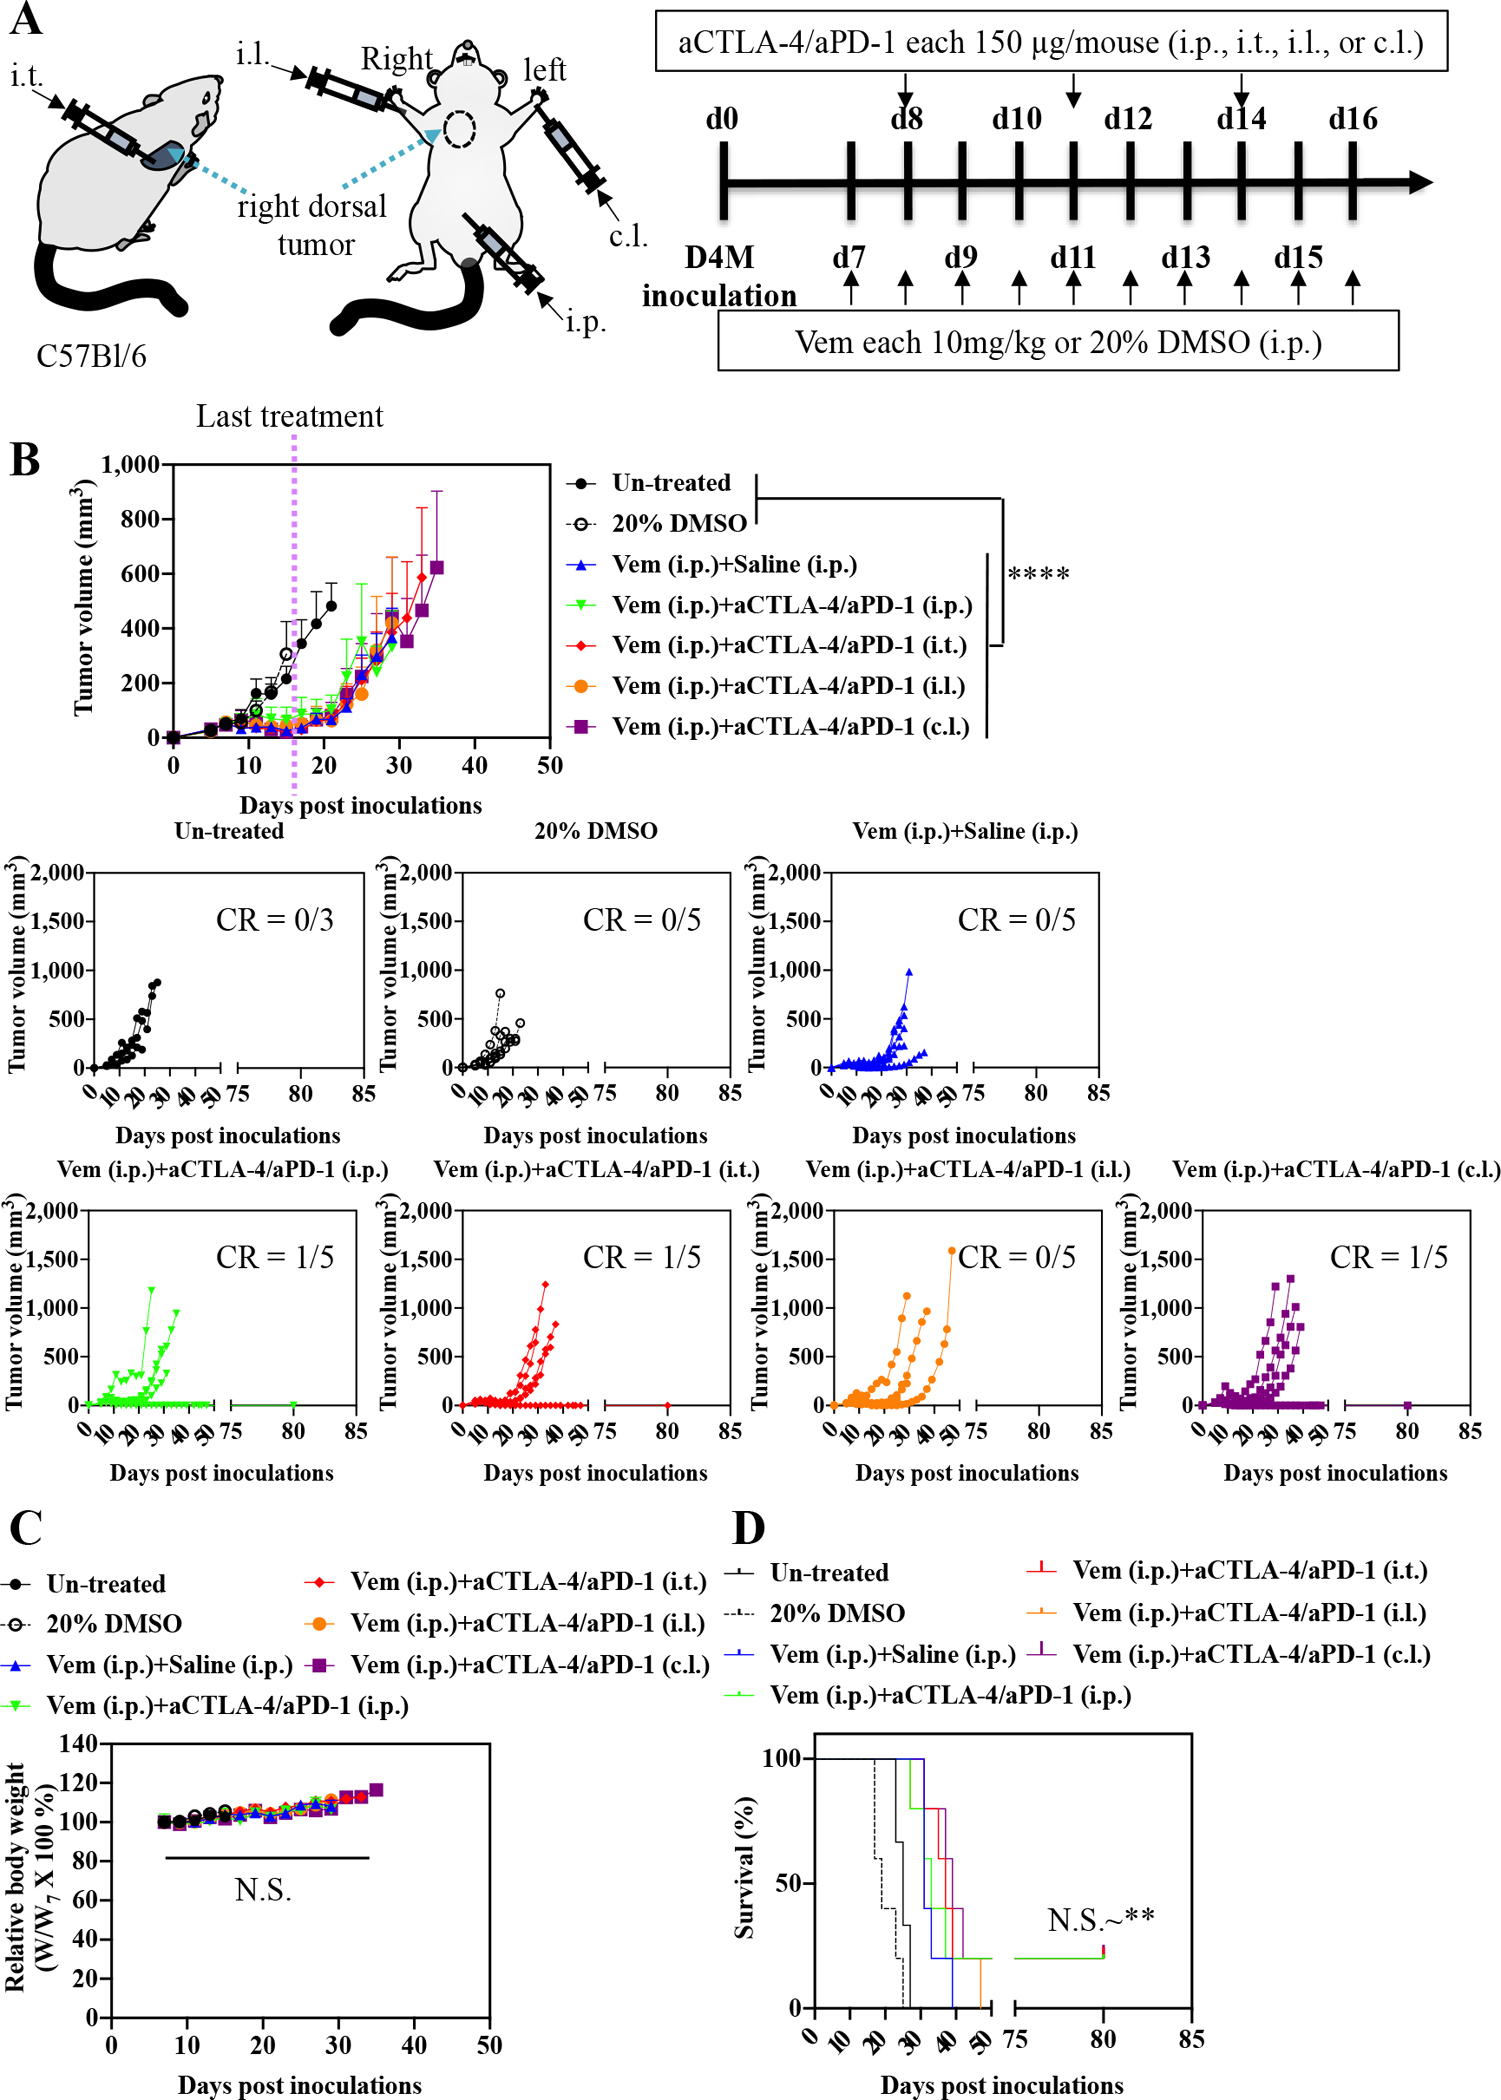
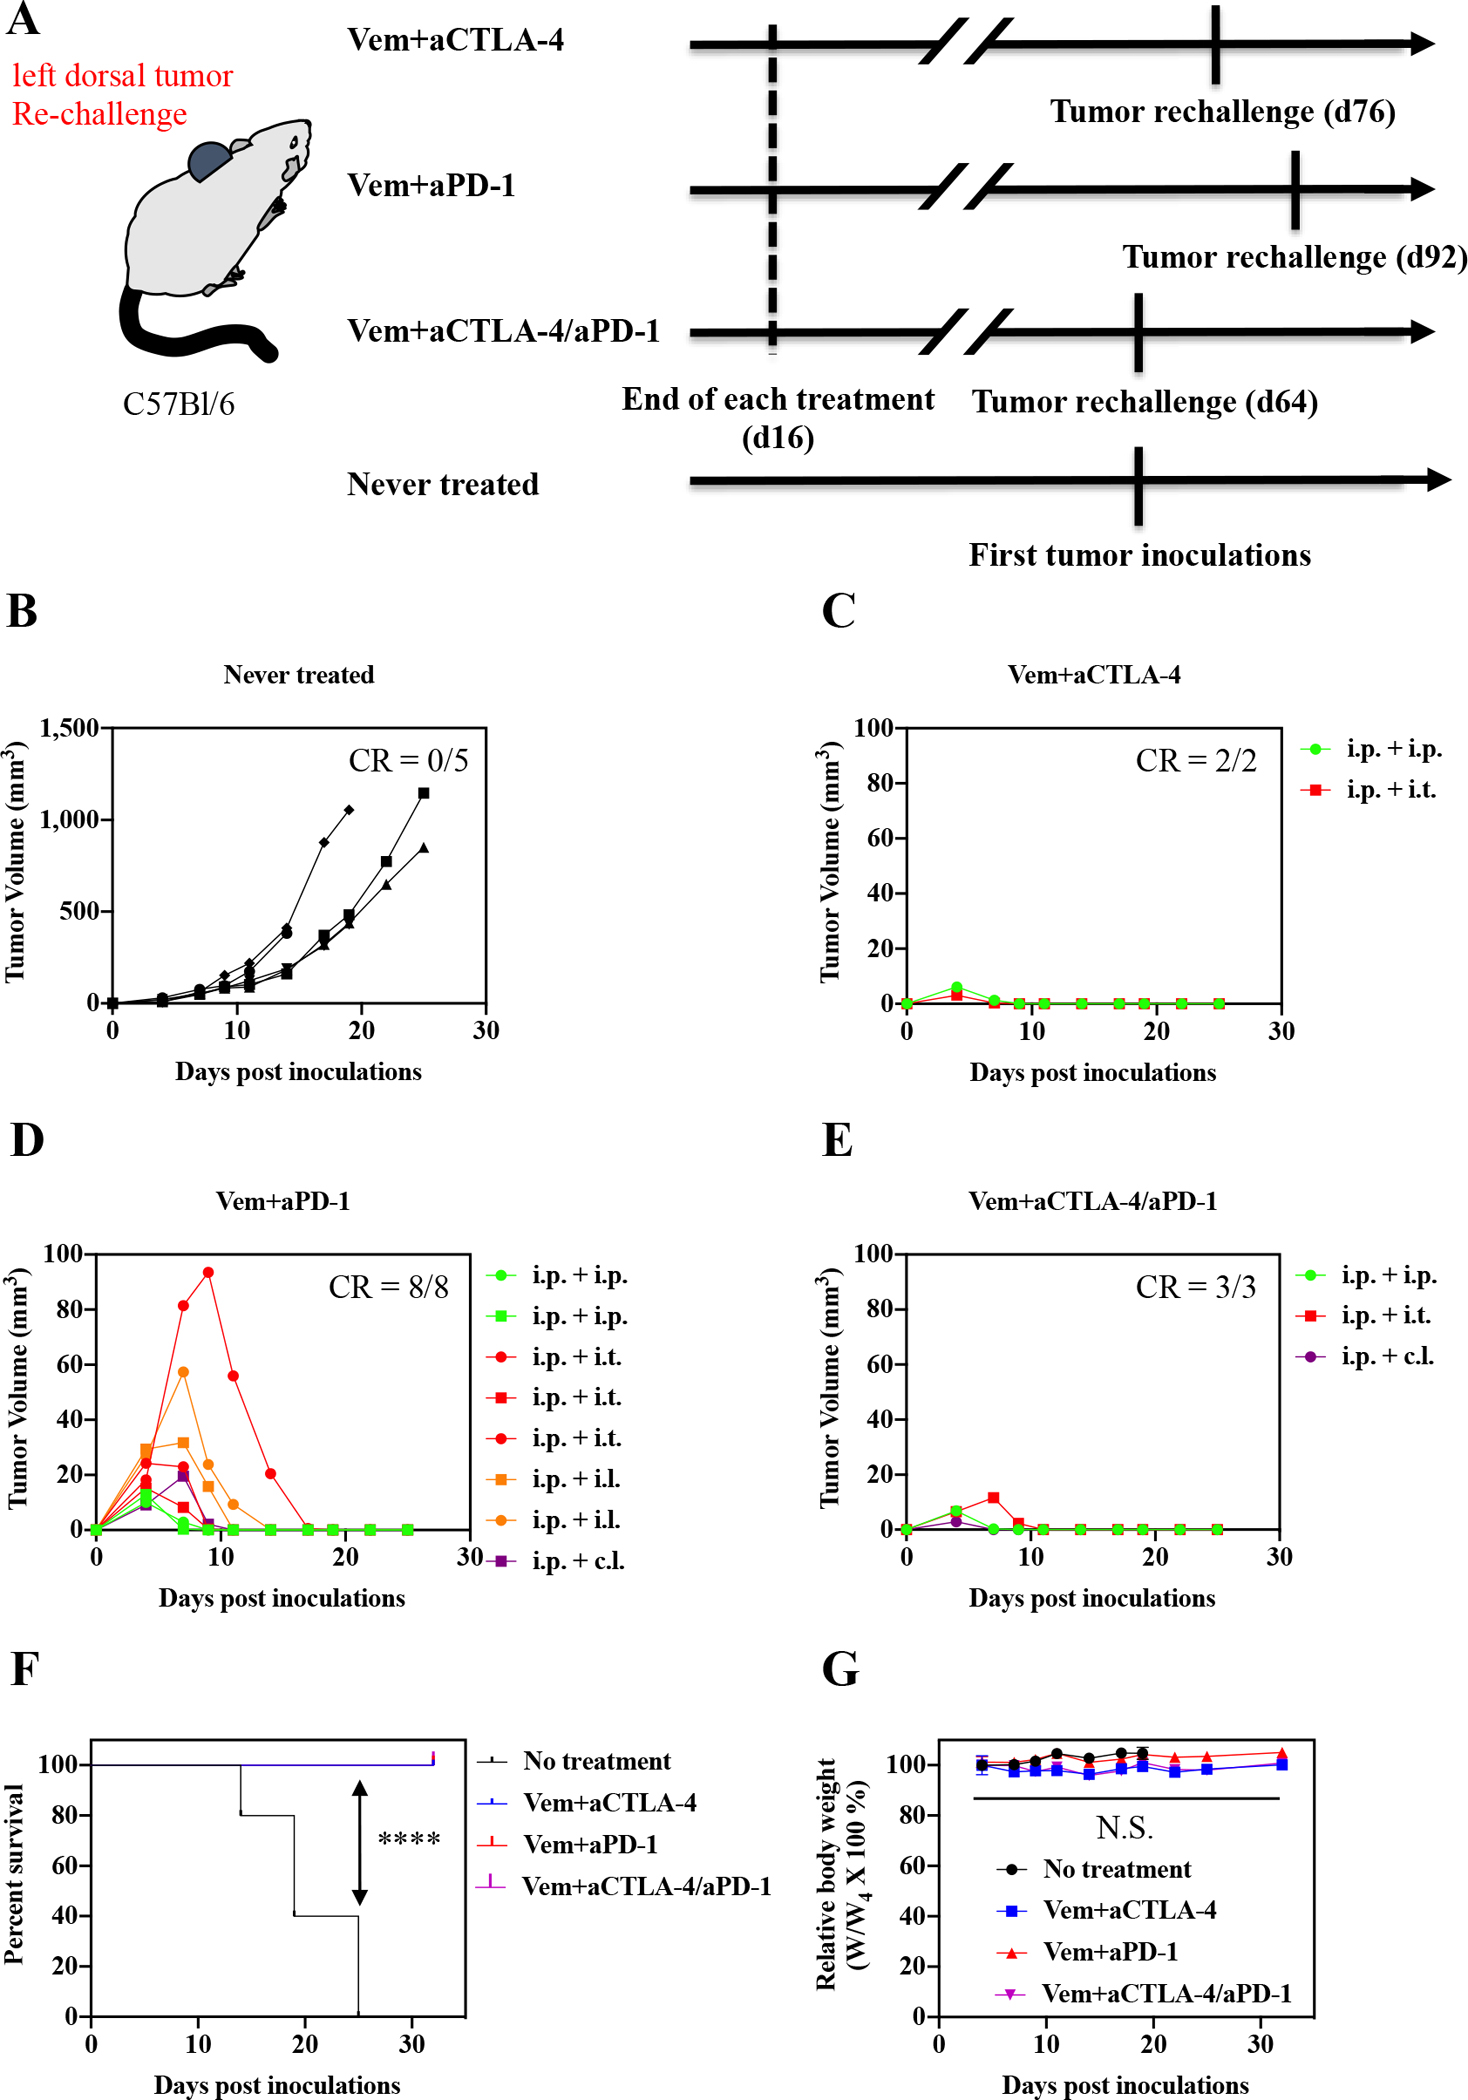
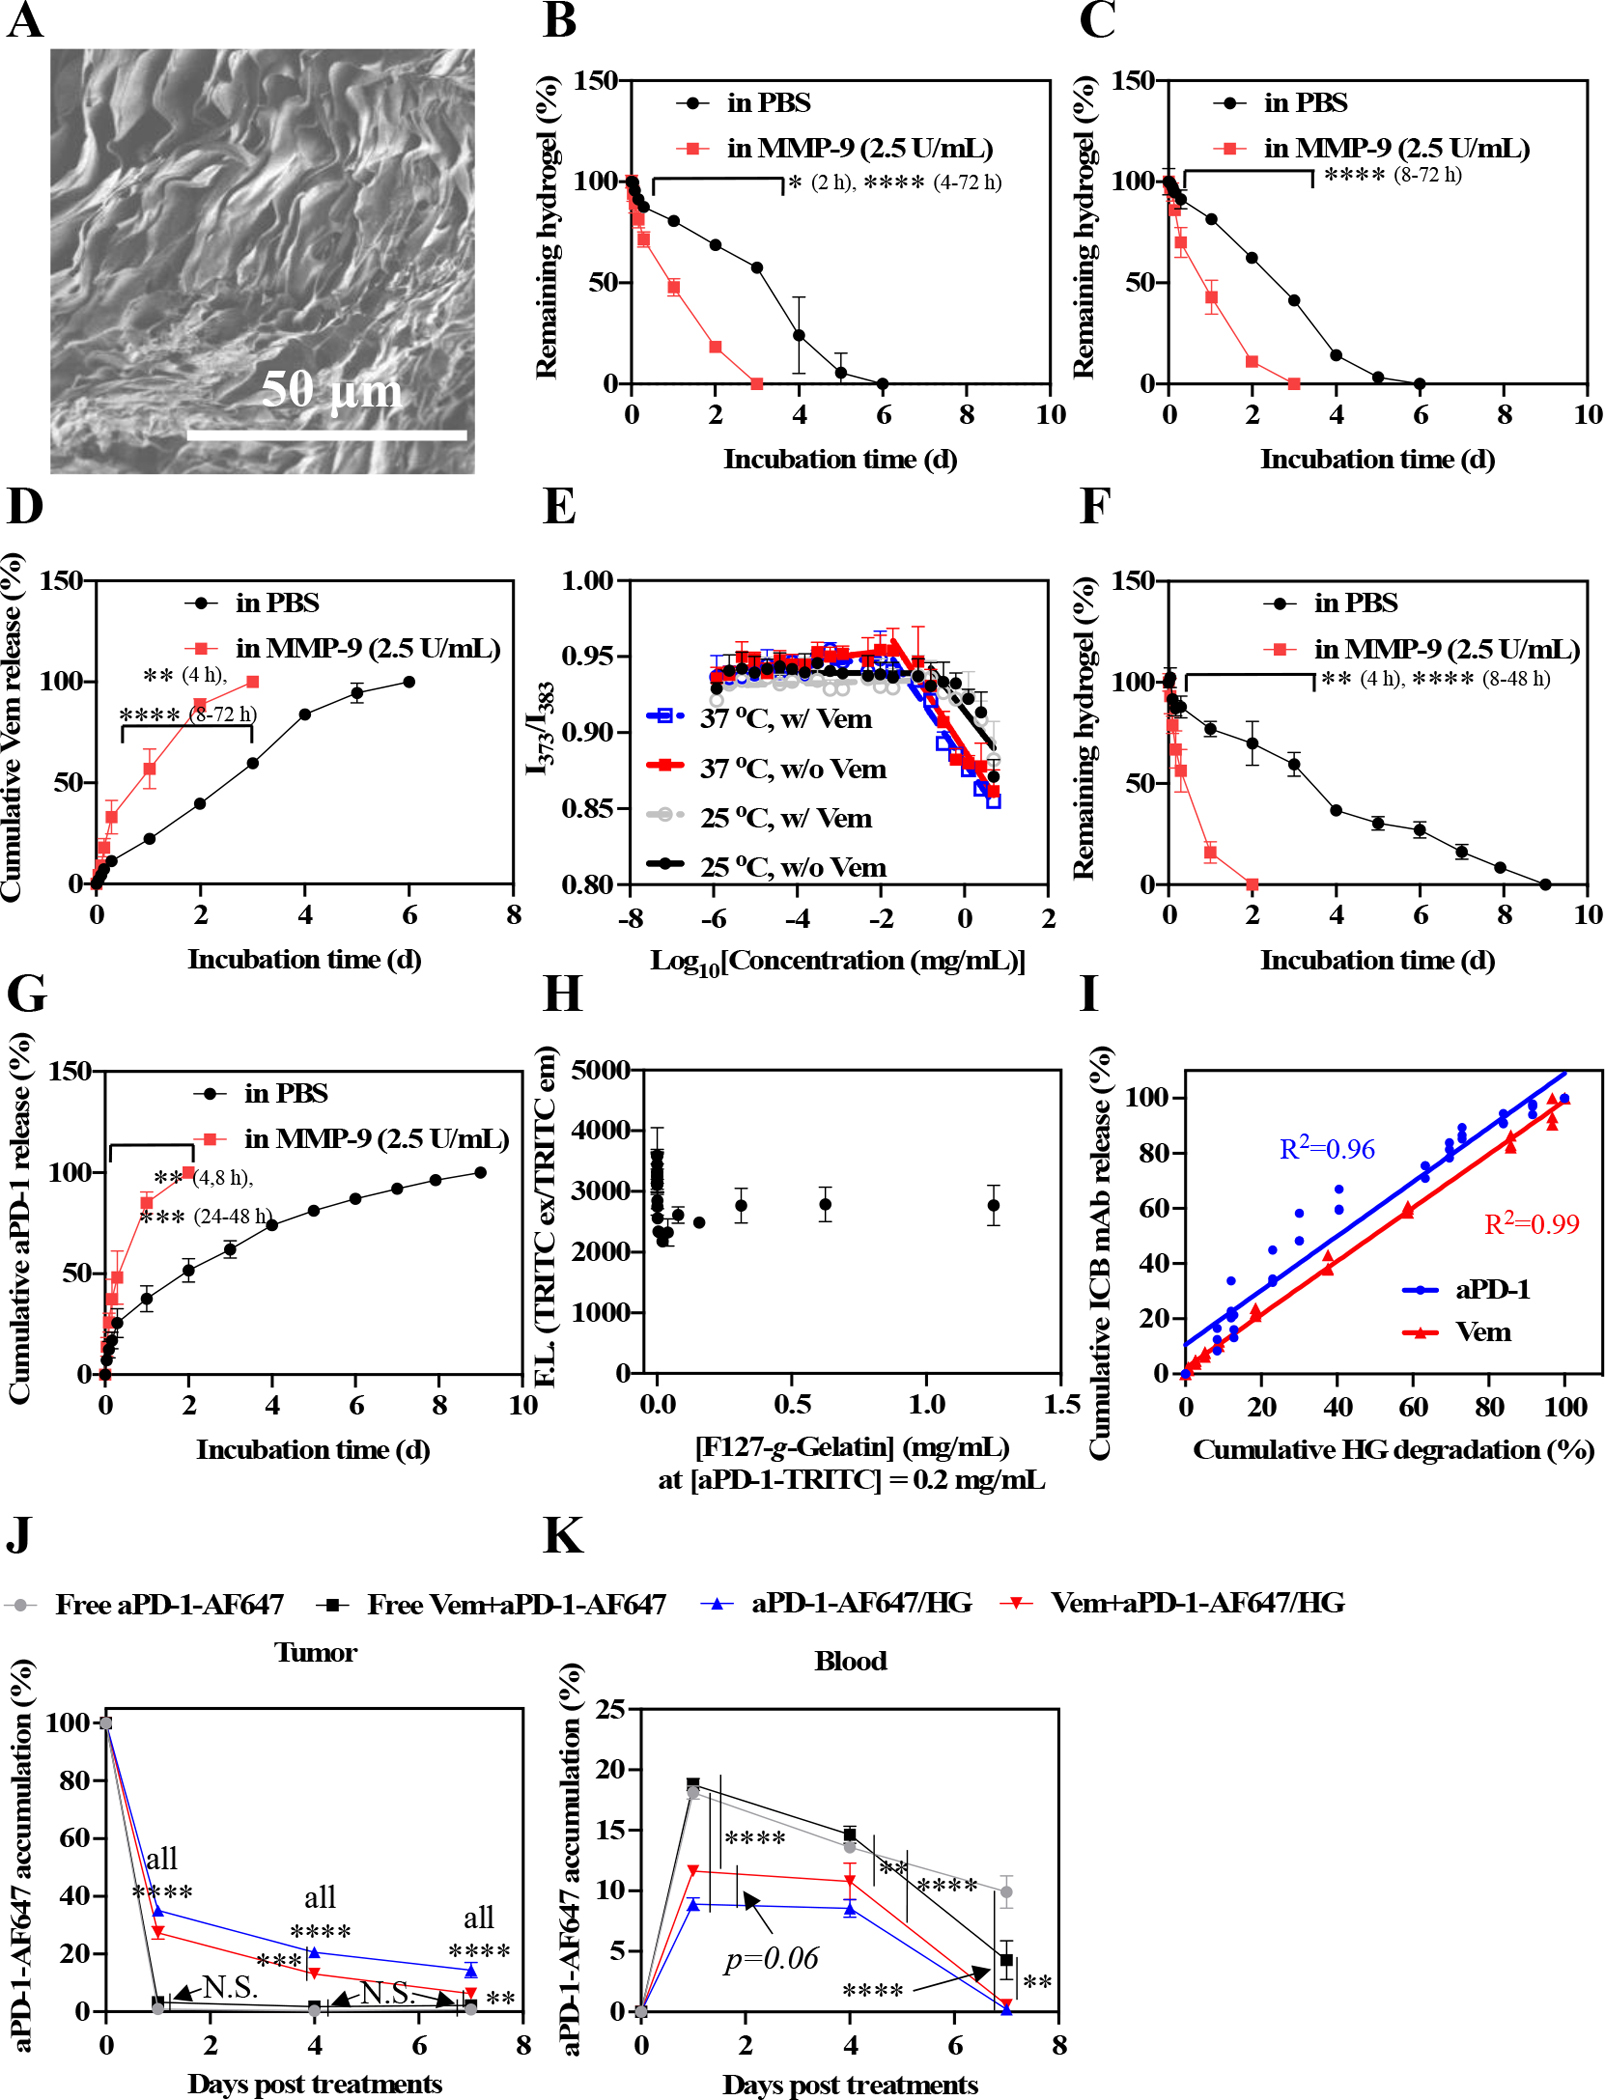
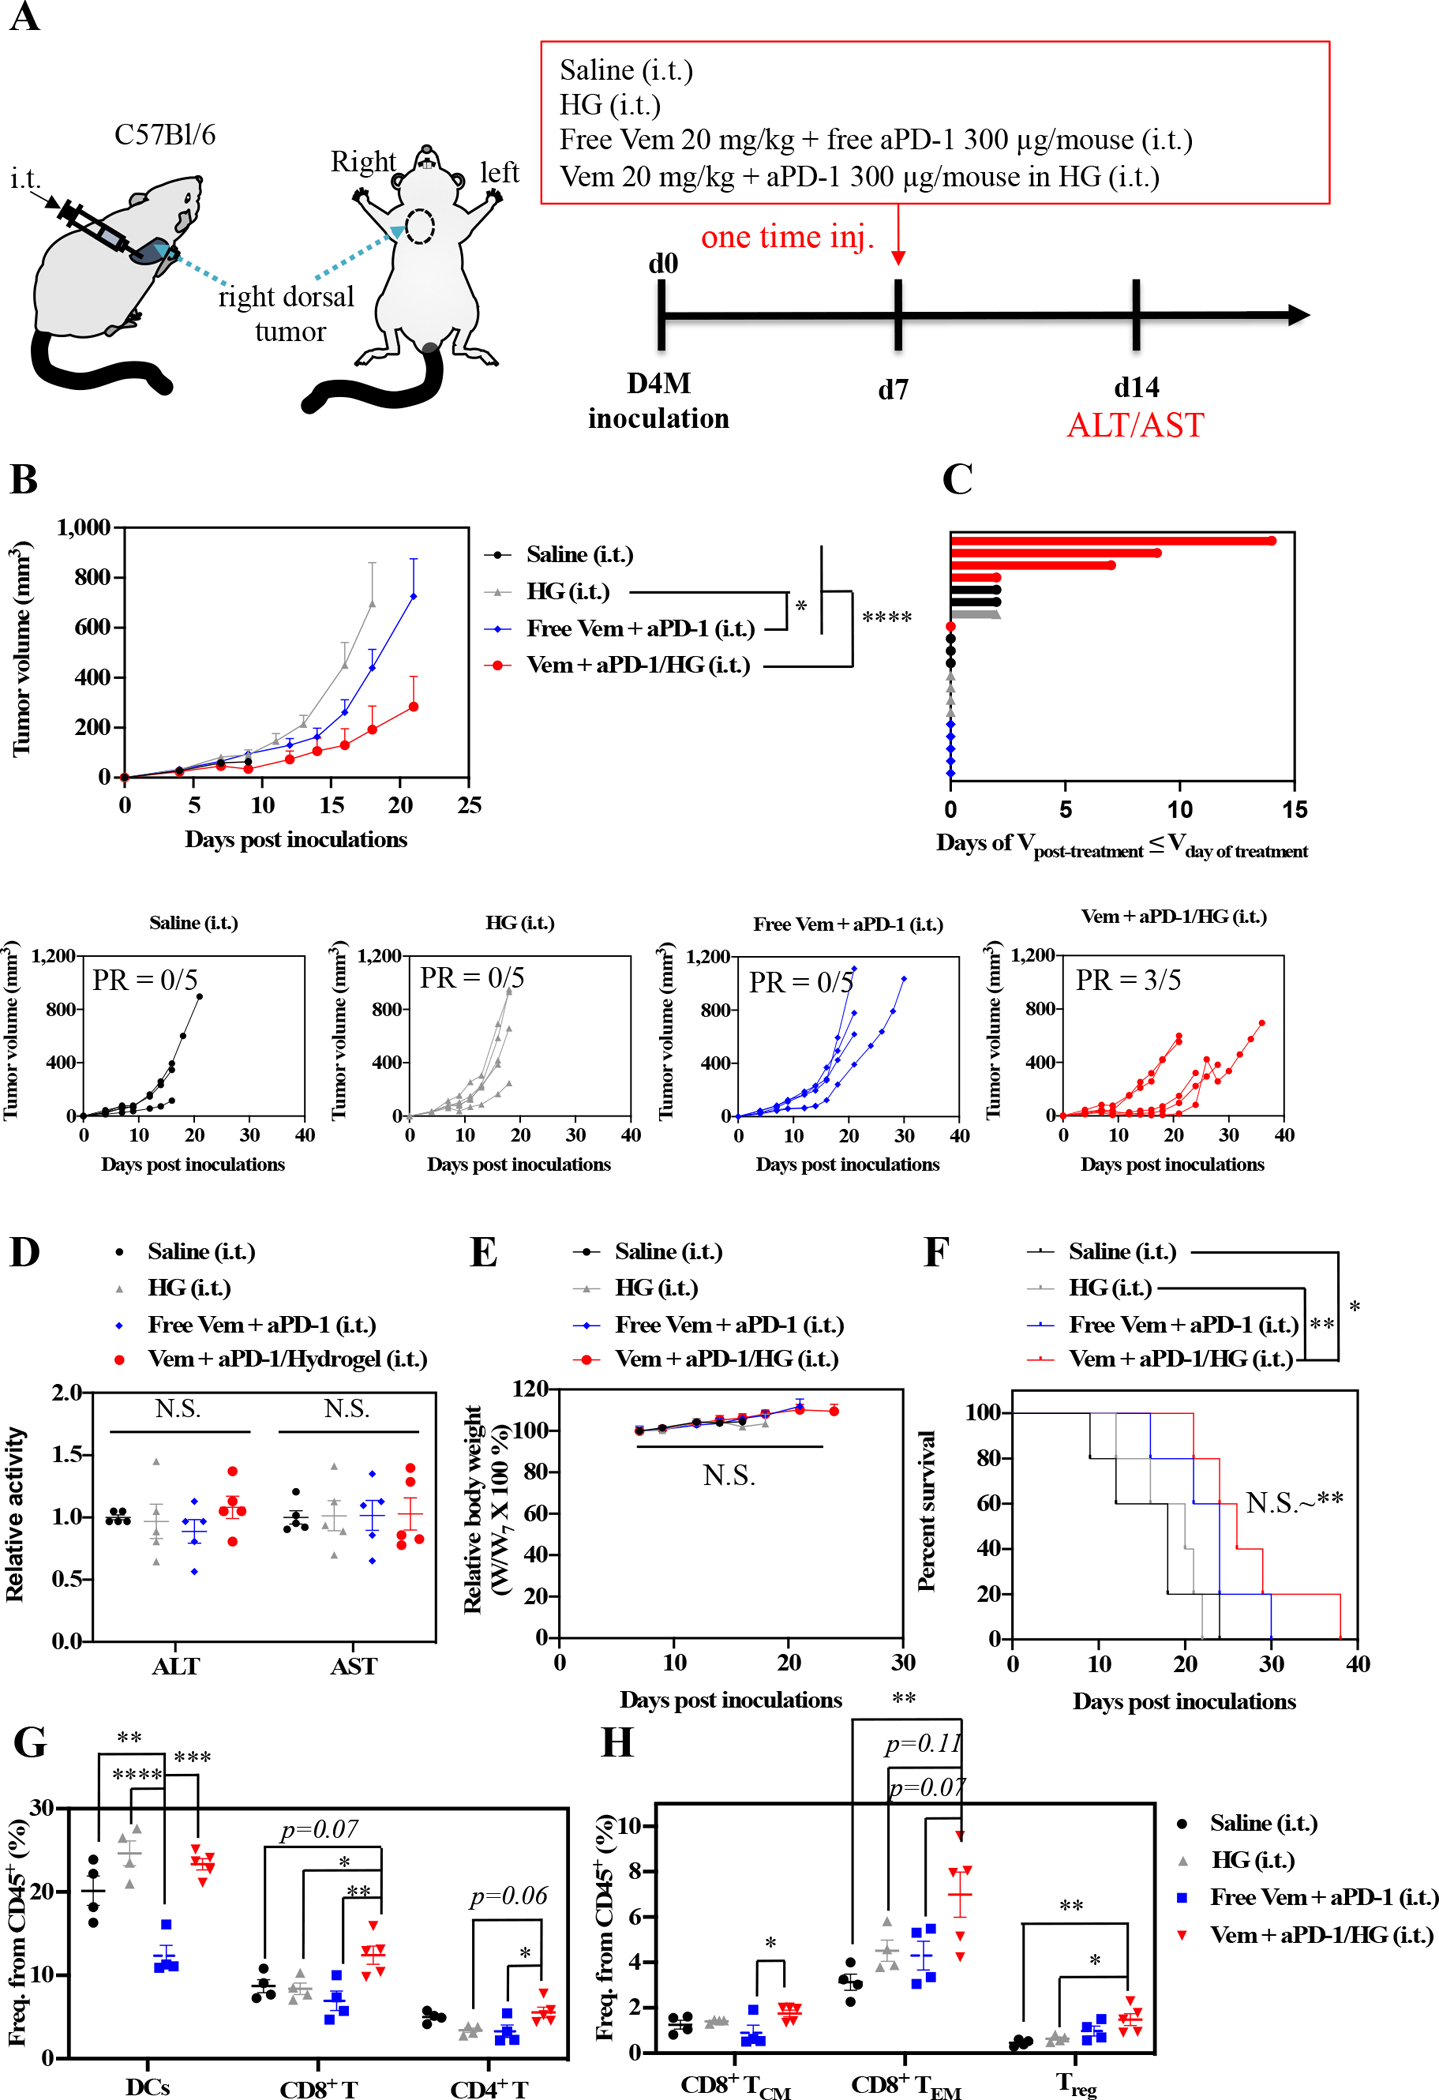
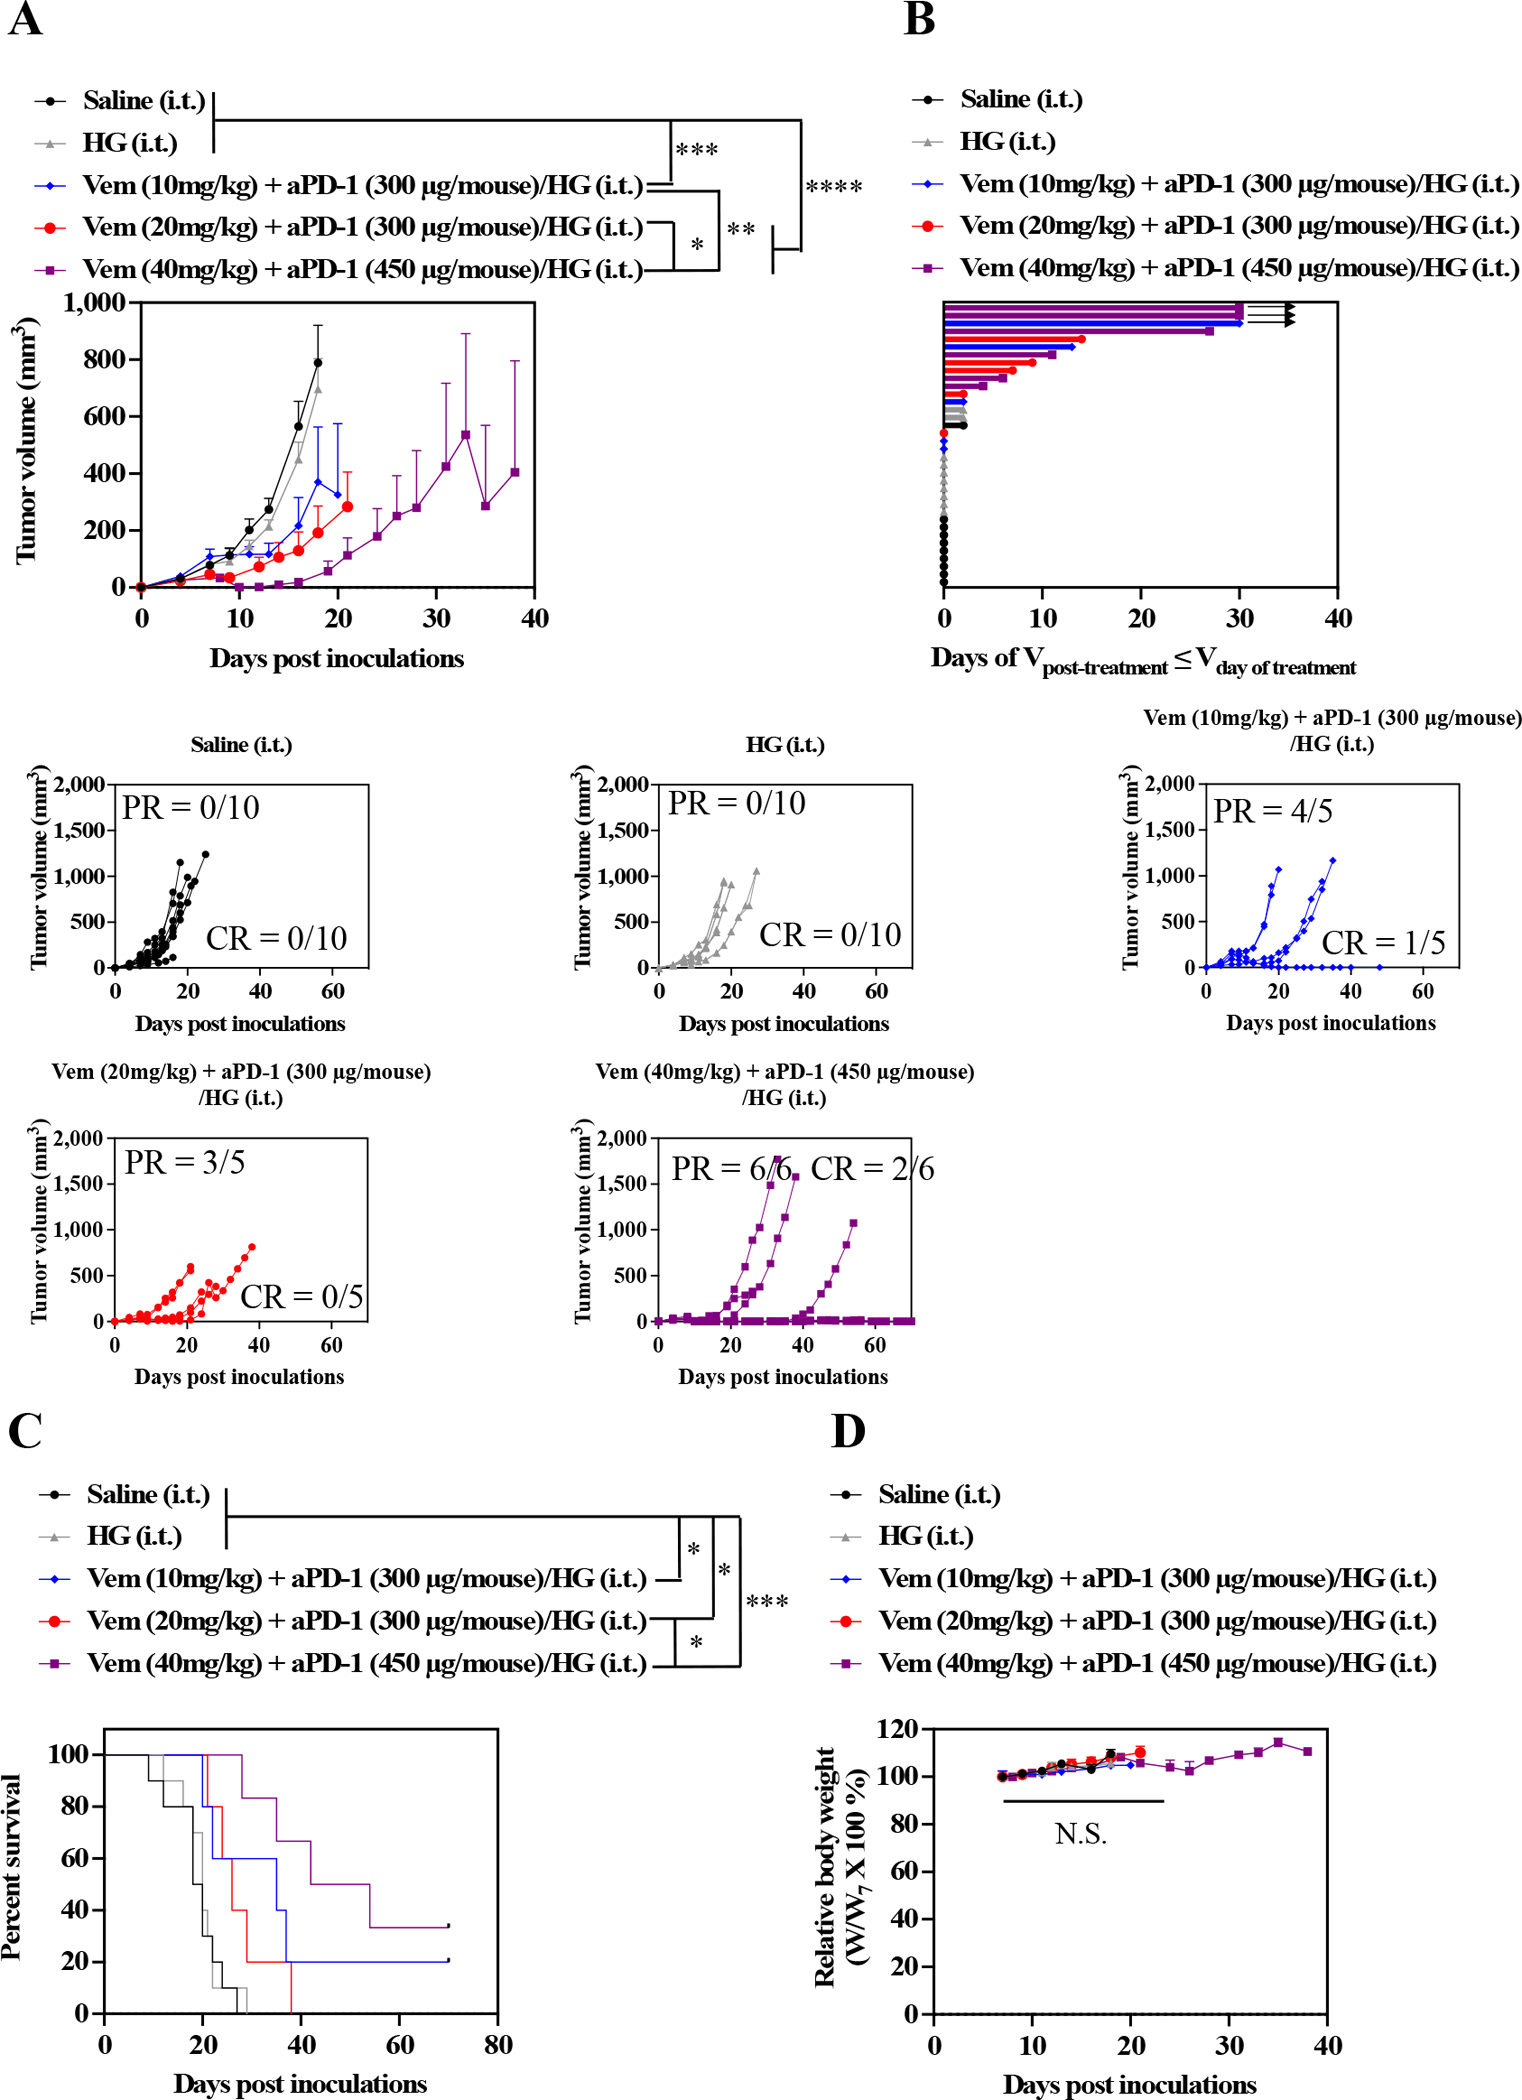
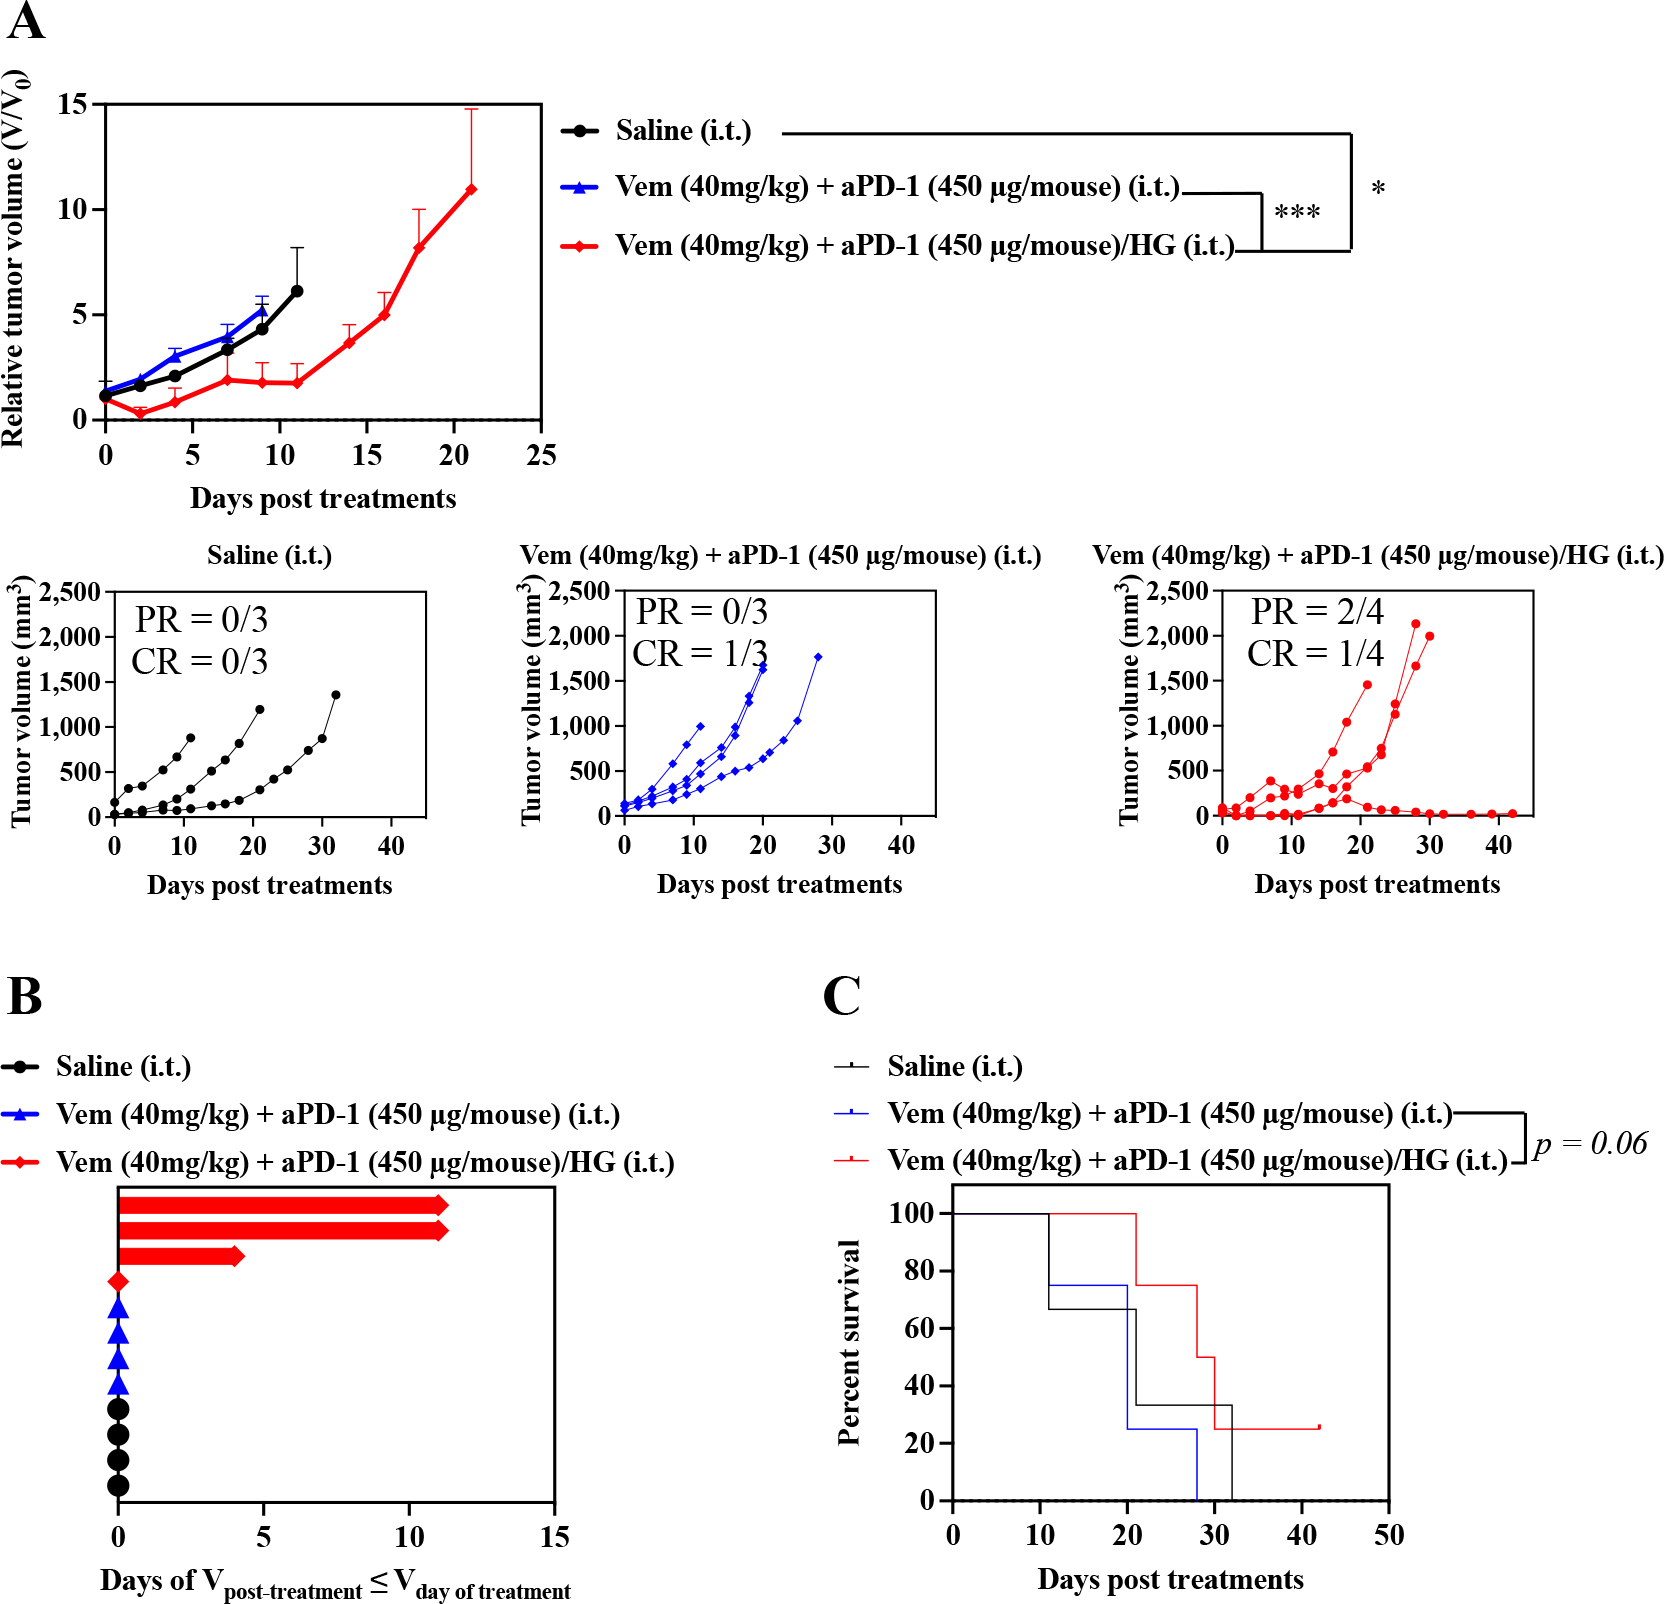
The wide prevalence of BRAF mutations in diagnosed melanomas drove the clinical advancement of BRAF inhibitors in combination with immune checkpoint blockade for treatment of advanced disease. However, deficits in therapeutic potencies and safety profiles motivate the development of more effective strategies that improve the combination therapy's therapeutic index. Herein, we demonstrate the benefits of a locoregional chemoimmunotherapy delivery system, a novel thermosensitive hydrogel comprised of gelatin and Pluronic® F127 components already widely used in humans in both commercial and clinical products, for the co-delivery of a small molecule BRAF inhibitor with immune checkpoint blockade antibody for the treatment of BRAF-mutated melanoma. In vivo evaluation of administration route and immune checkpoint target effects revealed intratumoral administration of antagonistic programmed cell death protein 1 antibody (aPD-1) lead to potent antitumor therapy in combination with BRAF inhibitor vemurafenib. The thermosensitive F127-g-Gelatin hydrogel that was evaluated in multiple murine models of BRAF-mutated melanoma that facilitated prolonged local drug release within the tumor (>1 week) substantially improved local immunomodulation, tumor control, rates of tumor response, and animal survival. Thermosensitive F127-g-Gelatin hydrogels thus improve upon the clinical benefits of vemurafenib and aPD-1 in a locoregional chemoimmunotherapy approach for the treatment of BRAF-mutated melanoma.

Keywords: BRAF inhibitor; Drug delivery system; Immune checkpoint blockade; Sustained release; Thermosensitive hydrogel.


Conflict of interest statement

Declaration of competing interest J.K. and S.N.T. are inventors on a submitted patent related to the technology described in this manuscript.

Figures

Fig. 1.
Fig. 1.. Administration routes-dependency of combined Vem and aCTLA-4 therpay on D4M models.
(A) Scheme for administration routes and treatment schedule. 5×10⁵ D4M cells in 30 μL saline were subcutaneously inoculated in C57Bl/6 on day 0. Vem (10 mg/kg, 100 μL) was treated i.p. every day from day 7 to day 16. aCTLA-4 (150 μg mouse−1, 30 μL) was administered i.p., i.t., i.l. or c.l. 3 times every 3 days from day 8. (B) Average and individual tumor volumes (n=5). (C) Weight changes after treatment (n=5). (D) Kaplan–Meier survival curves (n=5). Data are presented as mean±SEM. Two-way ANOVA using Tukey post-hoc statistical hypothesis was employed for (B) and (C). Log-rank using Mentel-Cox statistical hypothesis was used for survival (D). ****p < 0.0001, ***p < 0.001, **p < 0.01, and *p < 0.05. N.S. means “Non Significant”. Statistical values for (D) are listed in Table S1.
Fig. 2.
Fig. 2.. Administration routes-dependency of combined Vem and aPD-1 therpay on D4M models.
(A) Scheme for administration routes and treatment schedule. 5×10⁵ D4M cells in 30 μL saline were subcutaneously inoculated in C57Bl/6 on day 0. Vem (10 mg/kg, 100 μL) was treated i.p. every day from day 7 to day 16. aPD-1(150 μg mouse−1, 30 μL) was administered i.p., i.t., i.l. or c.l. 3 times every 3 days from day 8. (B) Average and individual tumor volumes (n=5). (C) Weight changes after treatment (n=5). (D) Kaplan–Meier survival curves (n=5). Data are presented as mean±SEM. Two-way ANOVA using Tukey post-hoc statistical hypothesis was employed for (B) and (C). Log-rank using Mentel-Cox statistical hypothesis was used for survival (D). ****p < 0.0001, ***p < 0.001, **p < 0.01, and *p < 0.05. N.S. means “Non Significant”. Statistical values for (D) are listed in Table S2.
Fig. 3.
Fig. 3.. Antagonistic effects of combined aCTLA-4 and aPD-1 in Vem-mediated therapy on D4M models.
(A) Scheme for administration routes and treatment schedule. 5×10⁵ D4M cells in 30 μL saline were subcutaneously inoculated in C57Bl/6 on day 0. Vem (10 mg/kg, 100 μL) was treated i.p. every day from day 7 to day 16. Mixture of aCTLA-4 and aPD-1 (each 150 μg mouse−1, total 30 μL) was administered i.p., i.t., i.l. or c.l. 3 times every 3 days from day 8. (B) Average and individual tumor volumes (n=5). (C) Weight changes after treatment (n=5). (D) Kaplan–Meier survival curves (n=5). Data are presented as mean±SEM. Two-way ANOVA using Tukey post-hoc statistical hypothesis was employed for (B) and (C). Log-rank using Mentel-Cox statistical hypothesis was used for survival (D). ****p < 0.0001, ***p < 0.001, **p < 0.01, and *p < 0.05. N.S. means “Non Significant”. Statistical values for (D) are listed in Table S3.
Fig. 4.
Fig. 4.. Re-challenge of tumor on the mice that had experienced CR after combined Vem and ICBs therapy in Fig 1–3.
(A) Scheme for tumor re-challenge and treatment schedules. 5×10⁵ D4M cells in 30 μL saline were subcutaneously inoculated to the left dorsal of the mice survived from combined Vem and ICBs therapy. (B) Individual tumor volumes of the mice that had never experienced tumor inoculations and combined Vem and ICBs therapy. (C-E) Individual re-challenged tumor volumes of the mice that survived after having experienced the tumor inoculations on right dorsal and (C) combined Vem (i.p.) and aCTLA-4 (i.p. or i.t.) therapy, (D) combined Vem (i.p.) and aPD-1 (i.p., i.t.,i.l., or c.l.) therapy, or (E) combined Vem (i.p.) and aCTLA-4/aPD-1 (i.p., i.t., or c.l.) therapy. (F) Kaplan–Meier survival curves after re-challenge. (G) Weight changes tumor after re-challenge. Log-rank using Mentel-Cox statistical hypothesis was used for statistical analysis of (F). ****p < 0.0001, ***p < 0.001, **p < 0.01, and *p < 0.05. Two-way ANOVA using Tukey post-hoc statistical hypothesis was employed for (G) presented with mean±SEM.. N.S. means “Non Significant”.
Fig. 5.
Fig. 5.. In vitro residence stability and drug release behavior of F127-g-Gelatin hydrogels and in vivo biodistribution of aPD-1 released from F127-g-Gelatin thermosensitive hydrogels.
(A) Dry SEM image of dry 4.5 wt.% F127-g-Gelatin hydrogel. (B) In vitro residence stability of 4.5 wt.% bare F127-g-Gelatin hydrogel (n=3–4). (C) In vitro residence stability of 4.5 wt.% F127-g-Gelatin hydrogel (300 μL) containing Vem (20 mg mL−1 in the F127-g-Gelatin hydrogel) (n=4). (D) In vitro Vem release behaviors from 4.5 wt.% F127-g-Gelatin hydrogel (300 μL) containing Vem (20 mg mL−1 in the F127-g-Gelatin hydrogel) (n=4). (E) CMC measurement of F127-g-Gelatin at 25 °C and 37 °C with (w/) or without (w/o) Vem. CMC is the intersection of two distinctive linear lines determined by ratiometric fluorescence (373 nm/383 nm) of pyrenes. (F) In vitro residence stability of 4.5 wt.% F127-g-Gelatin hydrogel (300 μL) containing aPD-1-TRITC (6.67 mg mL−1 in the F127-g-Gelatin hydrogel) (n=4). (G) In vitro Vem release behaviors from 4.5 wt.% F127-g-Gelatin hydrogel (300 μL) containing aPD-1-TRITC (6.67 mg mL−1 in the F127-g-Gelatin hydrogel) (n=4). (H) F127-g-Gelatin concentration-dependent fluorescence of aPD-1-TRITC (n=3). (I) Correlation graph between hydrogel degradation and Vem/aPD-1-TRITC release (n=3–4). (J,K) In vivo local and systemic biodistribution of aPD-1 released from F127-g-Gelatin thermosensitive hydrogels. Free aPD-1-AF647, free aPD-1-AF647 in the presence of Vem, aPD-1-AF647 with 4.5 wt.% F127-g-Gelatin hydrogel, aPD-1-AF647 with 4.5 wt.% F127-g-Gelatin hydrogel containing Vem (Vem and aPD-1 dose equivalent to 10 mg kg−1 and 100 μg mouse−1, respectively) (n=4) were administered into the tumor established with D4M 5×10⁵ cells in 30 μL saline on day 0. Mice were sacrificed on day 1, 4, and 7. Biodistribution of aPD-1 in (J) tumor, and (K) blood. Data are presented as (A-I) mean±SD or (J,K) mean±SEM. Two-way ANOVA using Tukey post-hoc statistical hypothesis was employed for (B-D,F,G,J,K). ****p < 0.0001, ***p < 0.001, **p < 0.01, and *p < 0.05. N.S. means “Non Significant”.
Fig. 6.
Fig. 6.. Antitumor effects and tumoral immune profiles of combined Vem and aPD-1 with F127-g-Gelatin hydrogel on D4M models.
(A) Scheme for administration routes and treatment schedule. 5×10⁵ D4M cells in 30 μL saline were subcutaneously inoculated in C57Bl/6 on day 0. Mixture of Vem (20 mg kg−1) and aPD-1 (300 μg mouse−1) in saline (30 μL) or F127-g-Gelatin hydrogel (30 μL) was administered i.t. on day 7. (B) Average and individual tumor volumes (n=5). (C) Swimmer plot to present therapeutic response, which depicts how long that mouse’s tumor growth curve remained flat or lower than its initial volume at time of treatment (n=5). (D) ALT/AST results from blood serum (n=5). (E) Weight changes after treatment (n=5). (F) Kaplan–Meier survival curves (n=5). (G,H) Profiles of DCs and T cells in tumor on day 14 (n=4–5). Frequency of (G) CD45+CD11c+ (DCs), CD45+CD3+CD8+ (CD8+ T) cells, CD45+CD3+CD4+ (CD4+ T), (H) CD45+CD3+CD8+CD62L+CD44+ (central memory CD8+ T cells, CD8+ TCM), CD45+CD3+CD8+CD62LCD44+ (Effector memory CD8+ T cells, CD8+ TEM), and CD45+CD3+CD4+Foxp3+ (Treg) cells. Data are presented as mean±SEM. Data are presented as mean±SEM. Two-way ANOVA using Tukey post-hoc statistical hypothesis was employed for (B) and (E). One-way ANOVA using Tukey post-hoc statistical hypothesis was employed for (D), (G), and (H). Log-rank using Mentel-Cox statistical hypothesis was used for survival (F). ****p < 0.0001, ***p < 0.001, **p < 0.01, and *p < 0.05. N.S. means “Non Significant”. Statistical values for (E) are listed in Table S5.
Fig. 7.
Fig. 7.. Dose-dependent antitumor effects of combined Vem and aPD-1 with F127-g-Gelatin hydrogel on D4M models.
(A) Average and individual tumor volumes (n=5–10). (B) Swimmer plot to present therapeutic response, which depicts how long that mouse’s tumor growth curve remained flat or lower than its initial volume at time of treatment (n=5 or 10). Arrow indicates complete responder, which continues to have low tumor volume for remainder of measurement days. (C) Kaplan–Meier survival curves (n=5–10). (D) Weight changes after treatment (n=5–10). Data are presented as mean±SEM. Two-way ANOVA using Tukey post-hoc statistical hypothesis was employed for (A) and (D). Log-rank using Mentel-Cox statistical hypothesis was used for survival (C). ****p < 0.0001, ***p < 0.001, **p < 0.01, and *p < 0.05. N.S. means “Non Significant”. Statistical values for (C) are listed in Table S7.
Fig. 8.
Fig. 8.. Antitumor effects of combined Vem and aPD-1 with F127-g-Gelatin hydrogel on SM1 models.
SM1 cells were passaged in NSG mice. After harvested and resuspended in 160 μL saline, 30 μL of SM1 cell solutions were subcutaneously inoculated in C57Bl/6. Treatments were started when SM1 tumor size reached to 5–10 mm. Mice treated with saline, or combined single i.t. administrations of Vem (40 mg kg−1) and aPD-1 (450 μg mouse−1) were employed as control groups. F127-g-Gelatin hydrogels containing combined Vem (40 mg kg−1) and aPD-1 (450 μg mouse−1) were i.t. administered one time. (A) Relative average and individual tumor volumes (n=3–4). (B) Swimmer plot to present therapeutic response, which depicts how long that mouse’s tumor growth curve remained flat or lower than its initial volume at time of treatment (n=3–4). (C) Kaplan–Meier survival curves (n=3–4). Data are presented as mean±SEM. Twoway ANOVA using Tukey post-hoc statistical hypothesis was employed for (A). Log-rank using Mentel-Cox statistical hypothesis was used for survival (C). ****p < 0.0001, ***p < 0.001, **p < 0.01, and *p < 0.05. Statistical values for (C) are listed in Table S8.

References

    1. Bollag G, Tsai J, Zhang J, Zhang C, Ibrahim P, Nolop K, Hirth P, Vemurafenib: the first drug approved for BRAF-mutant cancer, Nat. Rev. Drug Discov. 11 (2012) 873–886, 10.1038/nrd3847. - DOI - PubMed
    1. Salama AKS, Flaherty KT, BRAF in Melanoma: Current Strategies and Future Directions, Clin. Cancer Res. 19 (2013) 4326–4334, 10.1158/1078-0432.CCR-13-0779 - DOI - PubMed
    1. Vultur A, Villanueva J, Herlyn M, Targeting BRAF in Advanced Melanoma: A First Step toward Manageable Disease, Clin. Cancer Res. 17 (2011) 1658–1663, 10.1158/1078-0432.CCR-10-0174. - DOI - PMC - PubMed
    1. Morkel M, Riemer P, Bläker H, Sers C, Similar but different: distinct roles for KRAS and BRAF oncogenes in colorectal cancer development and therapy resistance, Oncotarget 6 (2015) 20785–20800, 10.18632/oncotarget.4750. - DOI - PMC - PubMed
    1. Poulikakos PI, Rosen N, Mutant BRAF Melanomas—Dependence and Resistance, Cancer Cell 19 (2011) 11–15, 10.1016/j.ccr.2011.01.008 - DOI - PubMed

Publication types