. 2023 Apr 20;14(1):2131.
doi: 10.1038/s41467-023-37838-6.

RPL3L-containing ribosomes determine translation elongation dynamics required for cardiac function

Affiliations

RPL3L-containing ribosomes determine translation elongation dynamics required for cardiac function

Chisa Shiraishi et al. Nat Commun. .

Abstract

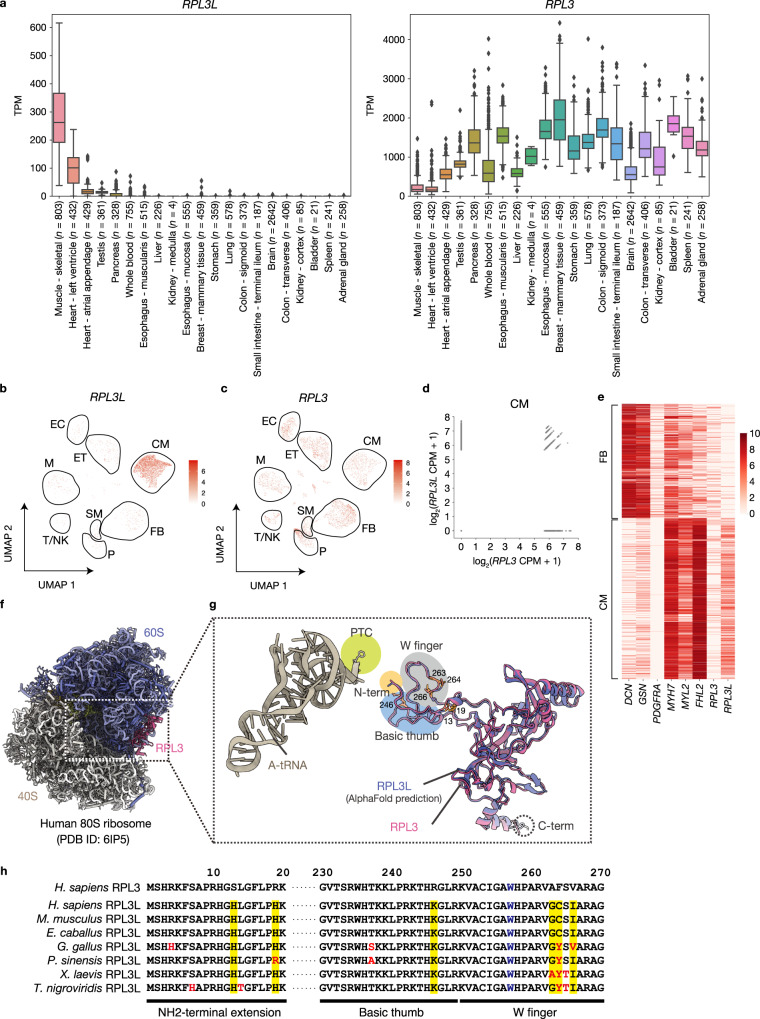
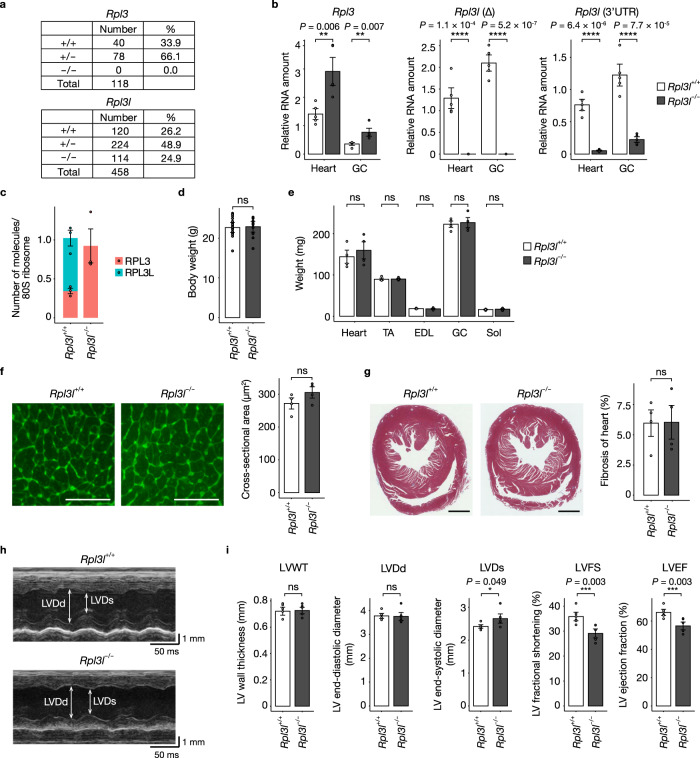
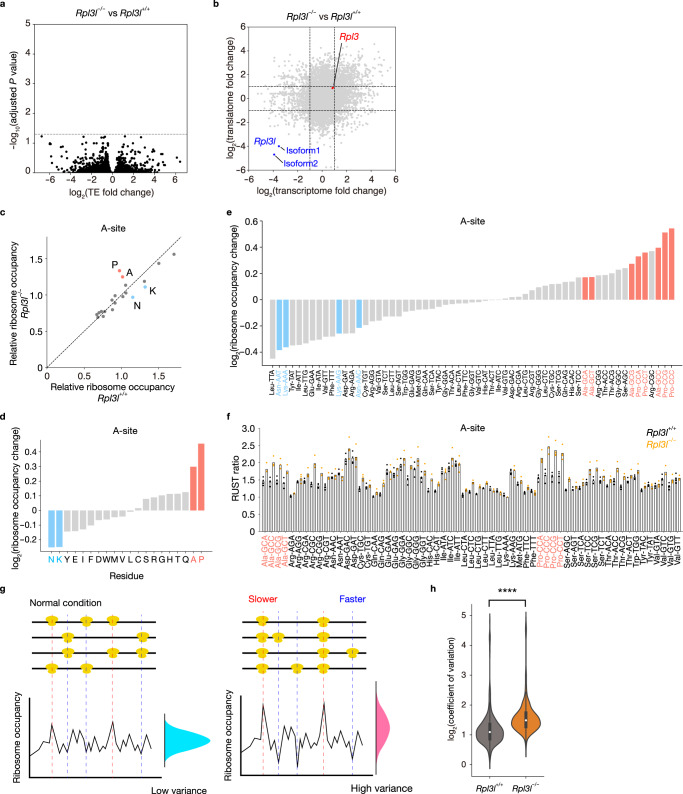
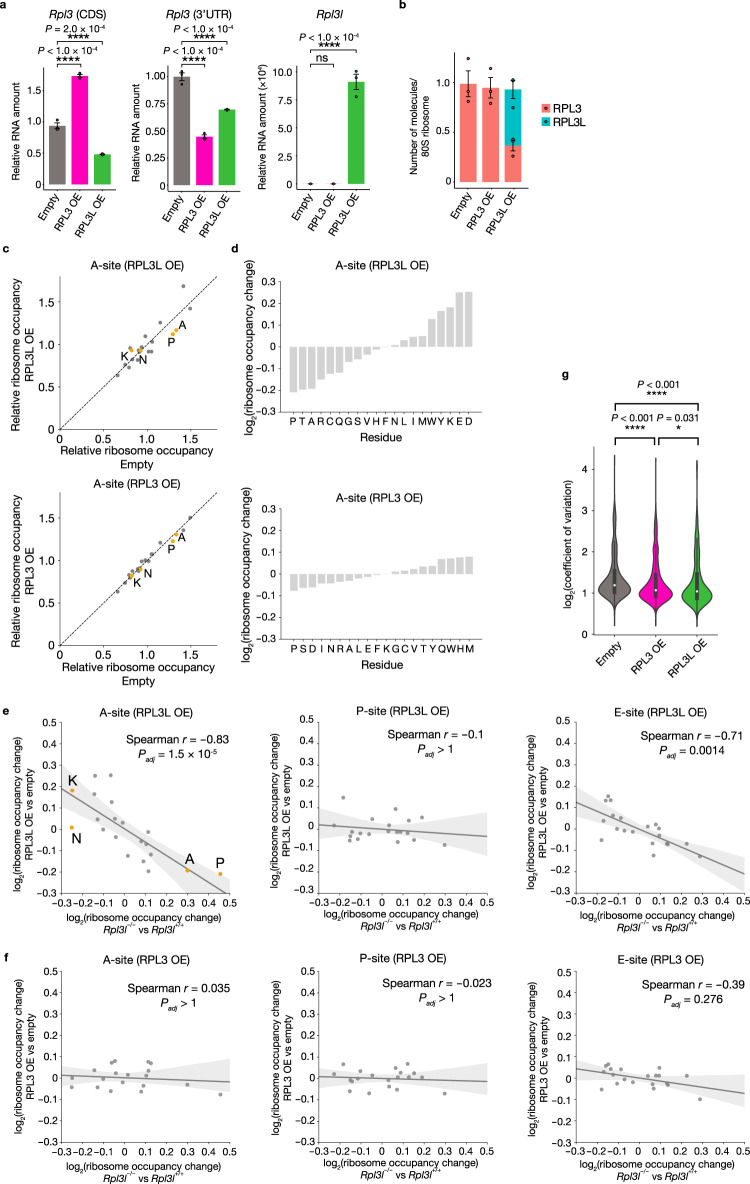
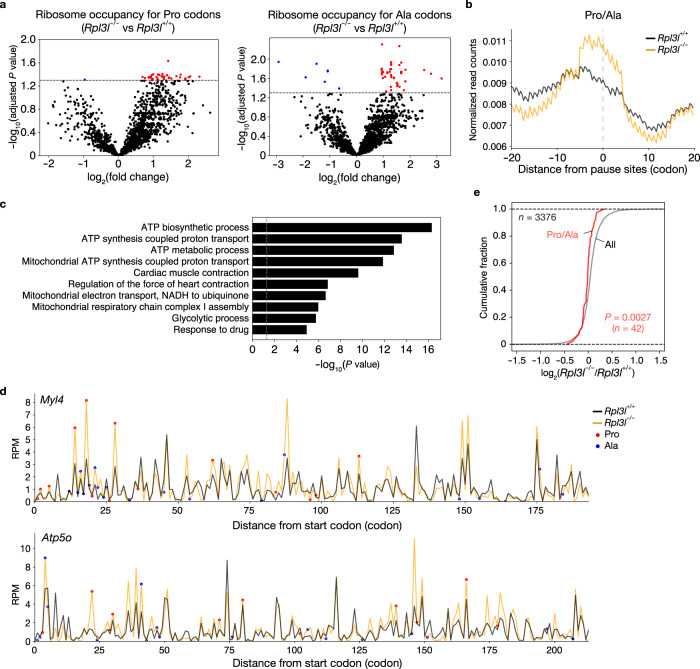
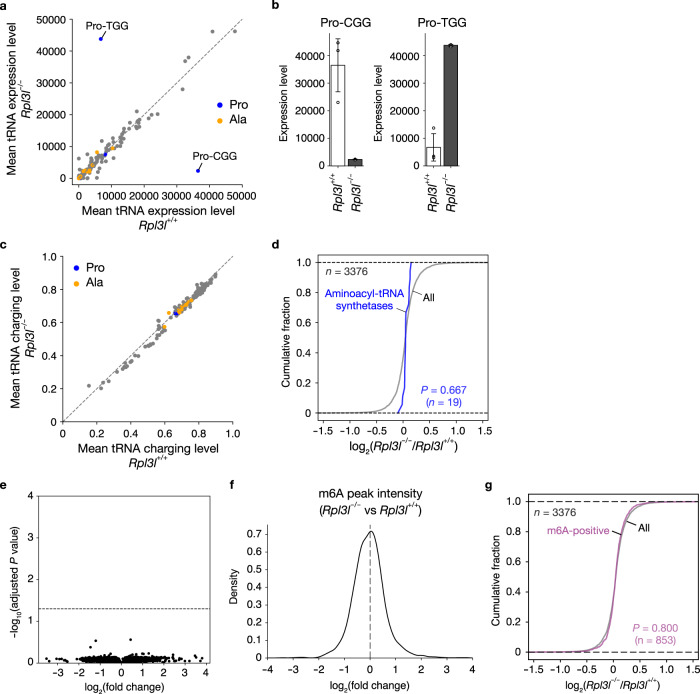
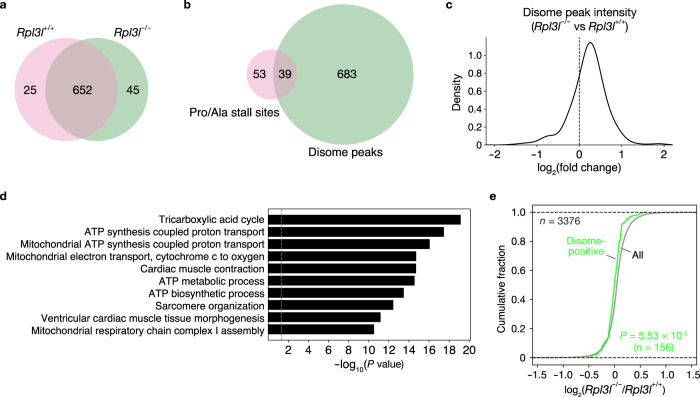
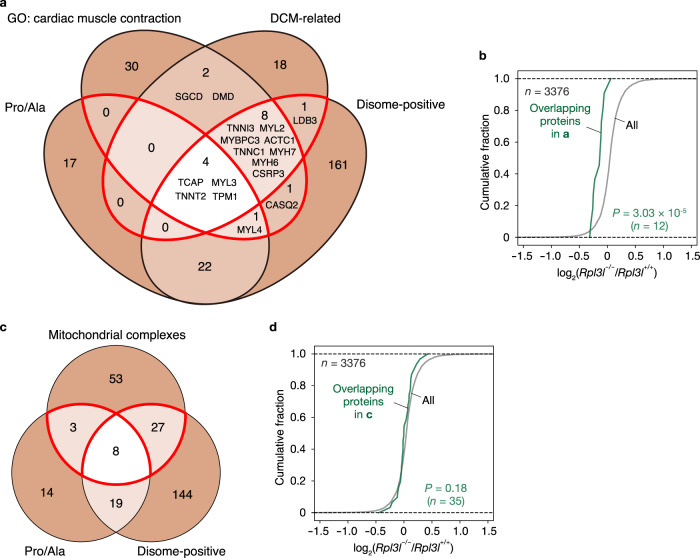
Although several ribosomal protein paralogs are expressed in a tissue-specific manner, how these proteins affect translation and why they are required only in certain tissues have remained unclear. Here we show that RPL3L, a paralog of RPL3 specifically expressed in heart and skeletal muscle, influences translation elongation dynamics. Deficiency of RPL3L-containing ribosomes in RPL3L knockout male mice resulted in impaired cardiac contractility. Ribosome occupancy at mRNA codons was found to be altered in the RPL3L-deficient heart, and the changes were negatively correlated with those observed in myoblasts overexpressing RPL3L. RPL3L-containing ribosomes were less prone to collisions compared with RPL3-containing canonical ribosomes. Although the loss of RPL3L-containing ribosomes altered translation elongation dynamics for the entire transcriptome, its effects were most pronounced for transcripts related to cardiac muscle contraction and dilated cardiomyopathy, with the abundance of the encoded proteins being correspondingly decreased. Our results provide further insight into the mechanisms and physiological relevance of tissue-specific translational regulation.


Conflict of interest statement

The authors declare no competing interests.

Figures

Fig. 1
Fig. 1. Expression pattern and predicted structure of RPL3L.
a Expression patterns of RPL3L and RPL3 in human tissues. The RNA-seq data were obtained from the GTEx portal and are presented as box-and-whisker plots, with the boxes representing the median and upper and lower quartiles and the whiskers representing the maximum and minimum values. Diamond-shaped dots indicate outliers. TPM, transcripts per million. b, c UMAP (Uniform Manifold Approximation and Projection) plots from Seurat analysis of scRNA-seq data for RPL3L and RPL3 expression in the human heart. Data are from GSE183852. Groups corresponding to cardiomyocytes (CM), smooth muscle (SM), fibroblasts (FB), pericytes (P), T cells and natural killer cells (T/NK), macrophages and monocytes (M), endothelium (ET), and endocardium (EC) are enclosed in black frames. d Expression levels of RPL3 and RPL3L in single cells for cardiomyocytes as in b and c. CPM, counts per million. e Heat map showing row-scaled expression of the marker genes for FB and CM as well as of RPL3 and RPL3L for the FB and CM clusters in b and c. f, g Structural comparison for RPL3 and RPL3L. The atomic model of RPL3 is highlighted (magenta) in the model of the human 80S ribosome obtained by cryo-EM (PDB ID: 6IP5) (f). The three fingerlike projections—the NH2-terminal extension (N-term), the W finger, and the basic thumb—of RPL3/RPL3L extend into the core region of the 60S subunit and are situated in close proximity to the CCA terminus of the A-tRNA in the PTC (g). The amino acids that differ between RPL3 and RPL3L is highlighted in orange with their amino acid numbers. h Comparison of amino acid sequences of human (Homo sapiens) RPL3 with those of human RPL3L as well as of RPL3L from other mammalian (Mus musculus and Equus caballus), avian (Gallus gallus), reptile (Pelodiscus sinensis), amphibian (Xenopus laevis), and fish (Tetraodon nigroviridis) species. Amino acids that differ between human RPL3 and the various RPL3L proteins are highlighted in yellow, and those of RPL3L that differ among species are shown in red. The W residue in blue corresponds to W255 of yeast Rpl3.
Fig. 2
Fig. 2. RPL3L-deficient mice manifest impaired cardiac contractility.
a Number and percentage of mice of the indicated genotypes at weaning for the offspring produced by mating male and female heterozygotes for each mutation. b RT-qPCR analysis of Rpl3l and Rpl3 mRNA abundance in the heart and gastrocnemius (GC) of Rpl3l+/+ and Rpl3l−/− mice at 10 weeks of age (n = 5 mice). Rpl3l transcripts were measured with primers targeting either the deleted region (Δ) or the intact 3’UTR. c Number of RPL3 and RPL3L molecules per 80S ribosome as determined by MRM analysis of the polysome fraction from the heart of Rpl3l+/+ and Rpl3l−/− mice at 10 weeks of age (n = 3 mice). d, e Body weight of Rpl3l+/+ (n = 21 mice) and Rpl3l−/− (n = 12 mice) mice at 10 weeks of age and tissue weight for the heart as well as TA, EDL, GC, and Sol muscles of Rpl3l+/+ and Rpl3l−/− mice (n = 4 mice) at 18 to 19 weeks of age (e). f, g Representative images of WGA staining and Masson’s trichrome staining for heart sections from Rpl3l+/+ and Rpl3l−/− mice at 18 to 19 weeks of age (left panels) and quantitative analysis of muscle fiber size and the extent of fibrosis (blue staining) determined from such sections, respectively (n = 4 mice) (right panels). Scale bars, 50 μm (f) and 1 mm (g). h, i Representative echocardiographic images and quantitative analysis of LVWT, LVDd, LVDs, LVFS, and LVEF for Rpl3l+/+ and Rpl3l−/− mice at 18 to 19 weeks of age (n = 6 mice). All quantitative data in bar graphs are means ± s.d. *P  <  0.05, **P  <  0.01, ***P  <  0.005, ****P  <  0.001; ns not significant (unpaired two-tailed Student’s t test). Source data are provided as a Source Data file.
Fig. 3
Fig. 3. Altered elongation dynamics in the RPL3L-ribosome–deficient heart.
a Volcano plot for differential TE as determined by Ribo-seq and RNA-seq analysis (n = 4 mice). The change in TE for each transcript in the heart of Rpl3l−/−mice at 10 weeks of age relative to that for Rpl3l+/+ mice was analyzed with RiboDiff. P values were calculated by chi-square test and adjusted by Benjamini-Hochberg method for multiple comparisons. The gray dashed line indicates an adjusted P value of 0.05. b Fold change in the number of RNA-seq reads (transcriptome) and Ribo-seq footprint reads (translatome) for the Rpl3l−/− heart compared with the control heart (n = 4 mice). The gray dashed lines indicate a log2(fold change) of ±1. Rpl3l isoform1: ENSMUST00000045186.10. Rpl3l isoform2: ENSMUST00000170239.8. c Relative ribosome occupancy at A-site codons in the heart of Rpl3l+/+ and Rpl3l−/− mice (n = 4 mice). Data were aggregated according to all codons for each amino acid. df Ribosome occupancy changes at A-site codons for each amino acid residue or codon, as well as RUST ratio values at A-site codons, in the heart of Rpl3l−/− mice compared with that of control mice (n = 4 mice). g Schematic representation of the CV for ribosome occupancy at the A-site. A delay in translation elongation at a particular codon results in an increase in ribosome occupancy at the A-site, whereas an increase in elongation rate results in a decrease in ribosome occupancy at the A-site. Changes in elongation dynamics therefore lead to changes in the magnitude of the variance of ribosome occupancy, as indicated by the blue and red curves. h Violin plots for the CV of ribosome occupancy at the A-site in the heart of Rpl3l+/+ and Rpl3l−/− mice (n = 4 mice). The inner boxes represent the median and upper and lower quartiles, and the whiskers represent the maximum and minimum values. ****P  <  0.001 (two-tailed Mann-Whitney U test). Source data are provided as a Source Data file.
Fig. 4
Fig. 4. Negative correlation of translation elongation dynamics between conditions of RPL3L overexpression or loss.
a RT-qPCR analysis of Rpl3 and Rpl3l mRNA abundance in C2C12 cells stably expressing RPL3 (RPL3 OE) or RPL3L (RPL3L OE) or in those infected with the corresponding empty retrovirus (n = 3 biologically independent samples). Rpl3 transcripts were measured with primers targeting the coding sequence (CDS) or 3’UTR. Data are means ± s.d. b Number of RPL3 or RPL3L molecules per 80S ribosome as determined by MRM analysis of the polysome fraction from RPL3 OE or RPL3L OE cells (n = 3 biologically independent samples). Data are means±s.d. c Relative ribosome occupancy at A-site codons in RPL3L OE and RPL3 OE cells. Data were aggregated according to all codons for each amino acid (n = 3 biologically independent samples). d Ribosome occupancy changes at A-site codons for each amino acid residue in RPL3L OE or RPL3 OE cells compared with control cells (n = 3 biologically independent samples). e, f Correlation of fold change in ribosome occupancy at A-, P-, and E-site codons for RPL3L OE or RPL3 OE cells (relative to control cells) (n = 3 biologically independent samples) with that for the heart of Rpl3l−/− mice (relative to that of control mice) (n = 4 mice). Spearman’s correlation coefficient (r) with associated P value (two-sided) is indicated for each comparison. Adjusted P values were calculated by the Bonferroni method for multiple comparisons. Gray bands indicate 95% confidence intervals. g Violin plots for the CV of ribosome occupancy at the A-site in RPL3L OE, RPL3 OE, and control cells (n = 3 biologically independent samples). The inner boxes represent the median and upper and lower quartiles, and the whiskers represent the maximum and minimum values. *P  <  0.05, ****P < 0.001, ns (two-tailed Dunnett’s test (a) or Steel-Dwass test (g)). Source data are provided as a Source Data file.
Fig. 5
Fig. 5. Decreased protein expression associated with aberrant translation elongation dynamics in the RPL3L-ribosome–deficient heart.
a Volcano plots of differential ribosome occupancy for Pro and Ala codons in the heart of Rpl3l−/− mice compared with that of control mice (n = 4 mice). P values were calculated by two-sided Student’s t test and adjusted by Benjamini-Hochberg method for multiple comparisons, and the gray dashed lines indicate an adjusted P value of 0.05. b Metagene plots for the regions surrounding Pro/Ala sites with altered elongation dynamics for footprints of Ribo-seq analysis performed with the heart of Rpl3l+/+ or Rpl3l−/− mice (n = 4 mice). The average of replicates is shown. c GO analysis of genes with significantly altered elongation dynamics at Pro or Ala codons. P values were calculated as EASE scores, modified Fisher’s exact P values. The 10 GO terms with the smallest P values are listed. d Distribution of ribosome footprint occupancy at the A-site along the coding regions of Myl4 and Atp5o mRNAs in the heart of Rpl3l+/+ and Rpl3l−/− mice (n = 4 mice). The average of four replicates is shown. RPM, reads per million reads. e Cumulative fraction for fold change in protein expression in the heart of Rpl3l−/− mice compared with that of control mice (n = 4 mice). The expression level of proteins was analyzed by DIA-based MS, and the results are shown for all proteins (n = 3376) and for those encoded by the genes with differential ribosome occupancy at Pro or Ala codons. The P value was calculated by the two-tailed Mann-Whitney U test. Source data are provided as a Source Data file.
Fig. 6
Fig. 6. Abundance and aminoacylation status of tRNAs and m6A status of mRNAs in the heart lacking RPL3L.
ac Mean tRNA abundance, abundance of tRNA-Pro-CGG and tRNA-Pro-TGG, and mean tRNA charging level as determined by Charged DM-tRNA-seq in the heart of Rpl3l+/+ and Rpl3l−/− mice (n = 3 mice). Data in b are means ± s.d. d Cumulative fraction for fold change in protein expression as determined by DIA-based MS in the heart of Rpl3l−/− mice compared with that of control mice (n = 4 mice). The results are shown for all proteins and aminoacyl-tRNA synthetases. The P value was calculated with the two-tailed Mann-Whitney U test. e Volcano plot of differential m6A peak levels as determined by m6A-seq in the heart of Rpl3l−/− mice compared with that of control mice (n = 3 mice). P values were calculated by two-sided Student’s t test and adjusted by Benjamini-Hochberg method for multiple comparisons, and the gray dashed line indicates an adjusted P value of 0.05. f Histogram for fold change in m6A peak intensity in the heart of Rpl3l−/− mice compared with that of control mice (n = 3 mice). The black dotted line corresponds to a fold change of 1. g Cumulative fraction for fold change in protein expression as determined by DIA-based MS in the heart of Rpl3l−/− mice compared with that of control mice (n = 4 mice). Results are shown for all proteins and for those encoded by genes with m6A peaks. The P value was calculated with the two-tailed Mann-Whitney U test. Source data are provided as a Source Data file.
Fig. 7
Fig. 7. Increased ribosome collision in the RPL3L-deficient heart.
a, b Venn diagrams for the number of disome peaks in the heart of Rpl3l+/+ or Rpl3l−/− mice (n = 4 mice) (a) as well as for the number of Pro/Ala codons with significantly increased ribosome occupancy at the A-site in the heart of Rpl3l−/− mice compared with that of control mice (b). c Histogram for fold change in disome peak intensity in the heart of Rpl3l−/− mice compared with that of control mice (n = 4 mice). The black dotted line corresponds to a fold change of 1. d GO analysis of genes with disome peaks in the heart of Rpl3l+/+ or Rpl3l−/− mice. P values were calculated as EASE scores, modified Fisher’s exact P values. The 10 GO terms with the smallest P values are listed. e Cumulative fraction for the fold change in protein expression in the heart of Rpl3l−/− mice compared with that of control mice (n = 4 mice). The expression level of proteins was analyzed by DIA-based MS, and the results are shown for all proteins (n = 3376) and for those with disome peaks (n = 156) in a. The P value was calculated with the two-tailed Mann-Whitney U test. Source data are provided as a Source Data file.
Fig. 8
Fig. 8. Loss of RPL3L attenuates the expression of proteins related to cardiac muscle contraction.
a Venn diagram showing the number of genes related to cardiac muscle contraction or dilated cardiomyopathy (DCM) as well as of those with differential ribosome occupancy at Pro/Ala codons or with disome peaks in the heart of Rpl3l+/+ or Rpl3l−/− mice (n = 4 mice). b Cumulative fraction for the fold change in protein expression in the heart of Rpl3l−/− mice compared with that of control mice (n = 4 mice). The expression level of proteins was analyzed by DIA-based MS, and the results are shown for all proteins (n = 3376) and for those encoded by the overlapping genes enclosed by the red boundaries in a (n = 12). The P value was calculated with the two-tailed Mann-Whitney U test. c Venn diagram showing the number of genes for mitochondrial respiratory complex subunits encoded by the nuclear genome as well as of those with differential ribosome occupancy at Pro/Ala codons or with disome peaks in the heart of Rpl3l+/+ or Rpl3l−/− mice (n = 4 mice). d Cumulative fraction for the fold change in protein expression in the heart of Rpl3l−/− mice compared with that of control mice (n = 4 mice). The expression level of proteins was analyzed by DIA-based MS, and the results are shown for all proteins (n = 3376) and for those encoded by the overlapping genes enclosed by the red boundaries in c (n = 35). The P value was calculated with the two-tailed Mann-Whitney U test. Source data are provided as a Source Data file.

References

    1. Thomson E, Ferreira-Cerca S, Hurt E. Eukaryotic ribosome biogenesis at a glance. J. Cell Sci. 2013;126:4815–4821. doi: 10.1242/jcs.111948. - DOI - PubMed
    1. Genuth NR, Barna M. The discovery of ribosome heterogeneity and its implications for gene regulation and organismal life. Mol. Cell. 2018;71:364–374. doi: 10.1016/j.molcel.2018.07.018. - DOI - PMC - PubMed
    1. Li D, Wang JL. Ribosome heterogeneity in stem cells and development. J. Cell Biol. 2020;219:e202001108. doi: 10.1083/jcb.202001108. - DOI - PMC - PubMed
    1. Norris K, Hopes T, Aspden JL. Ribosome heterogeneity and specialization in development. Wiley Interdiscip. Rev. Rna. 2021;12:e1644. doi: 10.1002/wrna.1644. - DOI - PMC - PubMed
    1. Gay DM, Lund AH, Jansson MD. Translational control through ribosome heterogeneity and functional specialization. Trends Biochem. Sci. 2022;47:66–81. doi: 10.1016/j.tibs.2021.07.001. - DOI - PubMed

Publication types