. 2023 Apr 20;14(1):2176.
doi: 10.1038/s41467-023-37630-6.

Integrated transcriptome landscape of ALS identifies genome instability linked to TDP-43 pathology

Affiliations

Integrated transcriptome landscape of ALS identifies genome instability linked to TDP-43 pathology

Oliver J Ziff et al. Nat Commun. .

Abstract

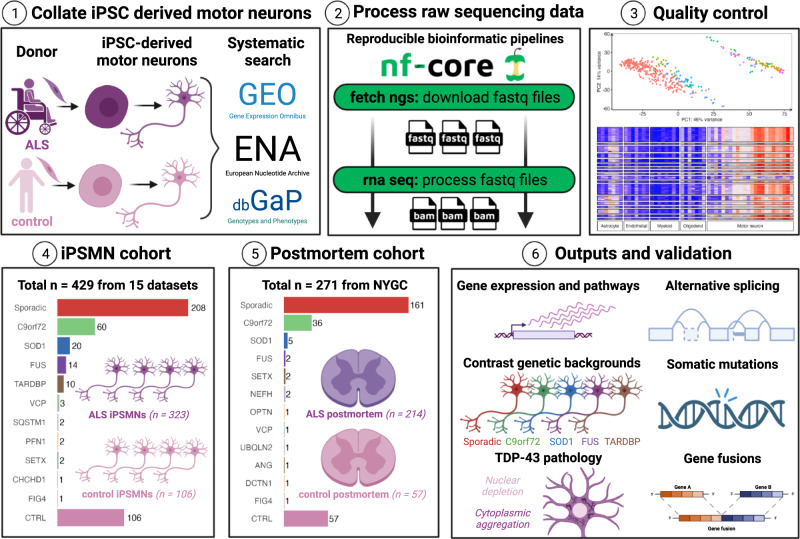
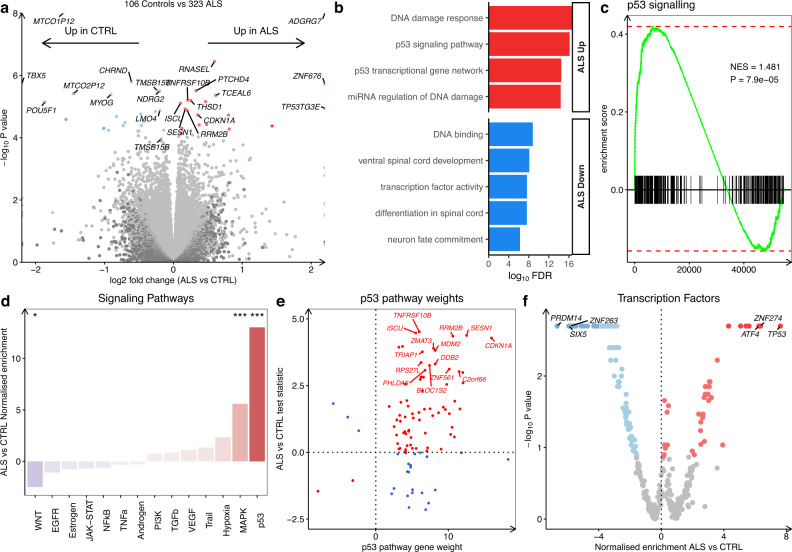
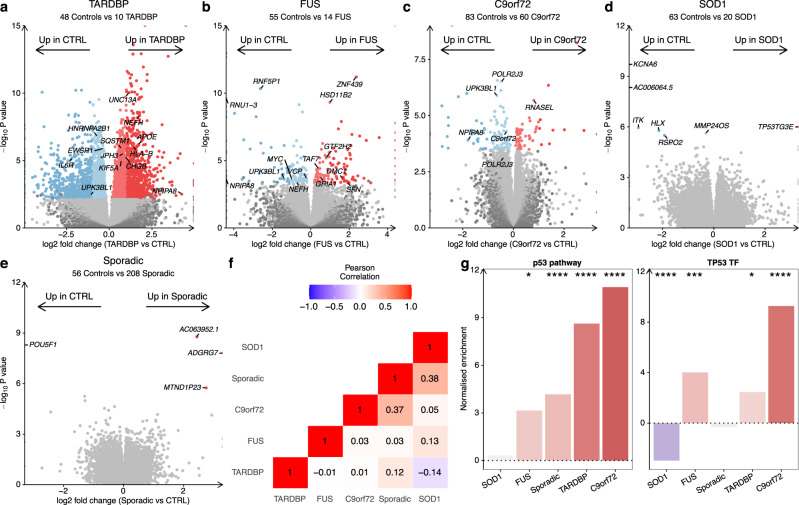
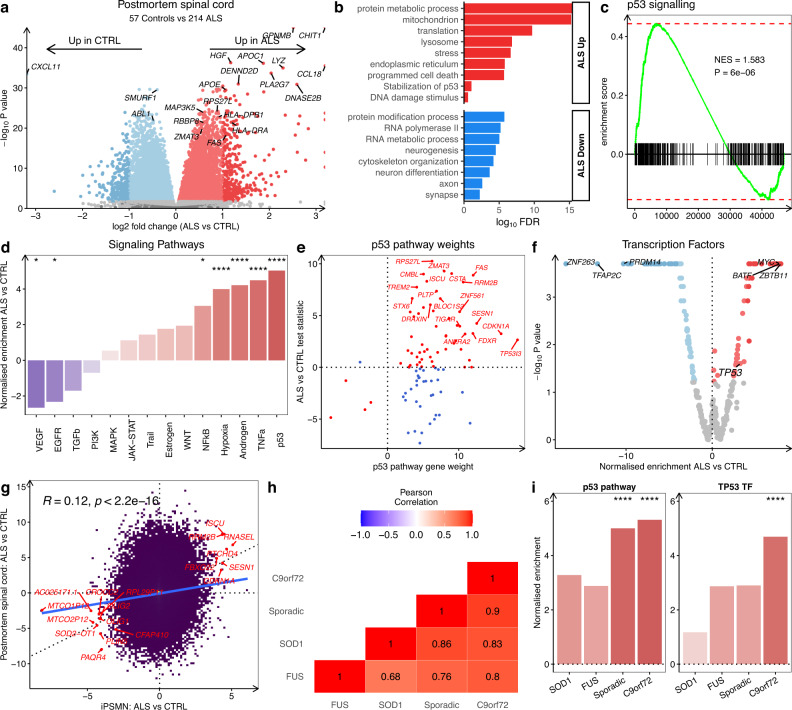
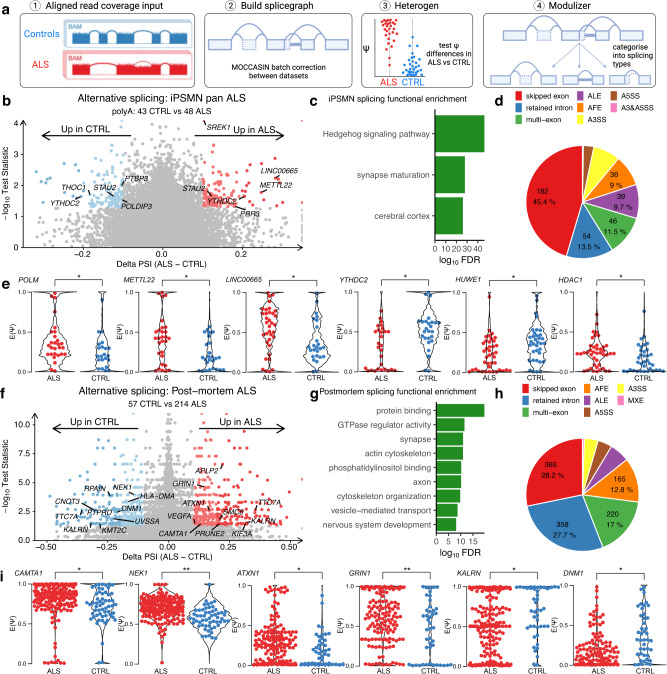
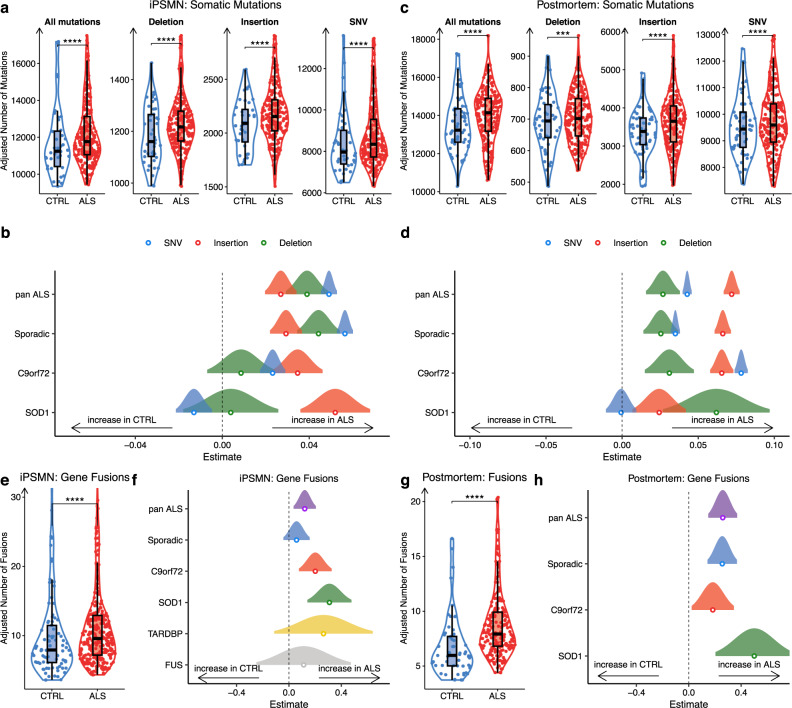
Amyotrophic Lateral Sclerosis (ALS) causes motor neuron degeneration, with 97% of cases exhibiting TDP-43 proteinopathy. Elucidating pathomechanisms has been hampered by disease heterogeneity and difficulties accessing motor neurons. Human induced pluripotent stem cell-derived motor neurons (iPSMNs) offer a solution; however, studies have typically been limited to underpowered cohorts. Here, we present a comprehensive compendium of 429 iPSMNs from 15 datasets, and 271 post-mortem spinal cord samples. Using reproducible bioinformatic workflows, we identify robust upregulation of p53 signalling in ALS in both iPSMNs and post-mortem spinal cord. p53 activation is greatest with C9orf72 repeat expansions but is weakest with SOD1 and FUS mutations. TDP-43 depletion potentiates p53 activation in both post-mortem neuronal nuclei and cell culture, thereby functionally linking p53 activation with TDP-43 depletion. ALS iPSMNs and post-mortem tissue display enrichment of splicing alterations, somatic mutations, and gene fusions, possibly contributing to the DNA damage response.


Conflict of interest statement

N.M. has stock options in and has consulted for Achilles Therapeutics and holds European patents relating to targeting neoantigens (PCT/EP2016/ 059401), identifying patient response to immune checkpoint blockade (PCT/ EP2016/071471), determining HLA LOH (PCT/GB2018/052004), predicting survival rates of patients with cancer (PCT/GB2020/050221). The remaining authors have no conflicts of interest.

Figures

Fig. 1
Fig. 1. Study overview.
Schematic summarising our analytic framework using iPSC-derived motor neurons (iPSMNs) and post-mortem tissue to interrogate perturbations across the spectrum of ALS. Made with BioRender.
Fig. 2
Fig. 2. Differential gene expression in ALS versus control iPSMNs.
a Volcano plot of differential gene expression in ALS versus control iPSMNs using the Wald test. b Functionally overrepresented terms in up-regulated (red) and down-regulated (blue) differentially expressed genes using the hypergeometric test. c GSEA of signal transduction by p53 (GO:0072331, n = 264) in ALS versus control using the permutation test. NES, normalized enrichment score. d PROGENy signalling pathway activities in ALS versus control using the weighted mean method. Pathways increased in ALS are red and pathways decreased are blue. *** represents P < 0.0001 and *P < 0.05 (p53 p < 0.001, MAPK p < 0.001, WNT p = 0.03). e Expression changes of p53 signalling pathway genes in ALS versus control according to their PROGENy weights. Genes increasing p53 activity in ALS are red whilst genes decreasing p53 activity in ALS are blue. f Activities of 429 transcription factors in DoRothEA inferred from their regulon expression changes in ALS versus control. The normalised enrichment score in ALS versus control (x-axis) is plotted according to the enrichment test p-value (y-axis).
Fig. 3
Fig. 3. Gene expression changes in each ALS genetic background.
ae Volcano plots comparing ALS iPSMNs to controls in each ALS genetic background. Genes coloured red are significantly increased in the ALS subgroup and genes coloured blue are decreased in the ALS subgroup using the Wald test. f Heatmap showing the Pearson’s correlation coefficient for transcriptome-wide changes between each genetic background. g PROGENy p53 signalling pathway (left) and Dorothea TP53 transcription factor regulon (right) activities amongst each of the genetic backgrounds independently using the weighted mean method. **** represents P < 0.0001, ***P < 0.001, **P < 0.01, *P < 0.05.
Fig. 4
Fig. 4. Post-mortem spinal cord shows p53 activation.
a Volcano plot of differential gene expression in ALS versus control post-mortem spinal cord using the Wald test. b Functionally enriched terms in up-regulated (red) and down-regulated (blue) differentially expressed genes using the hypergeometric test. c GSEA for signal transduction by p53 in ALS versus control post-mortem spinal cord using the permutation test. NES, normalized enrichment score. d PROGENy signalling pathway activities in ALS versus control post-mortem tissue using the weighted mean method. Pathways increased in ALS are red and pathways decreased are blue. e Expression changes of p53 signalling pathway genes in ALS versus control according to their PROGENy weights. Genes in ALS increasing p53 activity are red and genes decreasing p53 activity are blue. f Activities of 429 transcription factors in DoRothEA inferred from their regulon expression changes in ALS versus control post-mortem tissue using the enrichment test. g Scatterplot of ALS vs control gene expression changes in iPSMNs (x-axis) against post-mortem tissue (y-axis) using the Wald test statistic. h Heatmap showing the Pearson’s correlation coefficient for transcriptome-wide changes between each genetic background in post-mortem tissue. i PROGENy p53 signalling pathway (left) and DoRothEA TP53 transcription factor regulon activity (right) amongst each of the genetic backgrounds in post-mortem tissue using the weighted mean method. *** represents P < 0.0001 and *P < 0.05.
Fig. 5
Fig. 5. Alternative splicing alterations in ALS iPSMNs.
a Splicing analysis of ALS and control iPSMNs with MAJIQ. b, f Differential splicing in ALS versus control iPSMNs and post-mortem using the TNOM test. Events with P < 0.05 and Δ PSI (ALS - CTRL) > 0.1 are coloured red and < −0.1 blue. c, g Functionally enriched terms amongst genes with differential alternative splicing in iPSMNs and post-mortem using the hypergeometric test. d, h Categorisation of differential local splice variants into basic splicing types using MAJIQ modulizer in iPSMNs and post-mortem. e, i Violin plots showing PSI values (y-axis) for ALS (red) and control samples (blue) for splice events in iPSMNs and post-mortem with p-values from the TNOM test. ** represents P < 0.01 and *P < 0.05.
Fig. 6
Fig. 6. ALS iPSMNs and post-mortem tissue accumulate somatic mutations and gene fusions.
a Violin plots showing the partial residuals of somatic mutations, controlling for age and read depth, identified in Answer ALS iPSMNs in ALS (red, n = 238) and CTRL (blue, n = 42) samples, for all mutation types, insertions, deletions, and single-nucleotide variants (SNV). Statistics are from the generalised linear model Wald test using a Poisson distribution. b Forest plot showing the generalised linear model point estimate and 95% confidence interval of changes in mutation types (SNV, blue; insertion, red; deletion, green) in ALS genetic subgroups versus controls. The vertical dashed line indicates no difference, to the right of the dashed line indicates an increase in ALS. c, d As for (a, b) except in NYGC post-mortem spinal cord samples (n = 214 ALS, n = 57 controls). In addition to age and read depth, the sequencing instrument is also controlled for. e Violin plots showing the partial residuals of gene fusions in CTRL (blue, n = 90) and ALS (red, n = 306) in paired-end sequenced iPSMNs, controlling for age, read depth and dataset. Statistics are from the generalised linear model Wald test using a Poisson distribution. f Forest plot showing the generalised linear model point estimate and 95% confidence interval changes in each genetic subtype versus controls. g, h As for (e, f) except in post-mortem (n = 214 ALS, n = 57 controls), controlling for age, read depth, dataset and sequencing instrument. In the boxplots, whiskers (error bars) represent 1.5 times the interquartile range, the hinges correspond to the first and third quartiles, and the centre represents the median. **** represents P < 0.0001, *** P < 0.001, **P < 0.01, *P < 0.05.

References

    1. Brown RH, Al-Chalabi A. Amyotrophic Lateral Sclerosis. N. Engl. J. Med. 2017;377:162–172. doi: 10.1056/NEJMra1603471. - DOI - PubMed
    1. Kiernan MC, et al. Improving clinical trial outcomes in amyotrophic lateral sclerosis. Nat. Rev. Neurol. 2020;17:104–118. doi: 10.1038/s41582-020-00434-z. - DOI - PMC - PubMed
    1. Neumann M, et al. Ubiquitinated TDP-43 in frontotemporal lobar degeneration and amyotrophic lateral sclerosis. Science. 2006;314:130–133. doi: 10.1126/science.1134108. - DOI - PubMed
    1. Mehta PR, et al. The impact of age on genetic testing decisions in amyotrophic lateral sclerosis. Brain. 2022;145:4440–4447. doi: 10.1093/brain/awac279. - DOI - PMC - PubMed
    1. Shepheard SR, et al. Value of systematic genetic screening of patients with amyotrophic lateral sclerosis. J. Neurol. Neurosurg. Psychiatry. 2021;92:510–518. doi: 10.1136/jnnp-2020-325014. - DOI - PMC - PubMed

Publication types

MeSH terms