. 2023 Apr 20;14(1):2271.
doi: 10.1038/s41467-023-37831-z.

Glucocorticoid activation of anti-inflammatory macrophages protects against insulin resistance

Affiliations

Glucocorticoid activation of anti-inflammatory macrophages protects against insulin resistance

Giorgio Caratti et al. Nat Commun. .

Abstract

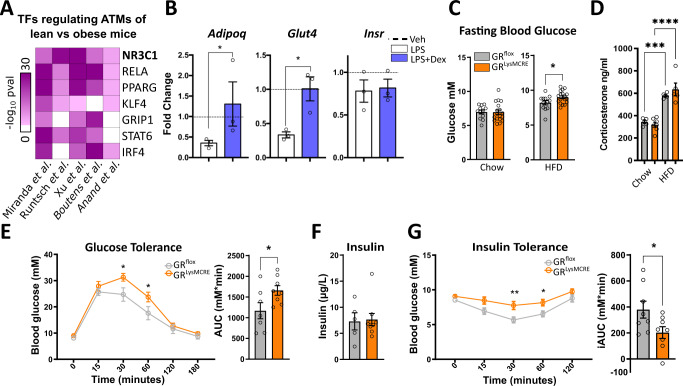
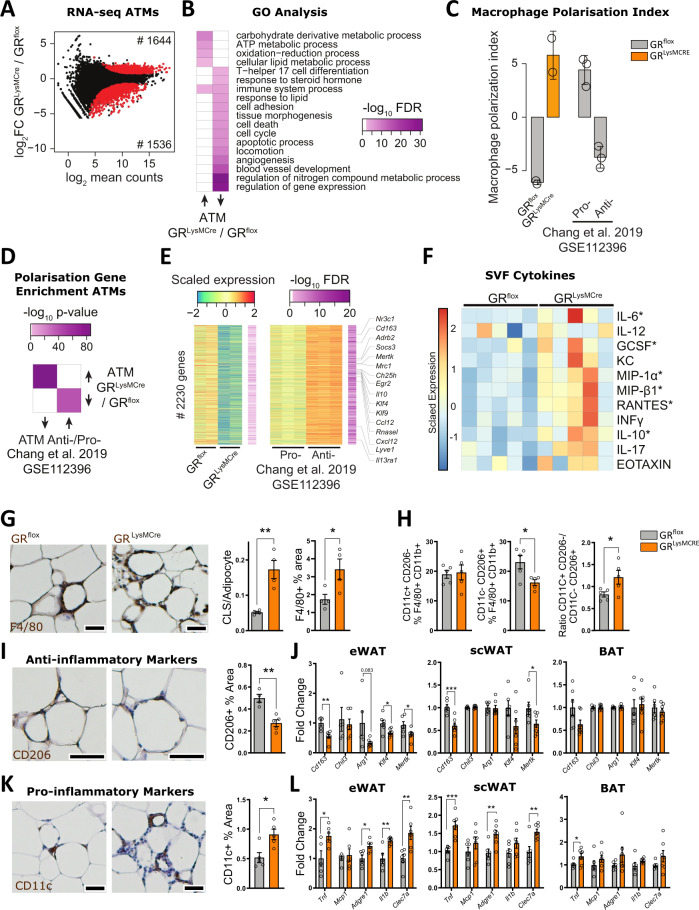
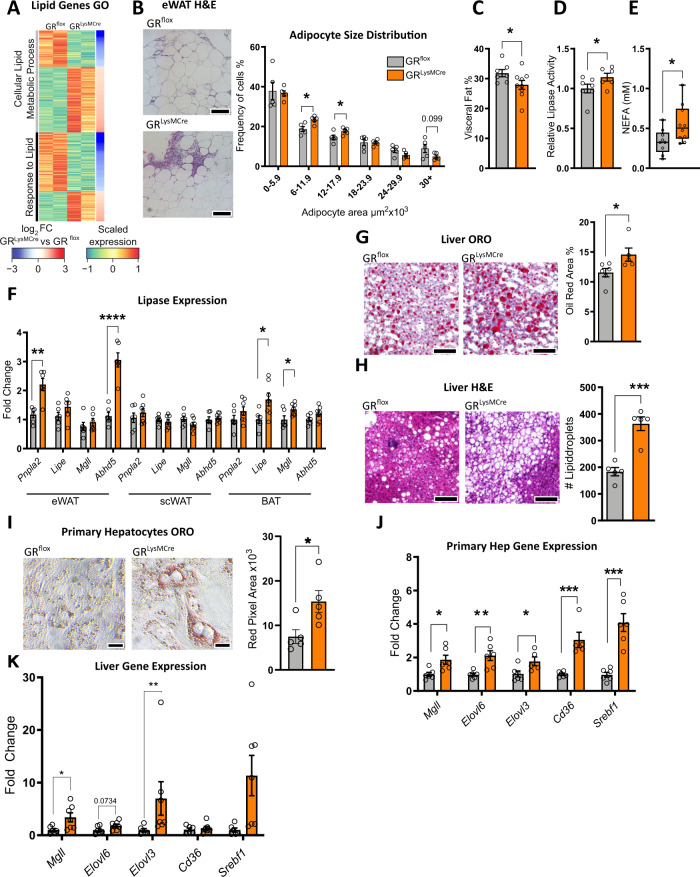
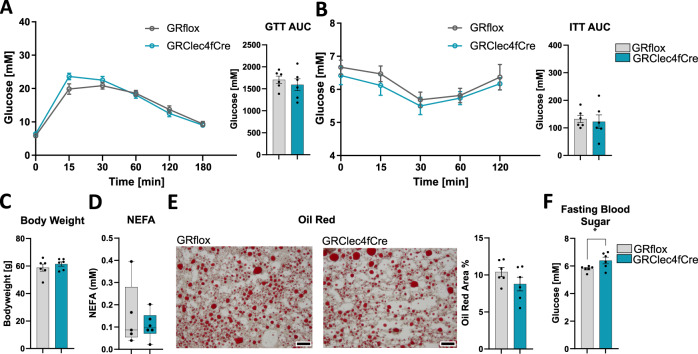
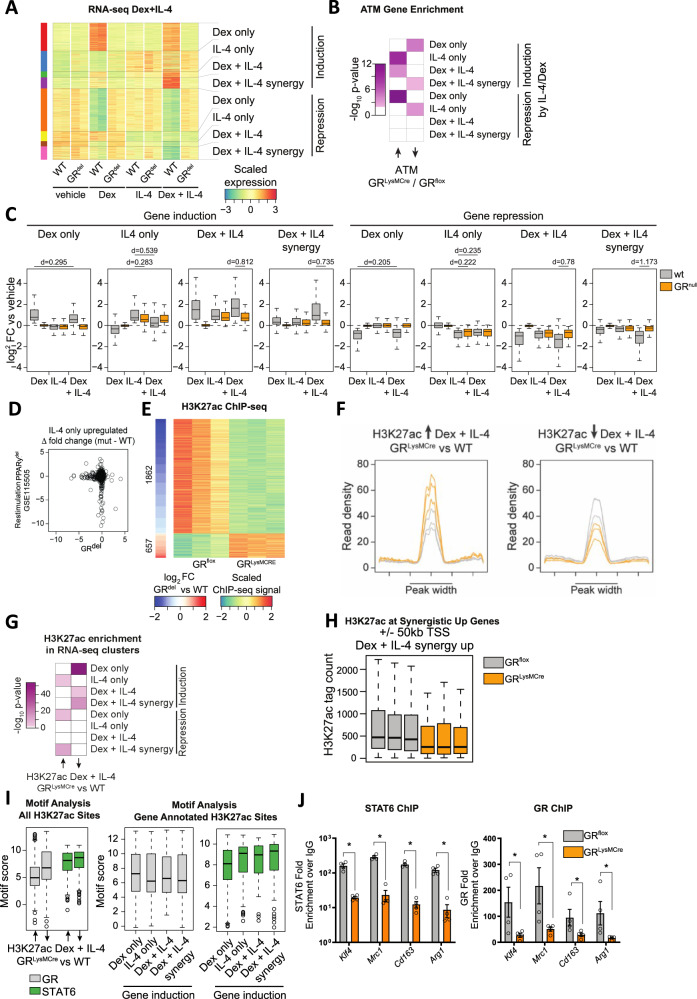
Insulin resistance (IR) during obesity is linked to adipose tissue macrophage (ATM)-driven inflammation of adipose tissue. Whether anti-inflammatory glucocorticoids (GCs) at physiological levels modulate IR is unclear. Here, we report that deletion of the GC receptor (GR) in myeloid cells, including macrophages in mice, aggravates obesity-related IR by enhancing adipose tissue inflammation due to decreased anti-inflammatory ATM leading to exaggerated adipose tissue lipolysis and severe hepatic steatosis. In contrast, GR deletion in Kupffer cells alone does not alter IR. Co-culture experiments show that the absence of GR in macrophages directly causes reduced phospho-AKT and glucose uptake in adipocytes, suggesting an important function of GR in ATM. GR-deficient macrophages are refractory to alternative ATM-inducing IL-4 signaling, due to reduced STAT6 chromatin loading and diminished anti-inflammatory enhancer activation. We demonstrate that GR has an important function in macrophages during obesity by limiting adipose tissue inflammation and lipolysis to promote insulin sensitivity.


Conflict of interest statement

The authors declare no competing interests.

Figures

Fig. 1
Fig. 1. GR in macrophages protects against insulin resistance.
A Differentially expressed genes (padj < 0.05) of published expression datasets from macrophages analyzed by LISA to predict regulatory transcription factors. B In vitro differentiated adipocytes from stromal vascular fraction (SVF) were co-cultured with bone marrow-derived macrophages (BMDMs) for 24 h. Macrophages were pretreated with vehicle, LPS (100 ng/ml), or LPS + dex (100 nM) for 24 h, followed by washout before co-culturing. Adipocytes were separated via MACS and gene expression was quantified by qPCR relative to vehicle control (dotted line) (n = 3, N describes macrophages from individual mice). C Blood glucose was analyzed before and after 29 weeks of a 60% high-fat diet (GRflox: n = 12, GRLysMCre: n = 18, N describes individual mice). D Corticosterone levels were measured by MS from lean and obese GRflox and GRLysMCre mice (GRflox: n = 5, GRLysMCre (lean): n = 7, GRLysMCre (obese): n = 5). E Overnight fasted obese mice were given 2 mg/g glucose i.p., and blood glucose levels were traced for 180 min. The area under the curve, right (GRflox: n = 7, GRLysMCre: n = 8). F After cull, fasted insulin levels were analyzed in serum by ELISA (GRflox: n = 5, GRLysMCre: n = 9, N describes individual mice). G Mice were fasted for 4 h, and given 0.5 µ i.U./g insulin i.p.; blood glucose levels were traced for 120 min. The area above the curve, right (n = 7–8). Data show mean ± SEM. Statistical analysis via two-tailed Student’s t-test (B, C, D, E AUC, G, G AUC) or two-way ANOVA with repeated measures using a Bonferroni post-hoc test (D, F), Wilcoxon rank-sum test (A). Exact p values B Adipoq: 0.0500, Glut4: 0.0101, C 0.0376, D Chow vs HFD GRflox: 0.0003, Chow vs HFD GRLysMCre: <0.0001, E 30 min: 0.0032, 60 min: 0.0057, AUC: 0.0222, G 30 min: 0.0022, 60 min: 0.0040, iAUC: 0.0052.
Fig. 2
Fig. 2. GR in macrophages protects against adipose tissue inflammation.
A MA plot of RNA-seq data from eWAT-derived ATMs of obese GRflox and GRLysMCre mice (n = 2). Red dots show differentially expressed genes (padj <0.01). B Heatmap showing gene ontology enrichment of genes with higher (left) and lower (right) expression in ATMs from GRLysMCre compared to GRflox mice from data shown in (A). C Macrophage polarization index based on RNA-seq counts from GRflox and GRLysMCre ATMs shown in (A) and pro- and anti-inflammatory ATMs from eWAT of obese mice (n = 2–3). D Heatmap depicting enrichment of up- and downregulated genes between GRLysMCre vs. GRflox ATMs shown in (A) and anti- vs. pro-inflammatory ATMs using a one-sided hypergeometric test. E Heatmap of 2230 genes with decreased comparing GRLysMCre vs. GRflox ATMs from the analysis shown in (A) and increased expression pattern comparing anti- vs. pro-inflammatory ATMs. Macrophage polarization genes are highlighted. F SVF isolated from eWAT of obese GRflox and GRLysMCre mice was cultured overnight, and the supernatant was analyzed by multiplex or ELISA (INFy) (n = 5). G eWAT was stained for F4/80 by IHC, and quantified (right). Crown-like structures (CLS) were quantified (left) (n = 4, N describes individual mice). H SVF isolated from eWAT was analyzed by FACS for a fraction of pro-inflammatory (CD11c+;CD206) and anti-inflammatory (CD11c;CD206+) cells per F4/80 +/CD11b+ macrophages and their ratio (n = 5, N describes individual mice). I eWAT was stained for CD206 by IHC, and quantified (GRflox n = 4, GRLysMCre n = 5, N describes individual mice). J mRNA expression of anti-inflammatory marker genes of eWAT, scWAT, and BAT was assessed by RT-qPCR (n = 5–6 eWAT, 6–7 scWAT and BAT, N describes individual mice). K eWAT was stained for CD11c by IHC and quantified (n = 5, N describes individual mice). L eWAT, scWAT, and BAT gene expression for inflammatory markers were analyzed by RT-qPCR (eWat GRflox: Tnf n = 5, Mcp1 n = 6, Adgre1 n = 6, Il1b n = 5, Clec7a n = 6; GRLysMCre: Tnf n = 6, Mcp1 n = 6, Adgre1 n = 6, Il1b n = 6, Clec7a n = 6. scWat GRflox: Tnf n = 6, Mcp1 n = 6, Adgre1 n = 6, Il1b n = 6, Clec7a n = 6; GRLysMCre: Tnf n = 6, Mcp1 n = 6, Adgre1 n = 6, Il1b n = 6, Clec7a n = 6. Bat GRflox: Tnf n = 5, Mcp1 n = 6, Adgre1 n = 6, Il1b n = 5, Clec7a n = 6; GRLysMCre: Tnf n = 6, Mcp1 n = 6, Adgre1 n = 5, Il1b n = 6, Clec7a n = 6, N describes individual mice). Data show mean ± SEM. Statistical analysis via two-tailed Student’s t-test and Deseq with Benjamini–Hochberg correction padj <0.01 (A); p < 0.05*, p < 0.01**, p < 0.001***, p < 0.0001****. Images were obtained at ×10 original magnification. Exact p values: G CLS: 0.0033, F4/80 Area: 0.0396, H 0.0235, I 0.0019, J eWat: Cd163: 0.0023, Arg1: 0.0830, Klf4: 0.0143, Mertk: 0.0406, scWat: Cd163: 0.0007, Mertk: 0.0493, K 0.0130, L eWat: Tnf: 0.0217, Adgre1: 0.0101, Il1b: 0.0046, Clec7a: 0.0079, scWat: Tnf: 0.0004, Adgre1: 0.0061, Clec7a: 0.0054, BAT: Tnf: 0.0410. Scale bar: 100 µm in (G, I, K).
Fig. 3
Fig. 3. Macrophage GR regulates adipose tissue lipolysis to restrict hepatic steatosis.
A Heatmap depicting genes differentially expressed between GRflox and GRLysMCre ATMs belonging to the GO terms Cellular Lipid Metabolic Process and Response to Lipid. B eWAT was stained via H&E and adipocyte cell area was quantified (n = 5, N describes individual mice). C Visceral fat percentage was quantified using in vivo µCT (n = 5, N describes individual mice). D eWAT lipase activity was measured using an enzymatic assay (GRflox n = 7, GRLysMCre n = 6, N describes individual mice). E Serum levels of NEFA measured by Wako NEFA assay (GRflox n = 9, GRLysMCre n = 10, N describes individual mice). F Expression of a panel of lipase genes was analyzed by qPCR in various adipose tissue depots (eWat GRflox: Pnpla2 n = 6, Lipe n = 6, Mgll n = 6, Abhd5 n = 6, GRLysMCre: Pnpla2 n = 5, Lipe n = 5, Mgll n = 5, Abhd5 n = 5. scWat GRflox: Pnpla2 n = 6, Lipe n = 6, Mgll n = 6, Abhd5 n = 6, GRLysMCre: Pnpla2 n = 6, Lipe n = 6, Mgll n = 6, Abhd5 n = 6. Bat GRflox: Pnpla2 n = 6, Lipe n = 6, Mgll n = 6, Abhd5 n = 6, GRLysMCre: Pnpla2 n = 6, Lipe n = 6, Mgll n = 6, Abhd5 n = 6, N describes individual mice). The liver of obese GRLysMCre and GRflox mice were analyzed by G oil red o and (GRflox n = 6, GRLysMCre n = 5, N describes individual mice). H H&E, and quantified (GRflox n = 5, GRLysMCre n = 5, N describes individual mice). Primary hepatocytes were treated with conditioned media from BMDM-adipocyte co-cultures for 24 h and I lipid accumulation was analyzed by oil red o staining (n = 5, N describes hepatocytes isolated from individual mice), or J gene expression was analyzed by RT-qPCR (n = 6, N describes hepatocytes isolated from individual mice). K Gene expression of key genes for lipid metabolism from liver RNA isolated from obese GRflox and GRLysMCre mice (GRflox: Mgll n = 6, Elovl6 n = 6, Elovl3 n = 6, Cd36 n = 6, Srebf1 n = 6, GRLysMCre: Mgll n = 6, Elovl6 n = 6, Elovl3 n = 5, Cd36 n = 5, Srebf1 n = 6). Data show mean ± SEM. Boxplots show median, IQR, and min/max values. Statistical analysis via two-tailed (B, E, F, G, H, I, J), or one-tailed (C, D) Student’s t-test. Images were obtained at ×10 original magnification. Exact p values: B 0.0151, 0.0483, 0.0998, C 0.0358, D 0.0400, E 0.0315, F eWat: Pnpla2: 0.0011, Abdh5: <0.0001, Bat: Lipe: 0.0273, Mgll: 0.0328, G 0.0415. H 0.0003, I 0.0263, J Mgll: 0.0151, Elovl6: 0.0040, Elovl3: 0.0372, Cd36: 0.0009, Srebf1: 0.0002, K Mgll: 0.0350, Elovl6: 0.0734, Elovl3: 0.0047, Srebf1: 0.0082. Scale bar: 100 µm in (B), (G), (H); 25 µm in (I).
Fig. 4
Fig. 4. Selective elimination of GR in Kupffer cells does not increase IR, lipolysis, and steatosis after HFD.
A Overnight fasted obese, 29 weeks of HFD, GRflox, and GRClec4fCre mice were given 2 mg/g glucose i.p., and blood glucose levels were traced for 180 min. The area under the curve, right (n = 6). B Obese GRflox and GRClec4fCre mice were fasted for 4 h, and given 0.5 µ i.U./g insulin i.p., and blood glucose levels were traced for 120 min. The area above the curve, right (n = 6). C Body weight at the time of dissection from obese GRflox and GRClec4fCre mice (n = 6). D Serum NEFA (n = 6). E Oil red o quantified from livers of obese GRflox and GRClec4fCre mice (n = 6). F Fasting blood sugar (glucose) measured after overnight fast (n = 6). Data show mean ± SEM. Boxplots show median, IQR, and min/max values. Statistical analysis via two-tailed Student’s t-test (A AUC: 0.4889, B AUC: 0,7386, C, D, E, F) or two-way ANOVA with repeated measures using a Bonferroni post-hoc test (A 0.4229, B 0.5197). Exact p values F 0.0476. Scale bar: 200 µm in (D).
Fig. 5
Fig. 5. GR regulates macrophage alternative activation through cooperation with STAT6.
A Heatmap depicting distinct patterns of differentially expressed genes (padj <0.01) in RNA-seq data of WT or GRdel macrophages treated with either vehicle (DMSO), dex (100 nM), IL-4 (20 ng/ml), or IL-4 + dex for 2 h (n = 2). B Heatmap showing enrichment of up- and downregulated genes comparing GRLysMCre vs. GRflox ATMs from Fig. 2A for dex only, IL-4 only, dex + IL-4 or dex + IL-4 synergistic genes in (B) using a one-sided hypergeometric test. C Boxplots depicting log2 fold changes with respect to vehicle control for dex only, IL-4 only, dex + IL-4, or dex + IL-4 synergistic genes in (A). The effect size for selected comparisons is indicated as Cohen’s d (n = 2). D Scatter plot quantifying the lack of gene induction by IL-4 stimulation upon deletion of PPARγ over deletion of GR for all genes of the IL-4 only upregulated gene cluster from (A). E Heatmap depicting H3K27ac ChIP-seq signal for enhancers with significantly different H3K27ac levels (padj <0.05) between GRLysMCre and WT BMDMs treated with dex + IL-4 (n = 3). F Density plot showing the distribution of H3K27ac signals at sites that gain and lose signal in GRflox and GRLysMCre macrophages. G Enrichment of genes nearby (±50 kb from TSS) enhancers with increased or decreased H3K27ac levels between GRLysMCre and GRflox macrophages in (E) for dex only, IL-4 only, dex + IL-4 or dex + IL-4 synergistic genes in (A). Hypergeometric test one-sided.  H H3K27ac tag count at enhancers with dynamic H3K27ac levels between GRLysMCre and GRflox macrophages in (E) in the vicinity (±50 kb from TSS) of genes showing synergistic upregulation by dex + IL-4 in (A). I HOMER-based motif score for GR and STAT6 at enhancers with loss and gain of H3K27ac ChIP-seq signal from (E) (left panel) and subgrouping those enhancers based on proximity to genes with dex only, IL-4 only, dex + IL-4, and dex + IL-4 synergistic regulation patterns from (A) (n for enhancers going up: 1862, n for enhancers going down 657). J GRflox or GRLysMCre BMDMs were treated with IL-4 + dex for 2 h, and STAT6 or GR DNA binding was analyzed by ChIP-PCR (n = 4, N describes macrophages isolated from individual mice). Data show mean ± SEM. Boxplots show median, IQR, and min/max values excluding outliers. Statistical analysis via, Mann–Whitney test, two-sided, Deseq with Benjamini–Hochberg correction padj <0.01 (A); P < 0.05*, p < 0.01**, p < 0.001***, p < 0.0001**** Exact p values: J Stat6: Klf4: 0.0286, Mrc1: 0.0286, Cd163: 0.0286, Arg1: 0.0286, GR: Klf4: 0.0286, Mrc1: 0.0286, Cd163: 0.0286, Arg1: 0.0286.

Comment in

Similar articles

Cited by

References

    1. Finucane MM, et al. National, regional, and global trends in body-mass index since 1980: systematic analysis of health examination surveys and epidemiological studies with 960 country-years and 9·1 million participants. Lancet. 2011;377:557–567. doi: 10.1016/S0140-6736(10)62037-5. - DOI - PMC - PubMed
    1. Guh DP, et al. The incidence of co-morbidities related to obesity and overweight: a systematic review and meta-analysis. BMC Public Health. 2009;9:88. doi: 10.1186/1471-2458-9-88. - DOI - PMC - PubMed
    1. Wong RH, Sul HS. Insulin signaling in fatty acid and fat synthesis: a transcriptional perspective. Curr. Opin. Pharmacol. 2010;10:684–691. doi: 10.1016/j.coph.2010.08.004. - DOI - PMC - PubMed
    1. Czech MP. Insulin action and resistance in obesity and type 2 diabetes. Nat. Med. 2017;23:804–814. doi: 10.1038/nm.4350. - DOI - PMC - PubMed
    1. Schipper HS, Prakken B, Kalkhoven E, Boes M. Adipose tissue-resident immune cells: key players in immunometabolism. Trends Endocrinol. Metab. 2012;23:407–415. doi: 10.1016/j.tem.2012.05.011. - DOI - PubMed

Publication types