. 2023 Apr 20;14(1):2254.
doi: 10.1038/s41467-023-37814-0.

Growth dynamics and amorphous-to-crystalline phase transformation in natural nacre

Affiliations

Growth dynamics and amorphous-to-crystalline phase transformation in natural nacre

L M Otter et al. Nat Commun. .

Abstract

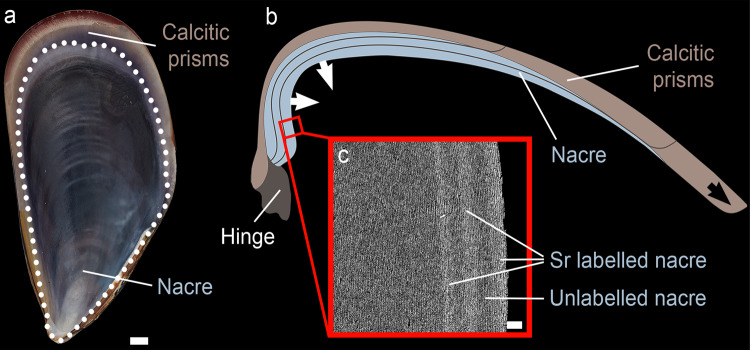
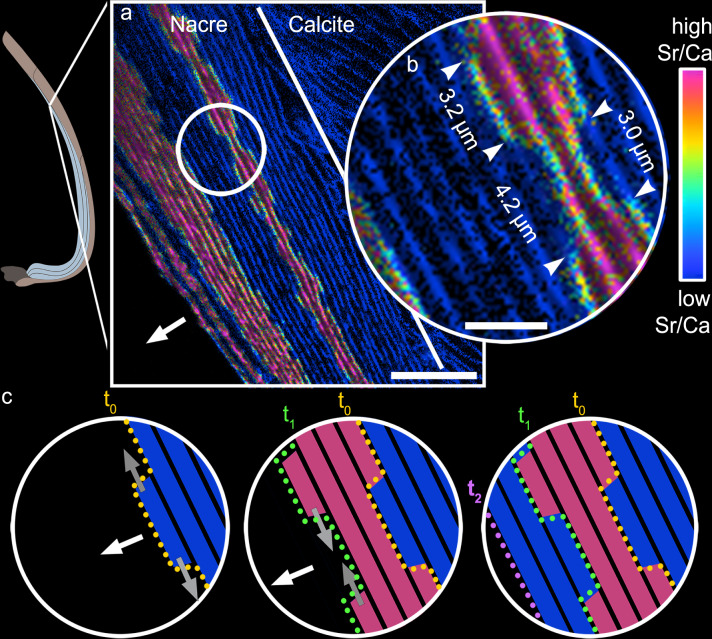
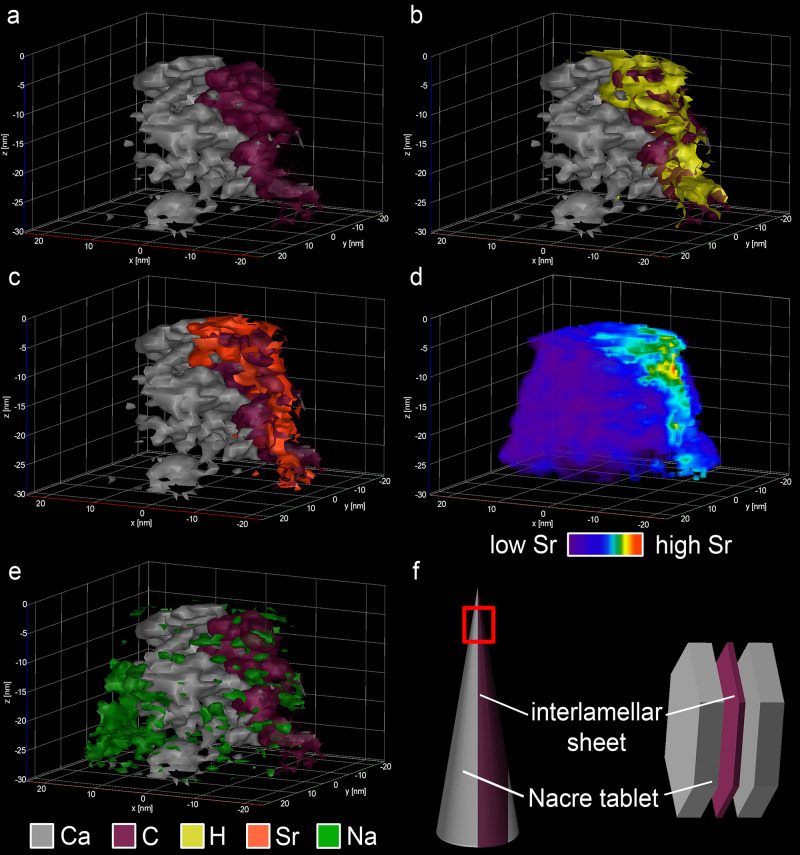
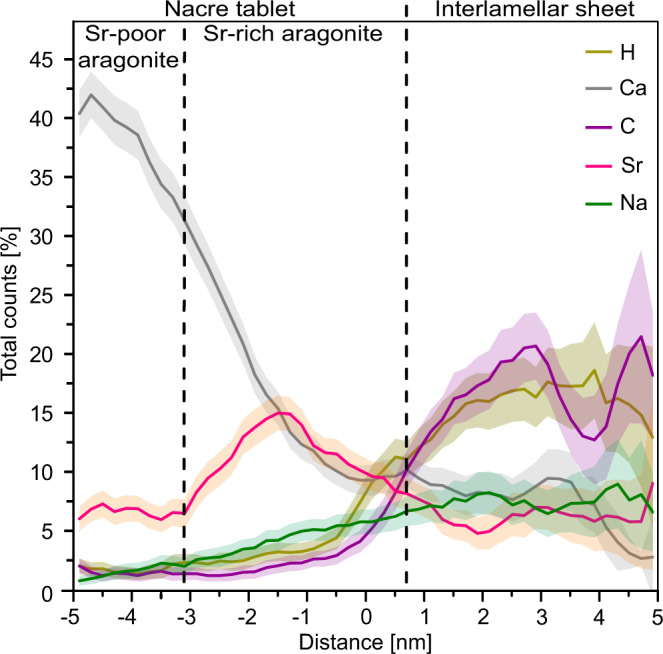
Biominerals, such as nacreous bivalve shells, are important archives of environmental information. Most marine calcifiers form their shells from amorphous calcium carbonate, hypothesised to occur via particle attachment and stepwise crystallisation of metastable precursor phases. However, the mechanism of this transformation, including the incorporation of trace elements used for environmental reconstructions, are poorly constrained. Here, using shells of the Mediterranean mussel, we explore the formation of nacre from the meso- to the atomic scale. We use a combination of strontium pulse-chase labelling experiments in aquaculture and correlated micro- to sub-nanoscale analysis to show that nacre grows in a dynamic two-step process with extensional and space-filling growth components. Furthermore, we show that nacre crystallizes via localised dissolution and reprecipitation within nanogranules. Our findings elucidate how stepwise crystallization pathways affect trace element incorporation in natural biominerals, while preserving their intricate hierarchical ultrastructure.


Conflict of interest statement

The authors declare no competing interests.

Figures

Fig. 1
Fig. 1. Nacre growth visualised by Sr pulse-chase labelling.
a Photo of the inner shell surface of a M. galloprovincialis shell showing nacre constituting most of the inner shell surface inside the white dotted line and prismatic calcite outside the line. b Schematic cross-section of a shell. The shell grows in length by extending the outer calcite layer along the ventral margin (black arrow). The inner nacreous shell layer extends by thickening the inner shell surface (two white arrows). c SEM-BSE image of a polished shell cross-section (specimen M2S2R) showing Sr-labelled nacre layers as three light grey bands tracing parallel to the inner shell edge, while shell portions grown in normal seawater composition are shown in darker grey. In this specific example, the nacre layer grew 25 µm over the experimental period of 46 days marked by the start of the innermost Sr label. Scale bars are 1 mm (a) and 5 µm (c).
Fig. 2
Fig. 2. NanoSIMS imaging of nacre growth processes visualized via Sr pulse-chase labelling.
a 88Sr/40Ca ratio map sized 50 × 50 μm showing four Sr labels (magenta) and unlabelled nacre (blue) parallel to the nacre growth front (specimen: M1S1L). The combined unlabelled and Sr-labelled nacre layers have average Sr concentrations of 2,100 μg/g and 12,500 μg/g, respectively (Supplementary Table 2). The labelled nacre layers exhibit a stepped growth pattern of intercalated nacre tablets formed in seawater with normal Sr concentration (blue) and during Sr-labelling (magenta). b Magnified region of interest (circled in a) shows sharp (i.e., within 100 nm) near-vertical transitions, marked by white arrowheads, between labelled and unlabelled portions of nacre lamellae. The sizes of neighbouring Sr-labelled and unlabelled lamellae portions ranging between 3.0 and 4.2 µm indicate that these portions represent changes in Sr/Ca ratios within individual tablets as the total length of a nacre tablet is 10–20 µm. c Time-resolved schematic representation of the two components of nacre growth processes (area corresponds to that shown in b): extensional nacre growth across layers normal to the organic interlamellar sheets (white arrows) and space-filling nacre growth of individual tablets parallel with the interlamellar sheet within individual nacre layers (grey arrows). Growth between t0 (yellow dotted line) and t1 (green dotted line) was achieved within 3 days and between t1 and t2 (purple dotted line) within the following 6 days (see Supplementary Movie 1 for a full animation of the growth sequence). This time-resolved illustration of nacre growth demonstrates that extensional growth, thickening the shell, is followed by space-filling growth of separate individual nacre tablets. For additional NanoSIMS maps see Supplementary Figs. 2 and 3. Scale bar is 10 μm (a) and 3 μm (b).
Fig. 3
Fig. 3. 3D APT reconstruction showing parts of the nacre tablet and the organic interlamellar sheet in Sr-labelled nacre (specimen: M2S2R).
a Iso-concentration surfaces of Ca (50 at%, grey) depicting the outer area of a nacre tablet and elevated C (5.1 at%, magenta) identifies the organic interlamellar sheet. b Iso-concentration surfaces of H (10 at%, yellow) co-located with high C concentrations in the organic interlamellar sheet. c The iso-concentration surface of Sr (20 at%, red) shows a distinct Sr-rich area situated between Sr-poor aragonite within the mineral fraction. d Volume rendering showing the distribution of Sr across the volume of the reconstruction highlighting the Sr-enriched area (red to yellow) in the nacre tablet. e Iso-concentration surfaces of Na (8 at%, green) forms a distinct cluster within the mineral phase next to the Sr-rich area. f Schematic representation of the APT reconstruction (red box) and its relative position within the tip as well as within the nacreous architecture more generally.
Fig. 4
Fig. 4. Compositional profile through the APT reconstruction across the nacre tablet.
The qualitative profile across the APT reconstruction shown in Fig. 3. The plot is divided by black dashed lines into three sections: Sr-poor aragonite, Sr-rich aragonite and interlamellar sheet. The transition from Sr-poor to Sr-rich aragonite is defined by a significant increase in Sr, while the transition from Sr-rich aragonite to the organic interlamellar sheet is defined as the point of intersection between the Ca (grey) and the C (magenta) signals (see methods). The Sr-poor aragonite is characterised by high Ca concentrations indicative of CaCO3, while the Sr-rich area is defined by high Sr (red) at intermediate Ca and the interlamellar sheet by high C and H (yellow) counts. The Sr-enriched area appears within 4 nm of the mineralised nacre tablet adjacent to the organic sheet. The abundance of Na (green) increases steadily from the tablet into the organic sheet. Shaded envelopes depict the first standard deviations.
Fig. 5
Fig. 5. PiFM analysis revealing heterogeneous, nanoscale phase distributions in Sr-labelled nacre.
a Representative PiFM spectrum showing the absorption bands chosen for extracting the colour-coded PiFM phase distribution maps at 1482, 1446 and 1658 cm−1 as well as additional bands characteristic of aragonite (black font). b The 0.5 × 0.5 µm AFM phase contrast map was simultaneously acquired with the PiFM phase distribution maps obtained from Sr-labelled nacre (specimen: M2S2R) with the interlamellar organic sheet (within white dashed lines) running nearly horizontally through the mapped region. Lighter and darker colour in the phase contrast map highlight the space-filling nanogranular texture; the white arrow points towards the direction of extensional nacre growth (i.e., the inner shell surface). c Shows the distribution of the main aragonite absorption band mapped at 1482 cm−1 that highlights the nanogranules, d map at 1446 cm−1, which is a small absorption band seen in the spectra of Supplementary Fig. 10 that accentuates distinct portions of nanogranules and e distribution of the proteinaceous organic phases mapped using the amide I band at 1658 cm−1 showing a strong enrichment in the organic sheet and as part of the intracrystalline organic matrix inside the nacre tablet. All four maps were acquired simultaneously in Hyperspectral PiFM IR Imaging (HyPIR) mode and have a pixel resolution of 5 nm. Comparable results were obtained in an adjacent area to the one shown here (Supplementary Fig. 12). Scale bars are 100 nm.
Fig. 6
Fig. 6. Principal component analysis and multivariate curve resolution (PCA/MCR) applied to Sr-labelled nacre.
PCA/MCR was used to deconvolve the individual spectra underpinning the HyPIR map shown in Fig. 5. a Two pure component spectra were defined and corresponding maps showing the regions where these pure spectra are most prevalent were extracted. The PCA/MCR component spectra show their maximum intensities at different wavenumbers, namely at 1482 cm−1 and at 1472 cm−1 that correspond to aragonite and Sr-rich aragonite, respectively. The components are presented together with PiFM spot measurements of geological aragonite and synthetic strontianite reference materials for comparison (see method for details). The peak at 1472 cm−1, defined as component 2, has an intermediate position between the main bands of aragonite and strontianite that suggest this component consists of a strontianite and aragonite mechanical mixture or an aragonite-strontianite solid solutions beyond the 5 nm spatial resolution of the PiFM. The resulting maps exhibit within-granule heterogeneity of separate Sr-poor and Sr-rich aragonite areas. All component maps are shown superimposed on the greyscale phase contrast image depicting the space-filling nanogranular texture. Sr-rich areas are more common along the exteriors of individual granules, but rarely form fully enclosed cortices: b PCA/MCR component 1 (blue), c PCA/MCR component 2 (magenta) and d composite image of PCA/MCR component 1 and 2. Comparable results were obtained in an adjacent area to the one shown here (Supplementary Fig. 13). e transects across four representative nanogranules showing the intensity profiles for component 1 (blue) and 2 (magenta). Scale bars are 100 nm.

References

    1. Addadi L, Raz S, Weiner S. Taking advantage of disorder. Amorphous calcium carbonate and its roles in biomineralization. Adv. Mater. 2003;15:959–970. doi: 10.1002/adma.200300381. - DOI
    1. De Yoreo JJ, et al. Crystallization by particle attachment in synthetic, biogenic, and geologic environments. Science. 2015;349:1–9. doi: 10.1126/science.aaa6760. - DOI - PubMed
    1. Politi Y, et al. Transformation mechanism of amorphous calcium carbonate into calcite in the sea urchin larval spicule. Proc. Natl Acad. Sci. 2008;105:17362–17366. doi: 10.1073/pnas.0806604105. - DOI - PMC - PubMed
    1. Jacob DE, Wirth R, Soldati AL, Wehrmeister U, Schreiber A. Amorphous calcium carbonate in the shells of adult Unionoida. J. Struct. Biol. 2011;173:241–249. doi: 10.1016/j.jsb.2010.09.011. - DOI - PubMed
    1. Weiss IM, Tuross N, Addadi L, Weiner S. Mollusc larval shell formation. Amorphous calcium carbonate is a precursor phase for aragonite. J. Exp. Zool. 2002;293:478–491. doi: 10.1002/jez.90004. - DOI - PubMed