. 2023 Apr 21;8(1):159.
doi: 10.1038/s41392-023-01367-x.

RBM4 dictates ESCC cell fate switch from cellular senescence to glutamine-addiction survival through inhibiting LKB1-AMPK-axis

Affiliations

RBM4 dictates ESCC cell fate switch from cellular senescence to glutamine-addiction survival through inhibiting LKB1-AMPK-axis

Lei Chen et al. Signal Transduct Target Ther. .

Abstract

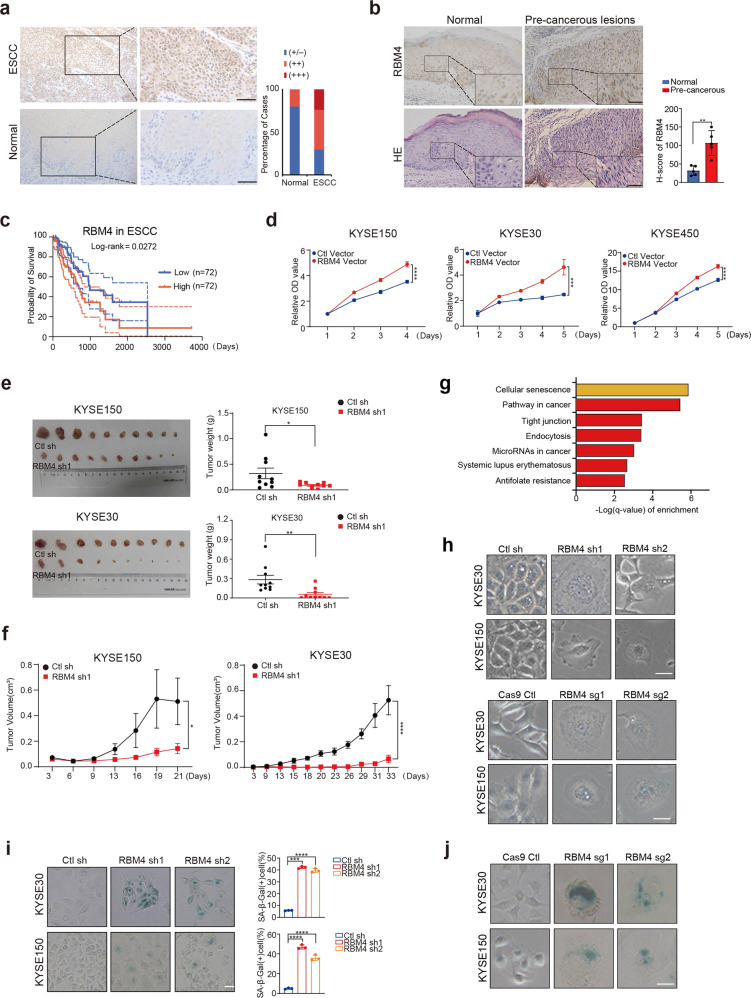
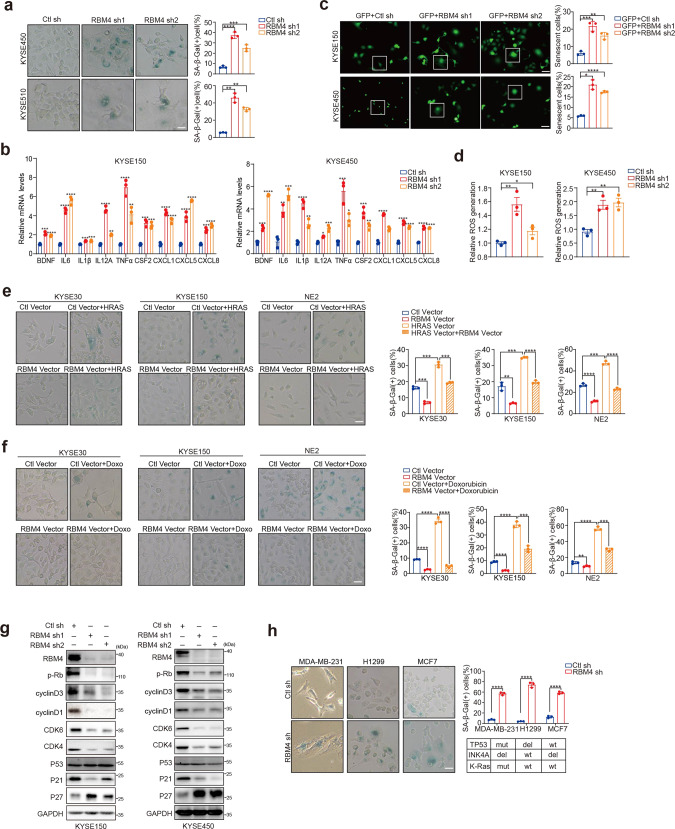
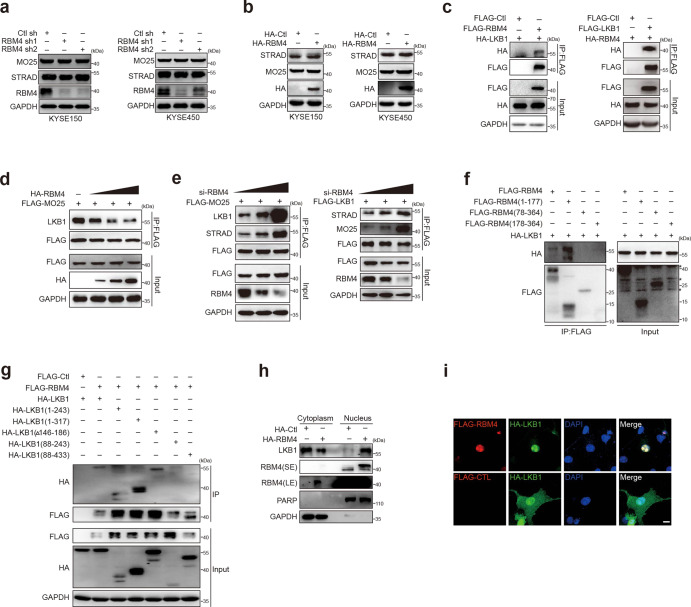
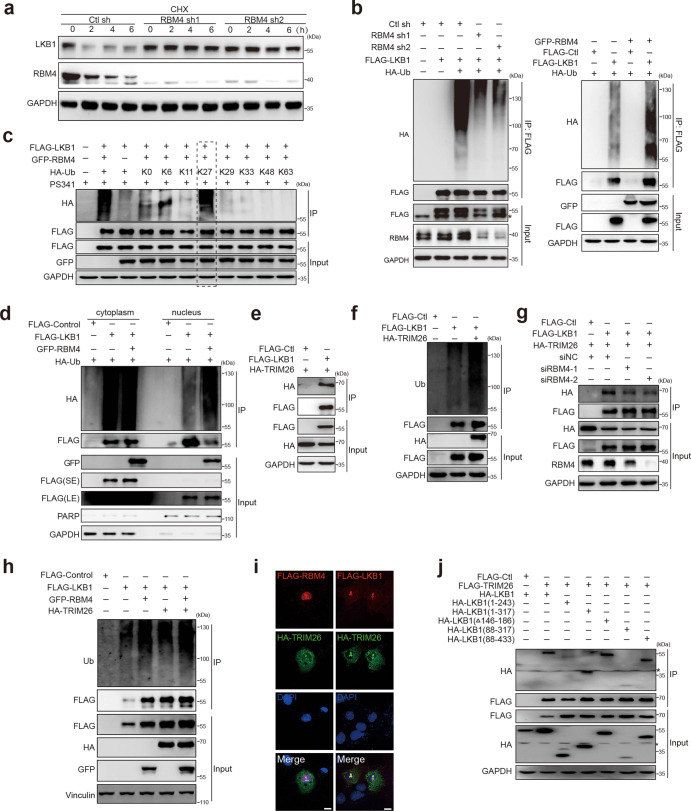
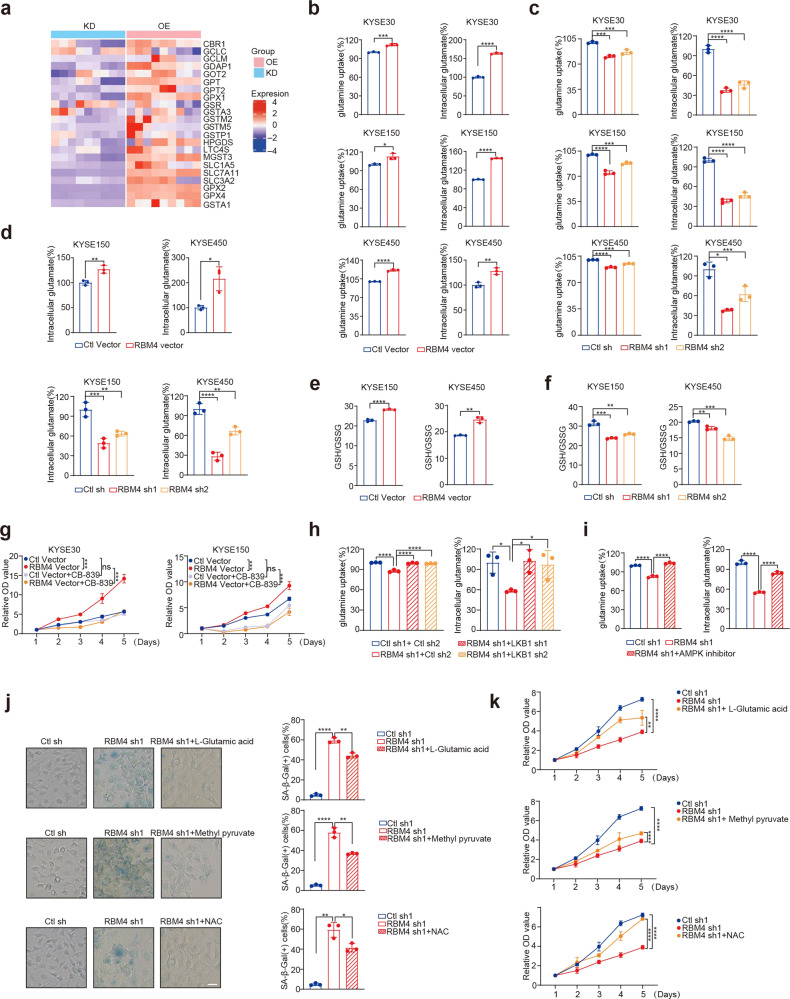
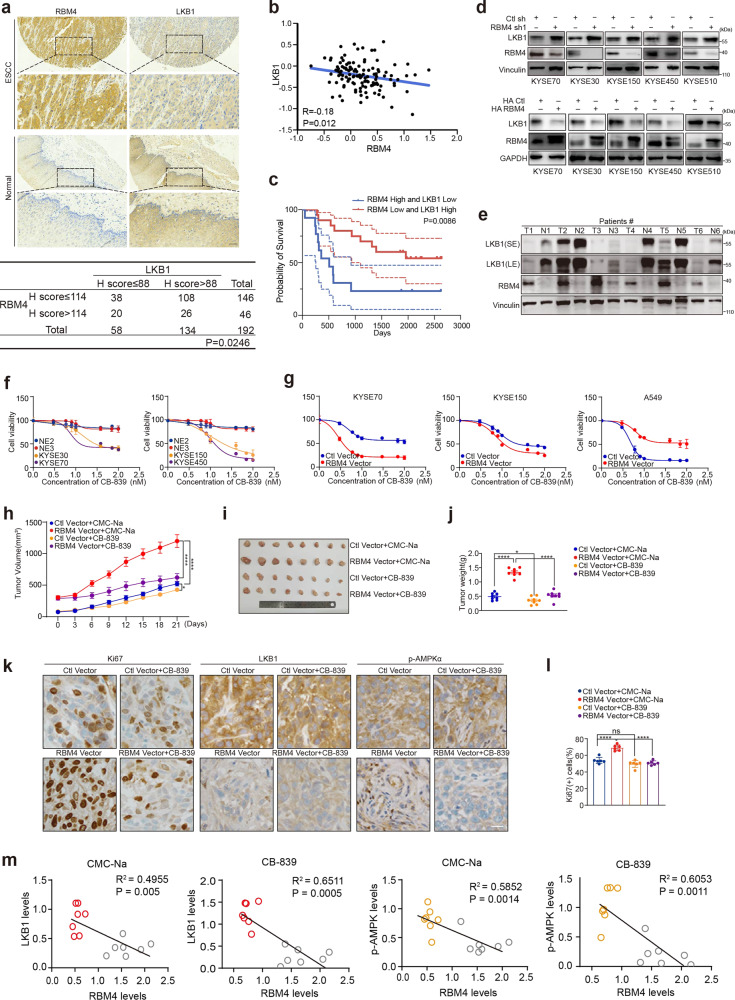
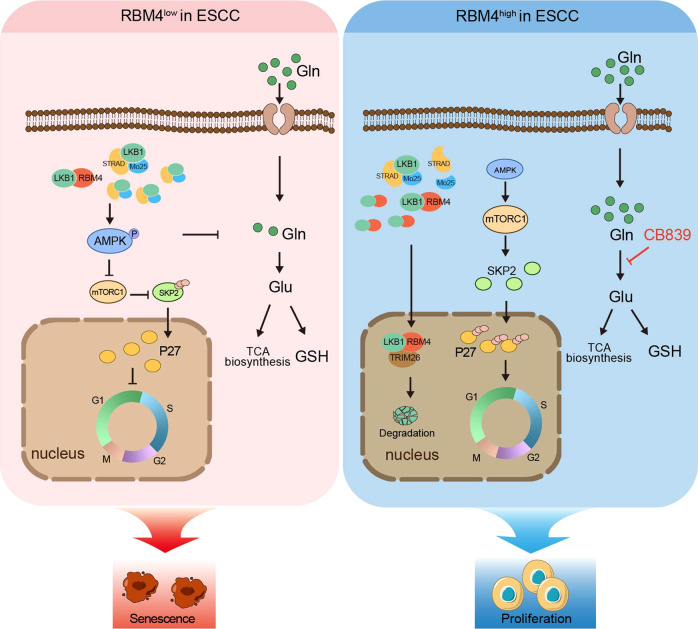
Cellular senescence provides a protective barrier against tumorigenesis in precancerous or normal tissues upon distinct stressors. However, the detailed mechanisms by which tumor cells evade premature senescence to malignant progression remain largely elusive. Here we reported that RBM4 adversely impacted cellular senescence to favor glutamine-dependent survival of esophageal squamous cell carcinoma (ESCC) cells by dictating the activity of LKB1, a critical governor of cancer metabolism. The level of RBM4 was specifically elevated in ESCC compared to normal tissues, and RBM4 overexpression promoted the malignant phenotype. RBM4 contributed to overcome H-RAS- or doxorubicin-induced senescence, while its depletion caused P27-dependent senescence and proliferation arrest by activating LKB1-AMPK-mTOR cascade. Mechanistically, RBM4 competitively bound LKB1 to disrupt the LKB1/STRAD/MO25 heterotrimeric complex, subsequently recruiting the E3 ligase TRIM26 to LKB1, promoting LKB1 ubiquitination and degradation in nucleus. Therefore, such molecular process leads to bypassing senescence and sustaining cell proliferation through the activation of glutamine metabolism. Clinically, the ESCC patients with high RBM4 and low LKB1 have significantly worse overall survival than those with low RBM4 and high LKB1. The RBM4 high/LKB1 low expression confers increased sensitivity of ESCC cells to glutaminase inhibitor CB-839, providing a novel insight into mechanisms underlying the glutamine-dependency to improve the efficacy of glutamine inhibitors in ESCC therapeutics.


Conflict of interest statement

The authors declare no competing interests.

Figures

Fig. 1
Fig. 1
RBM4 exhibits oncogenic activity in ESCC. a RBM4 protein levels were measured in 75 pairs of ESCC and normal esophageal tissues by immunohistochemistry staining of tissue microarray. Quantification of the percentage of cases exhibited negative, 1 + , 2+ or 3+ IHC staining of RBM4 was plotted. “−” indicates negative staining; “+” means weak positive staining; “++” denotes moderately strong positive staining, and “+++” indicates strong positive staining. Scale bar = 50 μm. b Immunohistochemistry and HE staining of normal esophageal tissues and pre-cancerous lesions of ESCC were shown. Scale bar = 10 μm. Quantitative analysis of RBM4 expression was done by Image J program. Plotted are the mean ± SD from five pairs of human samples, with *P < 0.05 as determined by paired Student t-test. H-score = ∑(pi × i) = (percentage of weak intensity × 1)+(percentage of moderate intensity × 2) + (percentage of strong intensity × 3), pi indicates the percentage of positive signal pixel area/number of positive tumor cells, i represents the coloring intensity. c Kaplan–Meier curve with corresponding 95% confidence intervals (CI) showing overall survival of ESCC patients with high or low RBM4 expression based on immunohistochemical microarray analysis. Dotted red/blue indicates the upper and lower confidence limits. Significance was assessed with Mantel-Cox log-rank (P = 0.0272) test. The hazard ratio for risk of death in RBM4-low versus RBM4- high ESCC patients is 0.5636 (95%CI = 0.375-0.9412). d Cell viabilities of RBM4-overexpressed KYSE150, KYSE30 and KYSE450 cells were measured by the CCK8 growth curve assays. Three experiments were carried out with mean ± SD of relative cell viability plotted. P-values were determined by two-way repeated measures ANOVA, ***P < 0.001, ****P < 0.0001. e, f Nude mice were subcutaneously inoculated with KYSE150 or KYSE30 cells with stable knockdown of RBM4 or control respectively. Images of the subcutaneous xenograft tumors were shown in e. Tumor weight (e) and tumor volumes (f) of each group was measured and quantified at the indicated time. P-values were determined by Student’s t-test (e) or two-way repeated measures ANOVA (f). (n = 10, error bars indicate mean ± SEM, *P < 0.05, **P < 0.01.) g KEGG pathway analysis of RNA-seq with three independent biological replicates using KYSE150 cells with stable depletion of RBM4 compared to control vector. Statistical analysis was performed with the false discovery rate (FDR) method after Benjamini-Hochberg correction for multiple-testing. KEGG terms for biological process with FDR < 0.05 were accepted as a significant enrichment. h The morphology changes of KYSE30 and KYSE150 cells with stable knockdown of RBM4 by shRNA (upper panel) or knockout of RBM4 established by CRISPR-Cas9 system (lower panel). Scale bar = 25 μm. i β-gal staining of KYSE30 and KYSE150 cells with stable depletion of RBM4 by shRNA. Three experiments were carried out with mean ± SD of β-gal positive cells plotted. ****P < 0.0001 (P-values were determined by One-way ANOVA with Dunnett multiple comparisons). Scale bar = 25 μm. j β-gal staining of RBM4-knockout KYSE30 and KYSE150 cells generated through CRISPR-Cas9 system. Scale bar = 25 μm
Fig. 2
Fig. 2
RBM4 depletion induces senescence-like phenotype and its overexpression contributes to bypass premature senescence. a β-gal staining of KYSE450 and KYSE510 cells with stable depletion of RBM4. Three experiments were carried out with mean ± SD of β-gal positive cells plotted. P-values were determined by One-way ANOVA with Dunnett multiple comparisons. Scale bar = 25 μm. b The expression of senescence-associated secretory phenotype (SASP) factors in KYS150 and KYSE450 cells with stable depletion of RBM4 was examined with the qRT-PCR approach. P-values were determined by One-way ANOVA with Dunnett multiple comparisons. n = 3 per group. c ESCC cells expressing GFP were co-cultured with RBM4-depleted ESCC cells, and morphology changes of ESCC-GFP cells were observed. Scale bar = 50 μm. Mean ± SD of percentage of relative senescence cells were plotted. P-values were determined by One-way ANOVA with Dunnett multiple comparisons. n = 3 per group. d The relative ROS production was examined in KYSE150 and KYSE450 cells with depletion of RBM4. Three experiments were carried out with mean ± SD of relative ROS production was plotted. (P-values were determined by One-way ANOVA with Dunnett multiple comparisons). e, f β-gal staining of KYSE30, KYSE150 and NE2 cells with stable lentiviral transfection of RBM4 or empty vector with or without H-RAS overexpression (e) or Doxorubicin treatment (f). Three experiments were carried out with mean ± SD of β-gal positive cells plotted (P-values were determined by One-way ANOVA with Dunnett multiple comparisons). Scale bar = 25 μm. g The protein levels of RBM4, p-Rb, cyclin D3, cyclin D1, CDK6, CDK4, P53, P21, and P27 in ESCC cells with RBM4 depletion were examined with a western blot assay. h β-gal staining of different cancer cells with distinct genetic background in the presence or absence of RBM4. Three experiments were performed with mean ± SD of β-gal positive cells plotted (P-values were determined by Student’s t-test) and the status of P53, INK4A, and K-Ras was indicated. Scale bar = 25 μm. *P < 0.05, **P < 0.01, ***P < 0.001, ****P < 0.0001
Fig. 3
Fig. 3
RBM4 reduction activates LKB1-AMPK-P27 pathway to induce cellular senescence and growth arrest. a Protein levels RBM4, CDK4, CDK6, and P27 were analyzed in RBM4-depleted ESCC cells with or without P27. b β-gal staining of KYSE150 and KYSE450 cells with stable knockdown of RBM4 in the presence or absence of P27. Three experiments were carried out with mean ± SD of β-gal positive cells plotted (P-values were determined by One-way ANOVA with Dunnett multiple comparisons). Scale bar = 25 μm. c The growth curve of RBM4-depleted KYSE150 or KYSE450 cells with or without depletion of P27 was measured by CCK8 assay. P-values were determined by two-way repeated measures ANOVA. n = 3 per group. d Colony formation assays of RBM4-depleted KYSE150 or KYSE450 cells with or without knockdown of P27 were performed. The mean ± SD of colony numbers was plotted (P-values were determined by One-way ANOVA with Dunnett multiple comparisons, n = 3 per group). e Protein levels of P27, SKP2, p-S6K, p-4EBP1, p-AMPK, and RBM4 were examined in RBM4-depleted KYSE150 and KYSE450 cells with a western blot assay. f Western blot was performed to measure the protein levels of LKB1, p-AMPK, AMPK, and RBM4 in KYSE150 and KYSE450 cells with or without RBM4. g Protein levels of LKB1, p-AMPK, AMPK, p-S6K, p-4EBP1, and RBM4 were examined in RBM4-overexpressed KYSE150 and KYSE450 cells using a western blot assay. h Western blot approach was performed to measure the protein levels of LKB1, RBM4, and P27 in RBM4-depleted ESCC cells with or without LKB1. i Protein levels of p-Rb, P27, SKP2, p-AMPK, AMPK, and RBM4 were analyzed in RBM4-depleted ESCC cells with or without AMPK. j β-gal staining of KYSE150 cells with stable knockdown of RBM4 in the presence or absence of AMPK or LKB1. Three experiments were carried out with mean ± SD of β-gal positive cells plotted (P-values were determined by One-way ANOVA with Dunnett multiple comparisons). Scale bar = 25 μm. k, l Colony formation assays of RBM4-depleted KYSE150 cells with or without knockdown of AMPK or LKB1 were performed. Three experiments were carried out with mean ± SD of colony numbers were plotted. P-values were determined by One-way ANOVA with Dunnett multiple comparisons. m Cell viability of RBM4-depleted KYSE150 cells with or without AMPK or LKB1 was measured by CCK8 assays. Three experiments were carried out with mean ± SD of relative cell viability plotted. P-values were determined by two-way repeated measures ANOVA. *P < 0.05, **P < 0.01, ***P < 0.001, ****P < 0.0001
Fig. 4
Fig. 4
RBM4 disrupts LKB1/STRAD/MO25 heterotrimeric complex by competitively binding to LKB1. a, b Protein levels of MO25, STRAD, and RBM4 were examined in KYSE150 and KYSE450 cells with stable depletion (a) or overexpression (b) of RBM4. c Immunoprecipitation assay was performed in KYSE150 cells expressing Flag-RBM4, HA-LKB1 or Flag-LKB1, HA-RBM4 respectively, and the protein complex precipitated by Flag-M2 agarose beads were analyzed through western blotting. d, e Immunoprecipitation assay was carried out in KYSE150 cells expressing a fixed amount of Flag-MO25 and increased amount of RBM4 (d), or elevated amount of siRBM4 (e, left), or a fixed amount of Flag-LKB1 with increased amount of siRBM4 (e, right) respectively after 8-h PS341 (10 μM) treatment. The protein complexes were precipitated with anti-Flag followed by western blotting analysis. f Immunoprecipitation assay was performed in KYSE150 cells expressing HA-LKB1 and Flag-RBM4, or Flag-RBM4(1-177), Flag-RBM4(78-364), Flag-RBM4(178-364) in the presence of PS341 (10 μM). The Flag-tagged precipitated-complexes were analyzed with a specific HA or Flag antibody. Asterisks indicate non-specific bands. g Immunoprecipitation assay was carried out in KYSE150 cells expressing Flag-RBM4 and HA-LKB1, or HA-LKB1(1-243), HA-LKB1(1-317), HA-LKB1(Δ146-186), HA-LKB1(88-243), HA-LKB1(88-433) in the presence of PS341 (10 μM). The Flag-tagged precipitated-complexes were analyzed using western blotting. h The levels of LKB1 and RBM4 were examined in the cytoplasm and nucleus of KYSE150 cells expressing HA-RBM4 following PS341 (10 μM) treatment for 8 h. SE, short exposure; LE, long exposure. i Confocal immunofluorescence microscopy was utilized to examine the localization of Flag-RBM4 and HA-LKB1 in Cos7 cells. Scale bar = 10 μm
Fig. 5
Fig. 5
RBM4 recruits E3 ligase TRIM26 to promote LKB1 degradation in nucleus. a KYSE150 cells with RBM4 stably knockdown were treated with 50 μg/mL cycloheximide (CHX) for the indicated time course. The protein levels of LKB1 and RBM4 were detected by a western blot assay. b Immunoprecipitation assay was performed in RBM4-depleted KYSE150 cells co-expressing Flag-LKB1 following PS341 (10 μM) treatment for 8 h to examine the ubiquitination of LKB1. The protein complexes were precipitated by anti-Flag M2 resin and analyzed with the indicated antibodies. Asterisks indicate non-specific bands. c Immunoprecipitation assay was carried out in cells expressing Flag-LKB1 and GFP-RBM4, with different HA-Ub vectors containing distinct lysine mutations in the presence of PS341 (10 μM). The protein complexes were precipitated by anti-Flag M2 resin and analyzed by a western blot assay. d KYSE150 cells co-transfected with the indicated vectors expressing Flag-LKB1, GFP-RBM4 or HA-Ub in the presence of PS341 (10 μM) were subjected to nucleocytoplasmic fractionation followed by a co-immunoprecipitation assay with anti-Flag M2 resin to analyze the ubiquitination of LKB1 in the cytoplasm and nucleus respectively. SE, short exposure; LE, long exposure. e The interaction between LKB1 and TRIM26 was determined by an immunoprecipitation assay with anti-Flag antibody following PS341 (10 μM) treatment for 8 h. f Immunoprecipitation assay was carried out to determine the Flag-LKB1-bound poly-ubiquitin with or without HA-TRIM26 overexpression following PS341 (10 μM) treatment for 8 h. g Immunoprecipitation assay was performed in RBM4-depleted or control cells after PS341 (10 μM) treatment for 8 h to assess the interaction between LKB1 and TRIM26. h Immunoprecipitation assay was carried out to investigate the effect of RBM4 and TRIM26 on the ubiquitination of LKB1 in the presence of PS341 (10 μM). i Confocal immunofluorescence microscopy was used to examine the localization of Flag-RBM4 or Flag-LKB1 with HA-TRIM26 in HeLa cells. Scale bar = 10 μm. j Immunoprecipitation assay was performed in KYSE150 cells expressing Flag-TRIM26 and HA-LKB1, or HA-LKB1(1-243), HA-LKB1(1-317), HA-LKB1(Δ146-186), HA-LKB1(88-317), HA-LKB1(88-433) in the presence of PS341 (10 μM). The Flag-tagged precipitated-complexes were analyzed by western blotting. Asterisks indicate non-specific bands
Fig. 6
Fig. 6
Glutamine metabolism was elevated by RBM4-LKB1 axis to promote ESCC cells survival. a Heatmap analysis of metabolism-related genes upon RBM4 depletion or overexpression in KYSE150 cells. b, c Glutamine consumption and glutamate levels were examined in KYSE30, KYSE150 and KYSE450 cells with stable overexpression of RBM4 (b) or depletion of RBM4 (c). Three experiments were performed and mean ± SD was plotted. P-values were determined by Student’s t-test (b) or One-way ANOVA with Dunnett multiple comparisons (c). d The glutamate production was examined in KYSE150 and KYSE450 cells with stable overexpression of RBM4 or depletion of RBM4 while glutamine deprivation. Three experiments were performed and mean ± SD was plotted. P-values were determined by Student’s t-test or One-way ANOVA with Dunnett multiple comparisons. e, f KYSE150 and KYSE450 cells with stable overexpression of RBM4 (e) or depletion of RBM4 (f) were subjected to measure the reduced GSH/ oxidized GSSG ratio calculated by GSH/GSSG = [Total GSH-(2 × GSSG)]/GSSG. Three experiments were performed and mean ± SD was plotted (P-values were determined by One-way ANOVA with Dunnett multiple comparisons or Student’s t-test). g The growth curve of RBM4-overexpressed KYSE30, and KYSE150 cells with or without CB-839 treatment was measured by CCK8 assay. P-values were determined by two-way repeated measures ANOVA. h Glutamine consumption and glutamate levels of RBM4-depleted KYSE150 cells in the presence or absence of LKB1 were examined. Three experiments were performed with mean ± SD plotted (P-values were determined by One-way ANOVA with Dunnett multiple comparisons). i Glutamine consumption and glutamate levels of RBM4-depleted KYSE150 cells in the presence or absence of AMPK inhibitor compound C (5 μM) were examined. Three experiments were performed with mean ± SD plotted (P-values were determined by One-way ANOVA with Dunnett multiple comparisons). j β-gal staining of KYSE150 cells with stable knockdown of RBM4 in the presence or absence of glutamic acid (0.5 mM), methyl pyruvate (10 mM) and NAC (3 mM). Three experiments were carried out with mean ± SD of β-gal positive cells plotted (P-values were determined by One-way ANOVA with Dunnett multiple comparisons). Scale bar = 25 μm. k The growth curve of RBM4-depleted KYSE150 cells with or without addition of glutamic acid, methyl pyruvate, and NAC was measured by CCK8 assay. P-values were determined by two-way repeated measures ANOVA. *P < 0.05, **P < 0.01, ***P < 0.001, ****P < 0.0001
Fig. 7
Fig. 7
RBM4 endows ESCC metabolic vulnerability. a The tissue microarray of ESCC patients was subjected to IHC staining for the specific RBM4 and LKB1 antibodies. Representative images were acquired with ×10 and ×40 objectives (scale bar = 50 μm). The results were analyzed by the pathologist who provided a value ranging from 0 to 3 for each sample. “0” indicates negative staining; “1” means weak positive staining; “2” denotes moderately positive staining and “3” indicates strongly positive staining. H-score is obtained by the formula: 3 × percentage of strongly staining + 2 × percentage of moderately staining + percentage of weakly staining. The correlation between RBM4 and LKB1 expression in ESCC and the corresponding normal tissues was calculated by Pearson’s chi-square test. b Correlation of RBM4 and LKB1 levels were analyzed using data obtained from mass spectrometry-based proteomic profiling of ESCC tumors and adjacent non-tumor tissues (PXD021701). (P = 0.012 by Pearson’s chi-square test). c Kaplan–Meier curve showing overall survival of ESCC patients (PXD021701) with high RBM4 expression and low LKB1 expression or low RBM4 expression and high LKB1 expression (P = 0.0086 by log-rank test, dotted red/blue indicates the upper and lower confidence limits.). d Protein levels of LKB1 and RBM4 were determined in RBM4-depleted or overexpression ESCC cells, including KYSE30, KYSE70, KYSE150, KYSE450, and KYSE510 cells. e Protein levels of LKB1 and RBM4 in fresh-frozen tumor and the corresponding normal tissue specimens from ESCC patients were examined by western blot assay. “N” stands for the adjacent non-tumor tissues, “T” represents ESCC tissues. SE, short exposure; LE, long exposure. f Dose-response curves of cell viability in normal esophageal epithelial cells (NE2 and NE3) and distinct ESCC cells (KYSE30, KYSE70, KYSE150, and KYSE450) treated with CB-839 (n = 3; mean of three technical replicates from a representative experiment was shown in the graph) for 72 h. g Dose-response curves of cell viability in RBM4-overexpression cells (KYSE70, KYSE150, and A549) treated with CB-839 (n = 3; mean of three technical replicates from a representative experiment was shown in the graph) for 72 h. h–j Nude mice were subcutaneously injected with 5 × 106 KYSE30 cells with stable overexpression of RBM4 or control respectively. When the tumor reached 50–250 mm3, the animals were randomized to the respective treatment groups. CB-839 (200 mpk) was administered by oral gavage twice a day, tumor volumes were measured every 3 days (h). After 21 days of treatment, the mice were sacrificed to remove the xenografted tumors as shown in (i), and the tumors weights were measured (j). n = 7, error bars indicate mean ± SEM. P-values were determined by two-way repeated measures ANOVA in H or one-way ANOVA with Dunnett multiple comparison in J. *P < 0.05, ****P < 0.0001. k, l After 21 days of oral administration of CB-839 or vehicle (0.5% CMC-Na), the nude mice bearing RBM4-overexpressing or empty vector-expressing xenografts were sacrificed to remove tumors for immunohistochemistry analysis of the proliferation marker Ki67, LKB1 and phosphorylation of AMPK (k). Scale bar = 50 μm. Quantification of Ki67 positive cells after IHC analysis was performed using image J software and plotted as mean ± SD with P-value in ANOVA test (l). ****P < 0.0001. m 21-days after oral administration of CB-839 or vehicle (0.5% CMC-Na), the nude mice bearing RBM4-overexpressing or empty vector xenografts were sacrificed to remove tumors for western blot and gray value analysis of RBM4, LKB1 and phosphorylation of AMPK. The correlation between the levels of RBM4 and LKB1/p-AMPK was calculated by Pearson correlation coefficient calculation and plotted. Gray circle represents RBM4-overexpressed samples, red/orange circle represents control vector samples. R, Pearson correlation coefficient; P-value, two-tailed P-value of the Pearson correlation
Fig. 8
Fig. 8
Schematic of how RBM4 dictates ESCC cells fate from senescence to Glutamine-addiction survival through regulating LKB1-AMPK-P27 pathway. Mechanistically, RBM4 competitively bound to LKB1 to disrupt the formation of LKB1/STRAD/MO25 heterotrimeric complex and recruited the E3 ligase TRIM26 to LKB1, promoting the ubiquitination of LKB1 and its subsequent degradation, thereby conferring the enhanced sensitivity of glutaminase inhibitor CB-839 to RBM4-high ESCC. Conversely, RBM4 depletion stabilized LKB1 to activate p-AMPK, thus inhibiting mTOR activity and inducing P27-dependent senescence. The illustration of proliferative cells used elements from Servier Medical Art (https://smart.servier.com/) by Servier under a Creative Commons Attribution 3.0 Unported License

Similar articles

Cited by

References

    1. Sung H, et al. Global Cancer Statistics 2020: GLOBOCAN estimates of incidence and mortality worldwide for 36 cancers in 185 countries. CA Cancer J. Clin. 2021;71:209–249. doi: 10.3322/caac.21660. - DOI - PubMed
    1. Chen W, et al. Cancer statistics in China, 2015. CA Cancer J. Clin. 2016;66:115–132. doi: 10.3322/caac.21338. - DOI - PubMed
    1. Huang J, et al. Global burden, risk factors, and trends of Esophageal cancer: an analysis of cancer registries from 48 countries. Cancers. 2021;13:141. doi: 10.3390/cancers13010141. - DOI - PMC - PubMed
    1. Chen XX, et al. Genomic comparison of esophageal squamous cell carcinoma and its precursor lesions by multi-region whole-exome sequencing. Nat. Commun. 2017;8:524. doi: 10.1038/s41467-017-00650-0. - DOI - PMC - PubMed
    1. Qie S, et al. Targeting glutamine-addiction and overcoming CDK4/6 inhibitor resistance in human esophageal squamous cell carcinoma. Nat. Commun. 2019;10:1296. doi: 10.1038/s41467-019-09179-w. - DOI - PMC - PubMed

Publication types

MeSH terms