. 2023 Apr 20;10(1):226.
doi: 10.1038/s41597-023-02118-x.

Two decades of fumigation data from the Soybean Free Air Concentration Enrichment facility

Affiliations

Two decades of fumigation data from the Soybean Free Air Concentration Enrichment facility

Elise Kole Aspray et al. Sci Data. .

Abstract

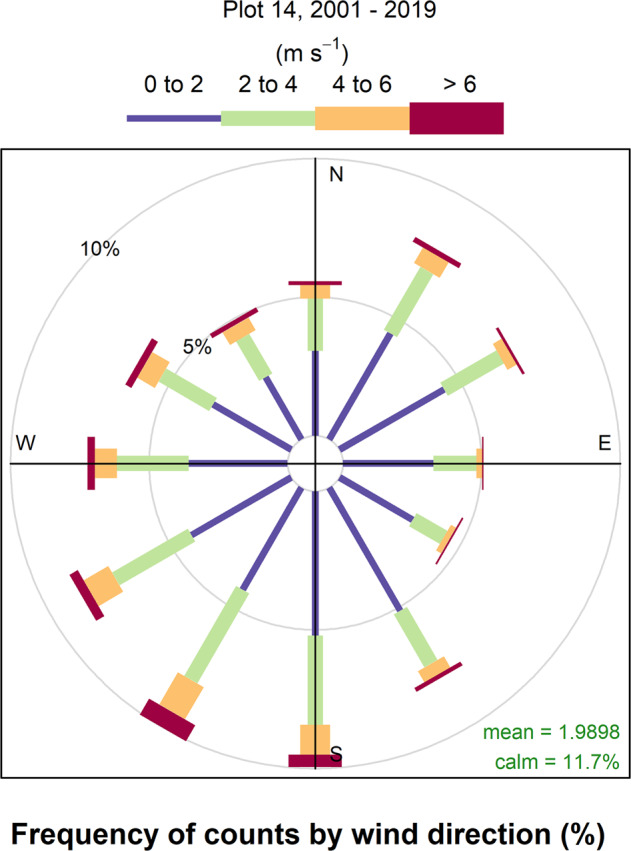
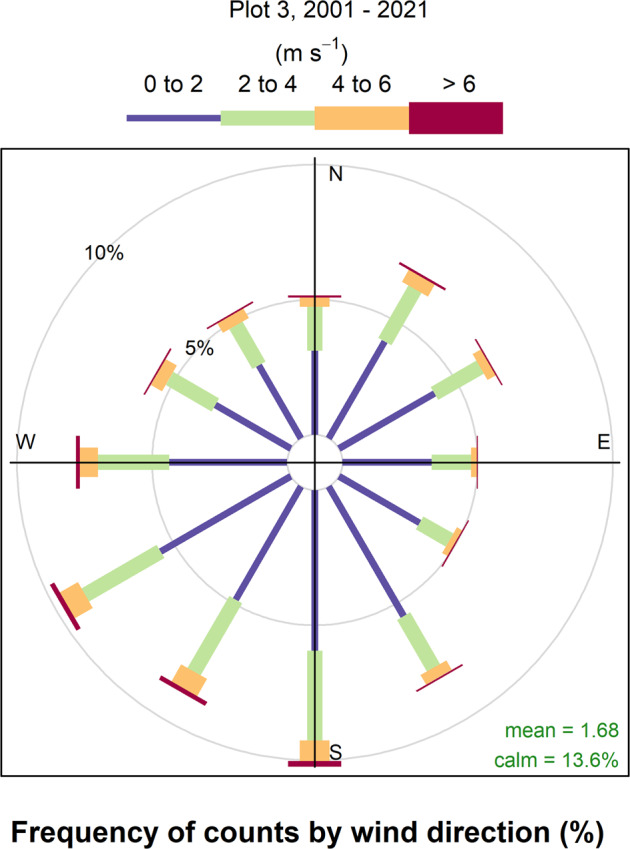
The Soybean Free Air Concentration Enrichment (SoyFACE) facility is the longest running open-air carbon dioxide and ozone enrichment facility in the world. For over two decades, soybean, maize, and other crops have been exposed to the elevated carbon dioxide and ozone concentrations anticipated for late this century. The facility, located in East Central Illinois, USA, exposes crops to different atmospheric concentrations in replicated octagonal ~280 m2 Free Air Concentration Enrichment (FACE) treatment plots. Each FACE plot is paired with an untreated control (ambient) plot. The experiment provides important ground truth data for predicting future crop productivity. Fumigation data from SoyFACE were collected every four seconds throughout each growing season for over two decades. Here, we organize, quality control, and collate 20 years of data to facilitate trend analysis and crop modeling efforts. This paper provides the rationale for and a description of the SoyFACE experiments, along with a summary of the fumigation data and collation process, weather and ambient data collection procedures, and explanations of air pollution metrics and calculations.


Conflict of interest statement

The authors declare no competing interests.

Figures

Fig. 1
Fig. 1
(a) Aerial view of the SoyFACE experiment (from Google Earth) with the 32 octagonal CO2, O3, combination, or ambient plots. Half of the field (i.e., plots 1–16 or 17–32; separated by a white line in the image) is planted in soybean and the other half planted in maize with crops rotated on an annual basis. (b) Image of a single SoyFACE treatment plot from the fumigation experiments. The wind sensor is circled in red at the center of the octagonal plot. The manifold (gas delivery system) that delivers the CO2 and O3 used in the experiments is circled in blue outside of the plot. Photo credit: Andrew Leakey. (c) Close-up image of the manifold and outgoing pipes outside of a SoyFACE treatment plot. These outgoing pipes deliver the CO2 and O3 gases to the green pipes along the sides of the treatment plots, from which the gases are released. Photo credit: Scott Gable.
Fig. 2
Fig. 2
Wind rose plot generated from 1-minute wind speed and direction data collected from Plot 14 between 2001 and 2019. Wind rose plots are polar graphs generated with the openair package in R. The radii length of the concentric circles represents the percentage frequency of measurements that have wind speeds between 0 to 2 m/s (blue), 2 to 4 m/s (green), 4 to 6 m/s (orange), and >6 m/s (red). The wind direction ranges include plus or minus 15 degrees from the given direction, starting at 0° on the upper vertical axis (N) and moving clockwise in 30° increments back to 360°. In the lower right corner of the plots, the mean refers to the overall mean wind speed for the plot, and the calm percentage indicates the percentage of calm observations omitted from the wind rose plot. Following the convention of the National Weather Service, winds with a direction of 0° are considered ‘calm’, while winds with a direction of 360° are assumed to be from the north.
Fig. 3
Fig. 3
Wind rose plot generated from 1-minute wind speed and direction data collected from Plot 3 between 2001 and 2021. Wind rose plots are polar graphs generated with the openair package in R. The radii length of the concentric circles represents the percentage frequency of measurements that have wind speeds between 0 to 2 m/s (blue), 2 to 4 m/s (green), 4 to 6 m/s (orange), and >6 m/s (red). The wind direction ranges include plus or minus 15 degrees from the given direction, starting at 0° on the upper vertical axis (N) and moving clockwise in 30° increments back to 360°. In the lower right corner of the plots, the mean refers to the overall mean wind speed for the plot, and the calm percentage indicates the percentage of calm observations omitted from the wind rose plot. Following the convention of the National Weather Service, winds with a direction of 0° are considered ‘calm’, while winds with a direction of 360° are assumed to be from the north.

Similar articles

Cited by

References

    1. Tripati AK, Roberts CD, Eagle RA. Coupling of CO2 and ice sheet stability over major climate transitions of the last 20 million years. Science. 2009;326:1394–1397. doi: 10.1126/science.1178296. - DOI - PubMed
    1. Liu PR, Raftery AE. Country-based rate of emissions reductions should increase by 80% beyond nationally determined contributions to meet the 2 °C target. Commun. Earth Environ. 2021;2:29. doi: 10.1038/s43247-021-00097-8. - DOI - PMC - PubMed
    1. Yeung LY, et al. Isotropic constraint on the twentieth century increase in tropospheric ozone. Nature. 2019;570:224–227. doi: 10.1038/s41586-019-1277-1. - DOI - PubMed
    1. Ainsworth EA, Yendrek CR, Sitch S, Collins WJ, Emberson LD. The effects of tropospheric ozone on net primary productivity and implications for climate change. Annu. Rev. Plant Biol. 2012;63:637–661. doi: 10.1146/annurev-arplant-042110-103829. - DOI - PubMed
    1. McGrath JM, et al. An analysis of ozone damage to historical maize and soybean yields in the United States. Proc. Natl. Acad. Sci. USA (PNAS). 2015;112:14390–14395. doi: 10.1073/pnas.1509777112. - DOI - PMC - PubMed