

Uncertain future for global sea turtle populations in face of sea level rise
- PMID: 37081050
- PMCID: PMC10119306
- DOI: 10.1038/s41598-023-31467-1
Uncertain future for global sea turtle populations in face of sea level rise
Erratum in
-
Author Correction: Uncertain future for global sea turtle populations in face of sea level rise.Sci Rep. 2023 Jun 7;13(1):9266. doi: 10.1038/s41598-023-36350-7. Sci Rep. 2023. PMID: 37286754 Free PMC article. No abstract available.
Abstract
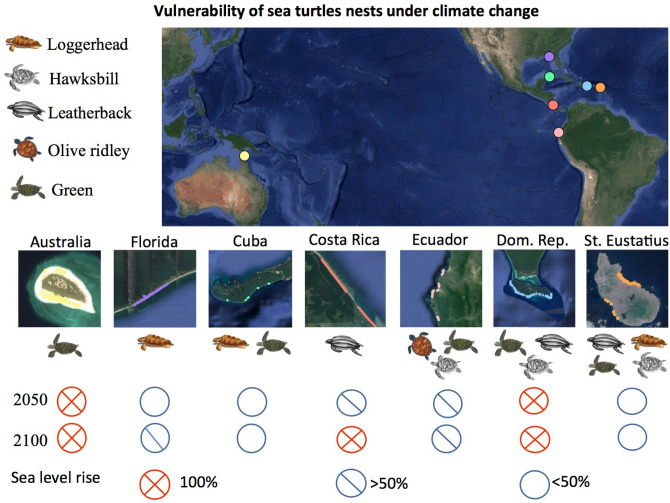
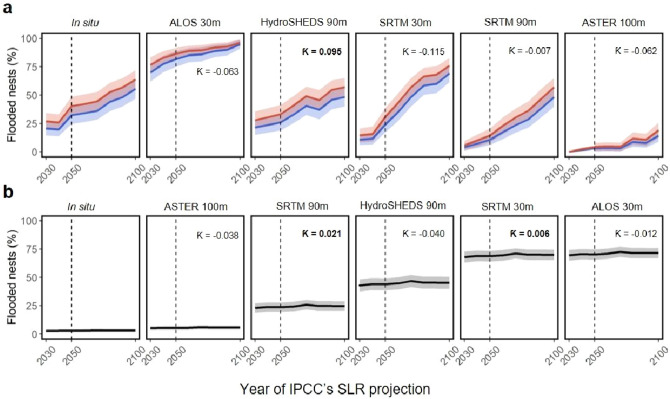
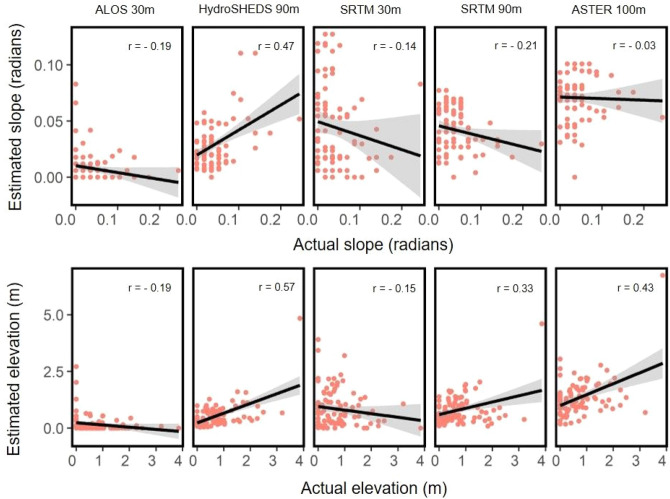
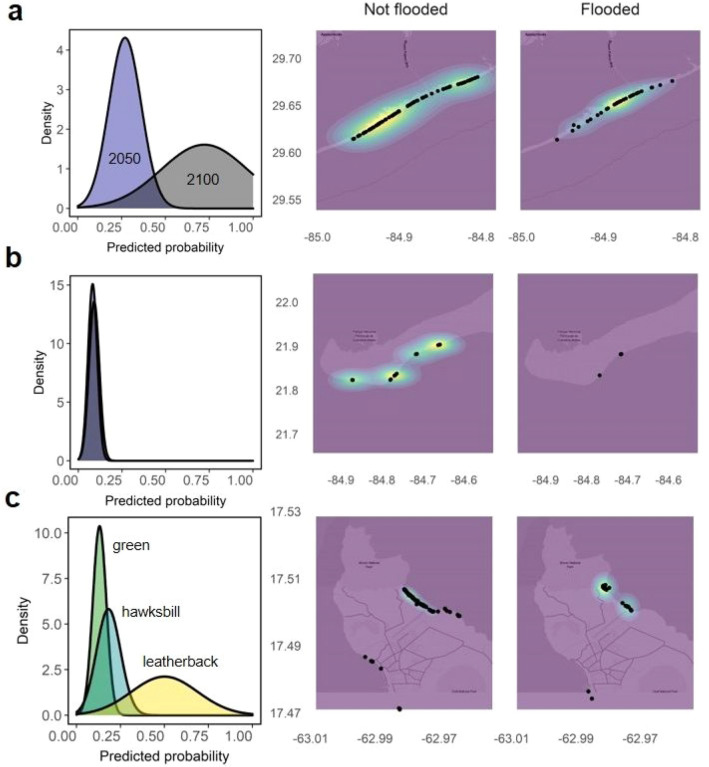
Sea level rise has accelerated during recent decades, exceeding rates recorded during the previous two millennia, and as a result many coastal habitats and species around the globe are being impacted. This situation is expected to worsen due to anthropogenically induced climate change. However, the magnitude and relevance of expected increase in sea level rise (SLR) is uncertain for marine and terrestrial species that are reliant on coastal habitat for foraging, resting or breeding. To address this, we showcase the use of a low-cost approach to assess the impacts of SLR on sea turtles under various Intergovernmental Panel on Climate Change (IPCC) SLR scenarios on different sea turtle nesting rookeries worldwide. The study considers seven sea turtle rookeries with five nesting species, categorized from vulnerable to critically endangered including leatherback turtles (Dermochelys coriacea), loggerhead turtles (Caretta caretta), hawksbill turtles (Eretmochelys imbricata), olive ridley turtles (Lepidochelys olivacea) and green turtles (Chelonia mydas). Our approach combines freely available digital elevation models for continental and remote island beaches across different ocean basins with projections of field data and SLR. Our case study focuses on five of the seven living sea turtle species. Under moderate climate change scenarios, by 2050 it is predicted that at some sea turtle nesting habitats 100% will be flooded, and under an extreme scenario many sea turtle rookeries could vanish. Overall, nesting beaches with low slope and those species nesting at open beaches such as leatherback and loggerheads sea turtles might be the most vulnerable by future SLR scenarios.
© 2023. The Author(s).
Conflict of interest statement
The authors declare no competing interests.
Figures
References
-
- Intergovernmental Panel on Climate Change (IPCC). In Climate Change 2013: The Physical Science Basis. Contribution of Working Group I to the Fifth Assessment Report of the Intergovernmental Panel on Climate Change (eds Stocker, T. F. et al.) (Cambridge University Press, 2013).
-
- Intergovernmental Panel on Climate Change (IPCC). In Climate Change 2022: The Physical Basis, 6th Assessment Report (2022)
-
- Kopp RE, DeConto RM, Bader DA, Hay CC, Horton RM, Kulp S, Strauss BH, et al. Evolving understanding of Antarctic ice-sheet physics and ambiguity in probabilistic sea-level projections. Earth's Future. 2017;5:1217–1233. doi: 10.1002/2017EF000663. - DOI
-
- Nurse, L. A. et al. in Climate change 2014: Impacts, adaptation, and vulnerability. Part B: Regional aspects. Contribution of working group II to the fifth assessment report of the intergovernmental panel on climate change (eds Barros, C. B. et al.) 1613–1654 (Cambridge University Press, 2014).
Publication types
MeSH terms
LinkOut - more resources
Full Text Sources
