. 2023 Apr 20;13(1):6465.
doi: 10.1038/s41598-023-33426-2.

Utilizing EEG and fNIRS for the detection of sleep-deprivation-induced fatigue and its inhibition using colored light stimulation

Affiliations

Utilizing EEG and fNIRS for the detection of sleep-deprivation-induced fatigue and its inhibition using colored light stimulation

Zeshan Shoaib et al. Sci Rep. .

Abstract

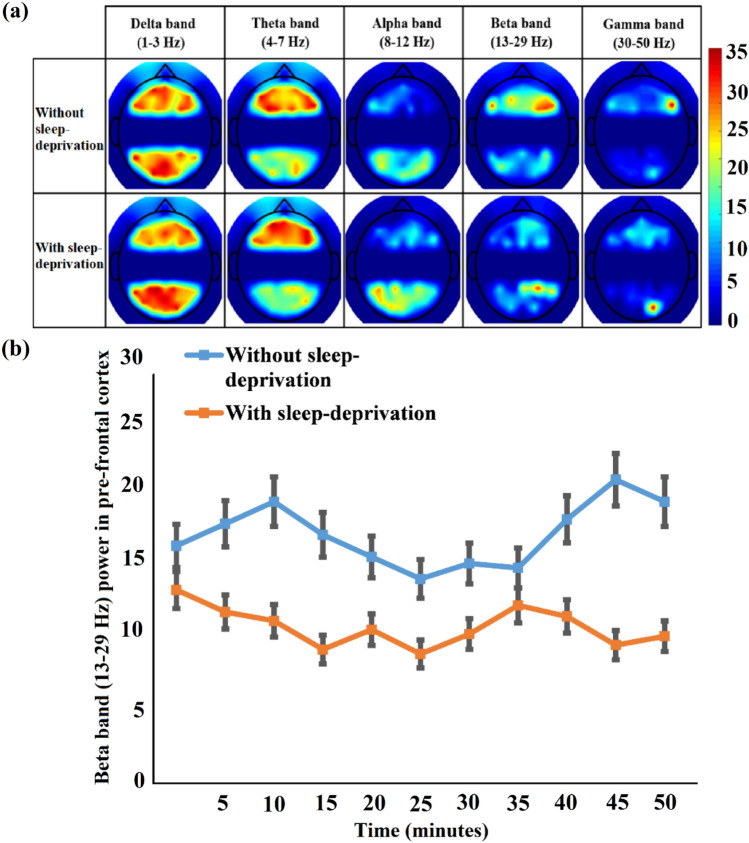
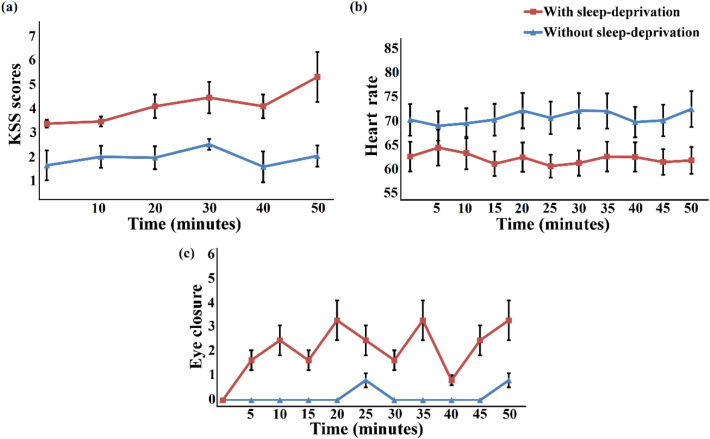
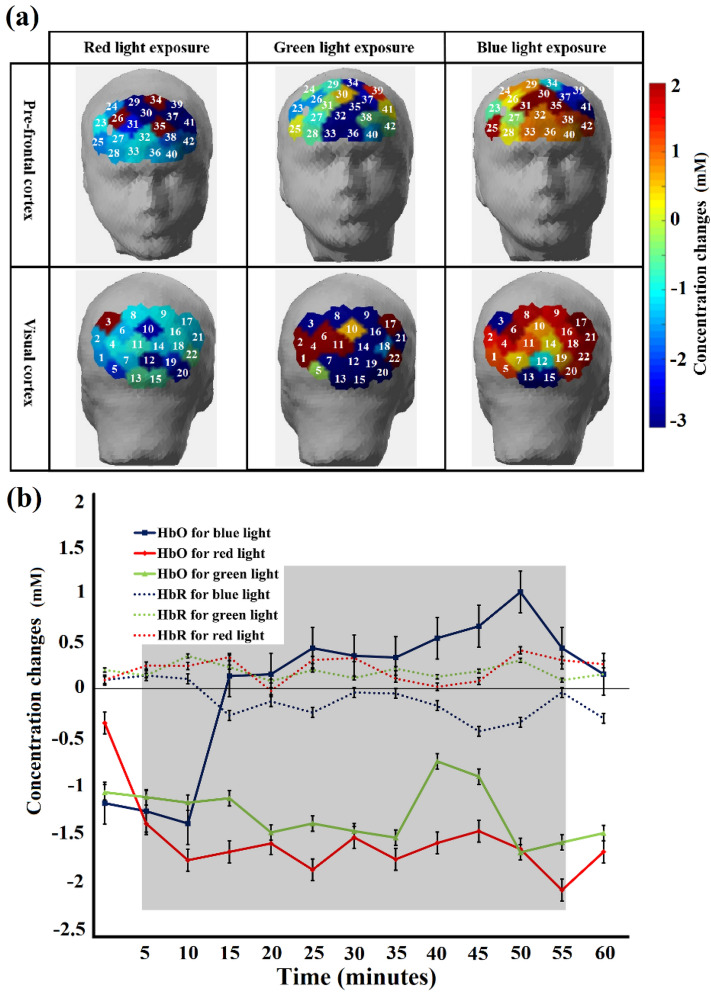
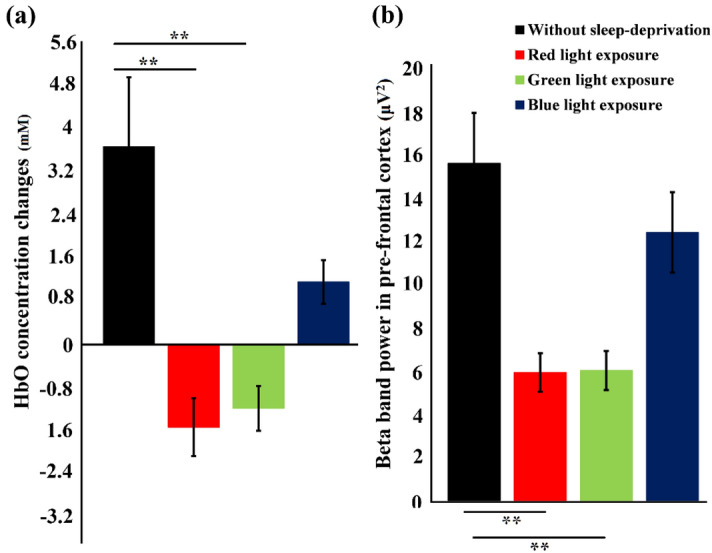
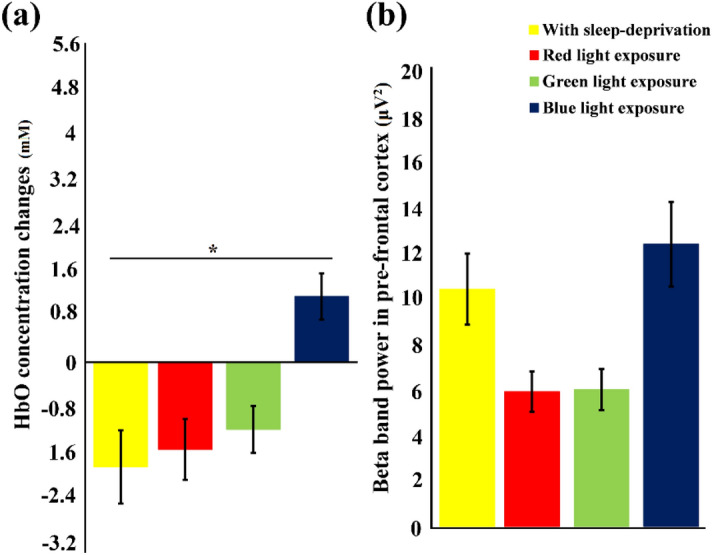
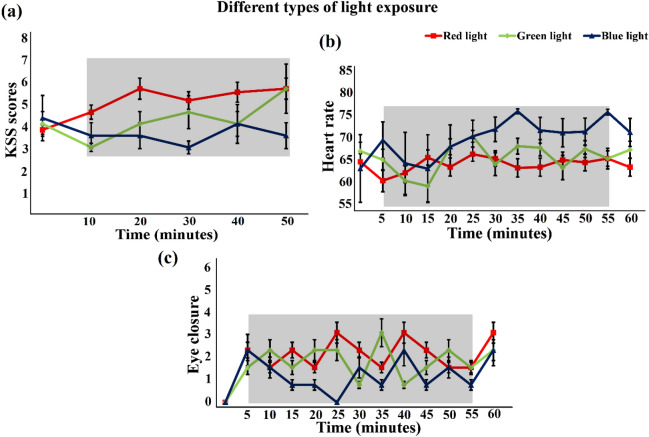
Drowsy driving is a common, but underestimated phenomenon in terms of associated risks as it often results in crashes causing fatalities and serious injuries. It is a challenging task to alert or reduce the driver's drowsy state using non-invasive techniques. In this study, a drowsiness reduction strategy has been developed and analyzed using exposure to different light colors and recording the corresponding electrical and biological brain activities. 31 subjects were examined by dividing them into 2 classes, a control group, and a healthy group. Fourteen EEG and 42 fNIRS channels were used to gather neurological data from two brain regions (prefrontal and visual cortices). Experiments shining 3 different colored lights have been carried out on them at certain times when there is a high probability to get drowsy. The results of this study show that there is a significant increase in HbO of a sleep-deprived participant when he is exposed to blue light. Similarly, the beta band of EEG also showed an increased response. However, the study found that there is no considerable increase in HbO and beta band power in the case of red and green light exposures. In addition to that, values of other physiological signals acquired such as heart rate, eye blinking, and self-reported Karolinska Sleepiness Scale scores validated the findings predicted by the electrical and biological signals. The statistical significance of the signals achieved has been tested using repeated measures ANOVA and t-tests. Correlation scores were also calculated to find the association between the changes in the data signals with the corresponding changes in the alertness level.


Conflict of interest statement

The authors declare no competing interests.

Figures

Figure 1
Figure 1
Study schematic for the reduction in fatigue level: (a) Flow chart of the experimentation, data collection and analysis procedure of the study. (b) Electrical and optical collection of data from subjects’ brains and subsequent data preprocessing and relative feature extraction to generate topographic images resulting in awake/fatigued states of the brain. The details of the schematic and feature extraction process are provided in the Materials and Methods section.
Figure 2
Figure 2
(a) The four distinct template maps that best explain channel-wise changes in group mean HbO potential topographies across sleep-deprived (left two in figure) and non-sleep-deprived (right two) conditions in the prefrontal (upper two in figure) and visual (lower two) cortices. Blue represents a decrease in HbO response, while red illustrates an increase in HbO response. (b) Average (group-level of all participants) concentration changes in cerebral oxygenation (HbO and HbR) (mean ± SD) during a 50-min drive in a simulator under sleep-deprived conditions (upper in figure) and non-sleep deprivation (lower).
Figure 3
Figure 3
(a) The average topography of spatial distributions of the EEG band powers that best explained the changes in band powers across the sleep-deprived and non-sleep-deprived conditions. (b) Average normalized time course values of beta EEG band (mean ± SD) under sleep-deprived and non-sleep-deprived conditions for pre-frontal cortex. Drastic discrepancies appear in the EEG beta band across these two conditions.
Figure 4
Figure 4
KSS scores, HR, and EC. (a) KSS scores (mean ± SD) of 5 time periods (10 min of each period) (x-axis) during a sleep-deprived and non-sleep-deprived 50-min drive in a simulator. (b) Average HRs (mean ± SD) of 5-min bins (x-axis) across all the participants under sleep-deprived and non-sleep-deprived conditions during a 50-min drive in a simulator. (c) Average EC rates (mean ± SD) of 5-min bins (x-axis) across all participants under sleep-deprived and non-sleep-deprived conditions during a 50-min drive in a simulator.
Figure 5
Figure 5
(a). The six distinct template maps that best explained channel-wise changes in group mean HbO potential topographies across sleep-deprived conditions for different colors of light exposures (red, green and blue) in prefrontal (upper three in figure) and visual (lower three) cortices. Blue represents a decrease in HbO response, while red illustrates an increase in HbO response. (b) Average (group-level of all participants) concentration changes in cerebral oxygenation (HbO and HbR) (mean ± SD) for different colors of light (red, green and blue) during a 60-min drive in a simulator under the sleep-deprived condition. The shaded area represents the time interval during the task/stimulation period (exposure of different colors of light). The time series is subdivided into 5 min each time period. HbO for blue light exposure differed significantly after approximately 15 min of light exposure in comparison with exposure to other colors of light.
Figure 6
Figure 6
(a) The average topography of spatial distributions of EEG beta band power that best explained changes in beta band powers across sleep-deprived and sleep-deprived conditions with exposure to different colors of light. (b) Average normalized time course values of the EEG beta band (mean ± SD) for exposure to different colors of light (red, green and blue) under sleep-deprived conditions for pre-frontal cortex region. The shaded area represents the time interval during the task/stimulation period (exposure of different colors of light). The time series is subdivided into 5 min each time period. Drastic discrepancies appear in the EEG beta band after exposure to blue light in contrast with red and green light exposure.
Figure 7
Figure 7
Statistical comparison of (a) HbO concentration changes (b) and EEG beta band power in pre-frontal cortex. The standard deviation is represented by the error bars. Significant differences in HbO for red and green light exposure and without sleep deprivation data (p < αcritical) is observed. Similarly, beta band power for red and green light exposure and without sleep deprivation data also show significant differences (p < αcritical). Whereas, in both HbO and beta band power for blue light exposure shows a trend similar to without sleep deprivation data. ** represented significant difference (p < αcritical).
Figure 8
Figure 8
Statistical comparison of (a) HbO concentration changes (b) and EEG beta band power in pre-frontal cortex. The standard deviation is represented by the error bars. Significant differences in HbO for blue light exposure and with sleep deprivation data (p < αcritical) is observed. Similarly, beta band power for blue light exposure shows a trend different from sleep deprivation data, although, not significant, but similar to without sleep deprivation data. The visible differences but not significant (p > αcritical) in all other parameters of fNIRS and EEG for red and green light exposures can be viewed. * represented the significant difference (p < αcritical).
Figure 9
Figure 9
Subjects’ state identification using KSS scores, HR, and EC. The shaded area represents the time interval during the task/stimulation period (exposure to different colors of light). (a) KSS scores (mean ± SD) for different colors of light (red, green and blue) under sleep-deprived conditions in 5 time periods (10 min of each time period measured only in stimulation duration) (x-axis) during a 60-min drive in a simulator. (b) Average HRs (mean ± SD) of 5-min bins (x-axis) across all participants for different colors of light (red, green and blue) under sleep-deprived conditions during a 60-min drive in a simulator. (c) Average EC rates (mean ± SD) of 5-min bins (x-axis) across all participants for different colors of light (red, green and blue) under sleep-deprived conditions during a 60-min drive in a simulator.

Similar articles

Cited by

References

    1. National Center on Sleep Disorders Research. Drowsy driving and automobile crashes: report and recommendations (2013).
    1. Moradi A, Nazari SS, Rahmani K. Sleepiness and the risk of road traffic accidents: A systematic review and meta-analysis of previous studies. Transp. Res. Part F: Traffic Psychol. Behav. 2019;65:620–629. doi: 10.1016/j.trf.2018.09.013. - DOI
    1. Caldwell JA, Caldwell JL, Thompson LA, Lieberman HR. Fatigue and its management in the workplace. Neurosci. Biobehav. Rev. 2019;96:272–289. doi: 10.1016/j.neubiorev.2018.10.024. - DOI - PubMed
    1. Axelsson J, Ingre M, Kecklund G, Lekander M, Wright KP, Jr, Sundelin T. Sleepiness as motivation: a potential mechanism for how sleep deprivation affects behavior. Sleep. 2020;43(6):zsz291. doi: 10.1093/sleep/zsz291. - DOI - PMC - PubMed
    1. Wang H, et al. Genome-wide association analysis of self-reported daytime sleepiness identifies 42 loci that suggest biological subtypes. Nat. Commun. 2019;10(1):3503. doi: 10.1038/s41467-019-11456-7. - DOI - PMC - PubMed

Publication types