. 2023 Apr 20;6(1):368.
doi: 10.1038/s42003-023-04755-9.

Human immune and gut microbial parameters associated with inter-individual variations in COVID-19 mRNA vaccine-induced immunity

Affiliations

Human immune and gut microbial parameters associated with inter-individual variations in COVID-19 mRNA vaccine-induced immunity

Masato Hirota et al. Commun Biol. .

Abstract

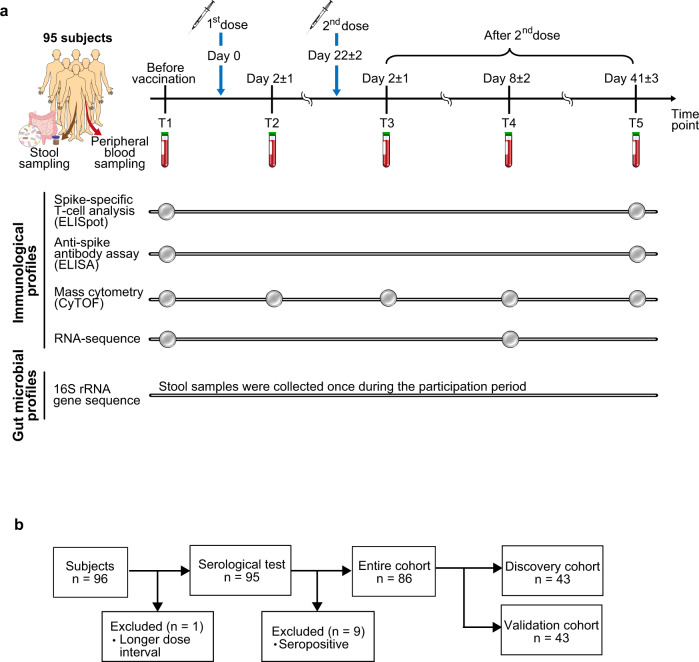
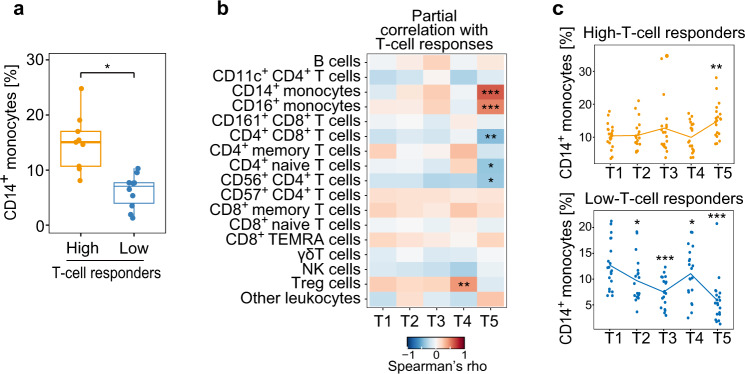
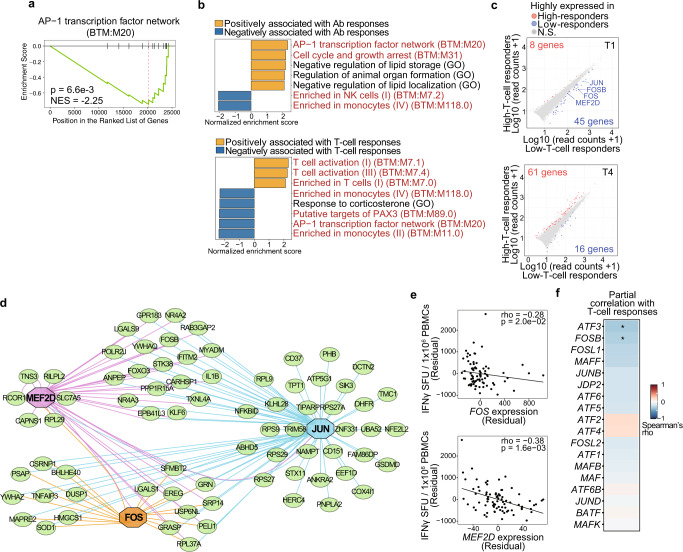
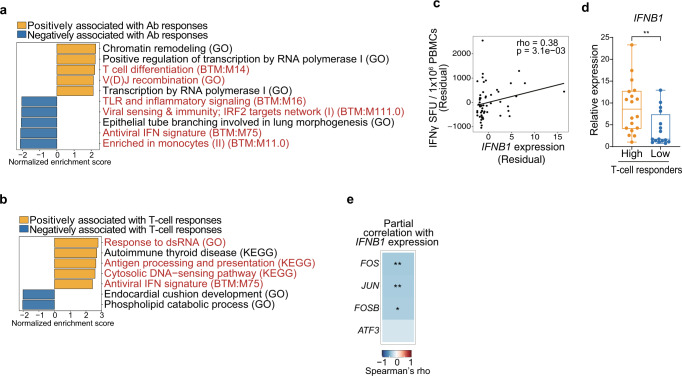
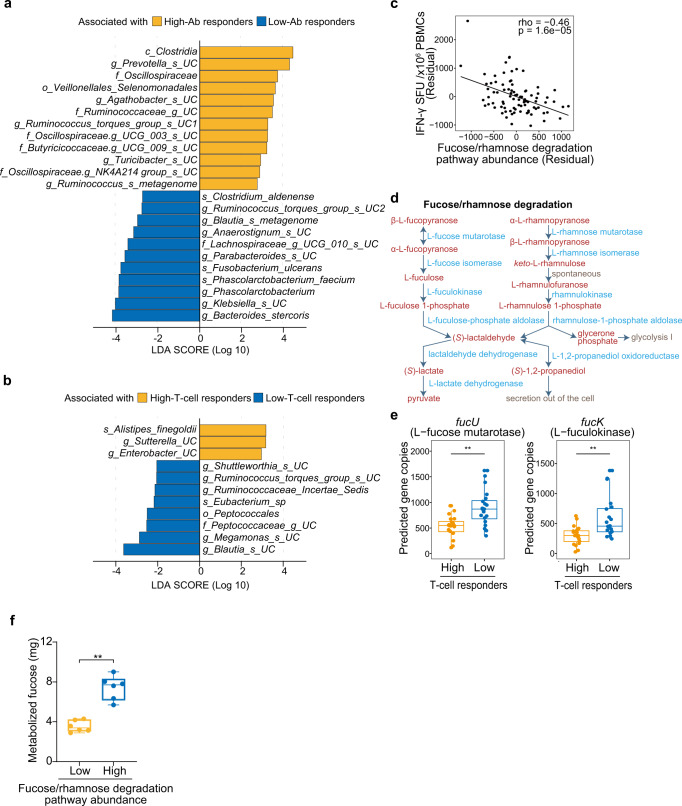
COVID-19 mRNA vaccines induce protective adaptive immunity against SARS-CoV-2 in most individuals, but there is wide variation in levels of vaccine-induced antibody and T-cell responses. However, the mechanisms underlying this inter-individual variation remain unclear. Here, using a systems biology approach based on multi-omics analyses of human blood and stool samples, we identified several factors that are associated with COVID-19 vaccine-induced adaptive immune responses. BNT162b2-induced T cell response is positively associated with late monocyte responses and inversely associated with baseline mRNA expression of activation protein 1 (AP-1) transcription factors. Interestingly, the gut microbial fucose/rhamnose degradation pathway is positively correlated with mRNA expression of AP-1, as well as a gene encoding an enzyme producing prostaglandin E2 (PGE2), which promotes AP-1 expression, and inversely correlated with BNT162b2-induced T-cell responses. These results suggest that baseline AP-1 expression, which is affected by commensal microbial activity, is a negative correlate of BNT162b2-induced T-cell responses.


Conflict of interest statement

The authors declare no competing interests.

Figures

Fig. 1
Fig. 1. Study design.
a Schematic diagram showing blood and stool sample collection and analysis performed in this study. Samples from 95 subjects who received two doses of BNT162b2 at 3–4-week intervals were analyzed. b Schematic diagram showing data analysis approaches. The entire cohort (86 subjects who were seronegative for SARS-CoV-2 spike at baseline) were divided into the discovery and validation cohorts (n = 43 each). The discovery cohort or entire cohort was used to identify factors associated with COVID-19 antibody or T-cell responses, and factors identified in the discovery cohort were subjected to confirmation in the validation cohort.
Fig. 2
Fig. 2. Late monocyte responses are associated with BNT162b2-induced adaptive immunity.
Frequency of immune cell populations in PBMCs was analyzed by CyTOF. a Frequency of CD14+ monocytes in high- and low-T-cell responders (n = 9 and 10, respectively) in the validation group. p values were calculated with Wilcoxon signed rank tests with Benjamini–Hochberg FDR correction (*P < 0.05). Boxes show median and 25th–75th percentiles, and whiskers show the range. b Heat map showing the correlation between the frequency of immune cell populations and vaccine-induced T-cell responses in the entire cohort (n = 86). TEMRA, terminally differentiated effector memory; NK, natural killer. Partial correlation analyses with adjustments for age and sex were performed with Spearman’s correlation tests with Benjamini–Hochberg FDR correction (*P < 0.05, **P < 0.01, ***P < 0.001). c Kinetics of the frequency of CD14+ monocytes in PBMCs during vaccine response. High-T-cell responders (upper panel, n = 20) and low-T-cell responders (lower panel, n = 20) in the entire cohort were analyzed. P values were calculated with the Wilcoxon signed rank tests with Benjamini–Hochberg FDR correction (*P < 0.05, **P < 0.01, ***P < 0.001).
Fig. 3
Fig. 3. Transcripts associated with BNT162b2-induced adaptive immunity.
Transcriptomes of PBMCs isolated at time points T1 and T4 were analyzed by bulk RNA-seq. a AP-1 transcription factor network was identified in GSEA on a ranked gene list based on the Spearman’s correlation coefficient between RNA expression and vaccine-induced T-cell responses in the validation cohort (n = 43). NES normalized enrichment score. b GSEA on a ranked gene list based on the Spearman’s correlation coefficient between RNA expression and vaccine-induced T-cell or antibody responses in the entire cohort (n = 86). Immune-related pathways are shown in red. c Scatterplots showing DEGs between high- (n = 18 at T1, n = 19 at T4) and low- (n = 19 at T1, n = 18 at T4) T-cell responders in the entire cohort. DEGs: differentially expressed genes (log2 FC > 0.5, adjusted P < 0.05). Blue and red dots indicate genes that were highly expressed in the sample groups shown on the X axis and Y axis, respectively. N.S. not significant. d Gene regulatory network analysis of DEGs between high- and low-T-cell responders in the entire cohort. e Scatterplots showing correlations between vaccine-induced T-cell responses and expression of FOS and MEF2D. SFU, spot-forming units. Spearman’s rho coefficient and P values are indicated in the plots. f Heat map showing correlations between vaccine-induced T-cell responses and expression of AP-1 genes (n = 86). a, b, e, f Partial correlation analyses with adjustments for age and sex were performed with Spearman’s correlation tests with Benjamini–Hochberg FDR correction.
Fig. 4
Fig. 4. Association between baseline FOS expression and ex vivo type I IFN responses induced by BNT162b2 mRNA.
PBMCs collected from subjects (n = 86) in the entire cohort at T1 were stimulated with BTN162b2 mRNA for 6 h and analyzed by bulk RNA-seq (ac, e) or qPCR (d). a, b GSEA on a ranked gene list based on Spearman’s correlation coefficient between RNA expression and vaccine-induced antibody responses (a) or T-cell responses (b). Immune-related pathways are shown in red. c Correlation analysis between IFNB1 expression induced by ex vivo BNT162b2 mRNA stimulation and vaccine-induced T cell responses. d IFNB1 mRNA expression in high- (n = 18) and low- (n = 16) T-cell responders in the entire cohort was analyzed by qPCR. The P value was calculated with Wilcoxon signed rank test (**P < 0.01). Boxes show median and 25th–75th percentiles, and whiskers show the range. e Correlation analysis between IFNB1 expression induced by ex vivo BNT162b2 mRNA stimulation and baseline expression of FOS, FOSB, JUN, or ATF3. c, e Partial correlation analyses with adjustments for age and sex were performed with Spearman’s correlation tests with Benjamini–Hochberg FDR correction.
Fig. 5
Fig. 5. Association between baseline FOS expression and ex vivo responses of PBMC to BNT162b2 mRNA.
PBMCs isolated from subjects who exhibited high- or low-FOS expression in the bulk RNA-seq analysis (high- and low-FOS subjects, n = 4 each) were either unstimulated or stimulated with BNT162b2 mRNA for 6 or 16 h, followed by scRNA-seq analysis. a Schematic illustrating the experimental design of scRNA-seq of high- and low-FOS subjects. b Violin plots showing expression of FOS in PBMCs unstimulated (left panel) and stimulated with BNT162b2 mRNA for 16 h (right panel). FOS expression levels in each immune cell population were compared between high- and low-FOS subjects (n = 4 each). P values were calculated with Wilcoxon rank-sum tests with Benjamini–Hochberg FDR correction (***P < 0.001). c GSEA on a ranked gene list based on the change in expression in CD14+ monocytes, CD4+ T cells, and CD8+ T cells unstimulated or stimulated with BNT162b2 mRNA for 16 h between high- and low-FOS subjects. Immune-related pathways are shown in red.
Fig. 6
Fig. 6. Gut microbes associated with BNT162b2-induced adaptive immunity.
Microbiomes of stool samples were analyzed by 16 S ribosomal RNA gene sequencing. a, b LEfSe analysis of gut microbes that were differentially abundant in high- vs low-antibody (Ab) responders (a) and in high- vs low-T-cell responders (b) in the entire cohort (n = 20 each). c, class; o, order; f, family; g, genus; s, species; UC, unclassified. c Scatterplot showing a correlation between the gut microbial fucose/rhamnose degradation pathway and vaccine-induced T-cell responses in the entire cohort (n = 86). Partial correlation analysis with adjustments for age, sex, and stool sampling timing was performed with Spearman’s correlation tests. d Schematic showing the fucose/rhamnose degradation pathway. Metabolites and enzymes involved in the pathway are shown in red and blue, respectively. e Analysis of the abundance of predicted gene copies for l-fucose mutarotase and l-fuculokinase in high- and low-T-cell responders (n = 20 each) in the entire cohort. f Metabolized fucose levels in stool slurry incubated with fucose in vitro for 20 h. e, f P values were calculated with Wilcoxon rank-sum tests with Benjamini–Hochberg FDR correction (**P < 0.01). Boxes show median and 25th–75th percentiles, and whiskers show the range.
Fig. 7
Fig. 7. The gut microbial fucose/rhamnose degradation pathway is associated with AP-1 expression.
a Heat map showing the correlation between the gut microbial fucose/rhamnose degradation pathway and transcription factors associated with BNT162b2-induced T-cell responses in the entire cohort (n = 86). b Schematic showing the production of SCFAs from the fucose/rhamnose degradation pathway. SCFAs are shown in red. ce Correlation analysis between PTGS2 expression and fucose/rhamnose degradation (c), AP-1 expression (d), or vaccine-induced T-cell responses (e) in the entire cohort. a, ce Partial correlation analyses with adjustments for age, sex, and stool sampling timing were performed with Spearman’s correlation tests with Benjamini–Hochberg FDR correction (**P < 0.01, ***P < 0.001). f qPCR analysis of PTGS2 mRNA levels in PBMCs untreated or treated with (S)-1,2-propanediol or SCFAs for 18 h (n = 6). P values were calculated using Friedman test followed by Dunn’s multiple comparison test (*P < 0.05). g qPCR analysis of FOS mRNA levels in PBMCs untreated or treated with PGE2 for 18 h (n = 8). The P value was calculated with the Wilcoxon signed rank test (*P < 0.05). f, g Boxes show median and 25th–75th percentiles, and whiskers show the range.

References

    1. Polack FP, et al. Safety and efficacy of the BNT162b2 mRNA Covid-19 vaccine. N. Engl. J. Med. 2020;383:2603–2615. doi: 10.1056/NEJMoa2034577. - DOI - PMC - PubMed
    1. Baden LR, et al. Efficacy and safety of the mRNA-1273 SARS-CoV-2 vaccine. N. Engl. J. Med. 2021;384:403–416. doi: 10.1056/NEJMoa2035389. - DOI - PMC - PubMed
    1. Dagan N, et al. BNT162b2 mRNA Covid-19 vaccine in a nationwide mass vaccination setting. N. Engl. J. Med. 2021;384:1412–1423. doi: 10.1056/NEJMoa2101765. - DOI - PMC - PubMed
    1. Hall VJ, et al. COVID-19 vaccine coverage in health-care workers in England and effectiveness of BNT162b2 mRNA vaccine against infection (SIREN): a prospective, multicentre, cohort study. Lancet. 2021;397:1725–1735. doi: 10.1016/S0140-6736(21)00790-X. - DOI - PMC - PubMed
    1. Pilishvili T, et al. Effectiveness of mRNA Covid-19 vaccine among U.S. health care personnel. N. Engl. J. Med. 2021;385:e90. doi: 10.1056/NEJMoa2106599. - DOI - PMC - PubMed

Publication types