. 2023 Jun;7(6):889-902.
doi: 10.1038/s41559-023-02044-6. Epub 2023 Apr 20.

Single-cell adaptations shape evolutionary transitions to multicellularity in green algae

Affiliations

Single-cell adaptations shape evolutionary transitions to multicellularity in green algae

Charlie K Cornwallis et al. Nat Ecol Evol. 2023 Jun.

Abstract

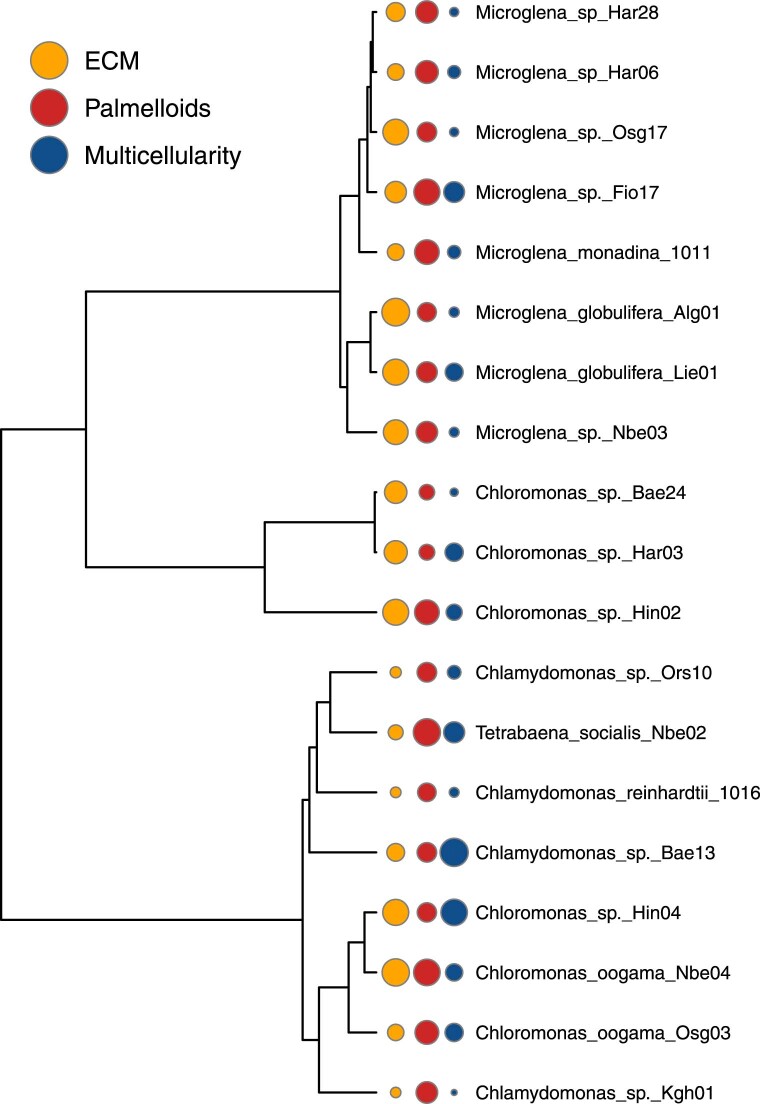
The evolution of multicellular life has played a pivotal role in shaping biological diversity. However, we know surprisingly little about the natural environmental conditions that favour the formation of multicellular groups. Here we experimentally examine how key environmental factors (predation, nitrogen and water turbulence) combine to influence multicellular group formation in 35 wild unicellular green algae strains (19 Chlorophyta species). All environmental factors induced the formation of multicellular groups (more than four cells), but there was no evidence this was adaptive, as multicellularity (% cells in groups) was not related to population growth rate under any condition. Instead, population growth was related to extracellular matrix (ECM) around single cells and palmelloid formation, a unicellular life-cycle stage where two to four cells are retained within a mother-cell wall after mitosis. ECM production increased with nitrogen levels resulting in more cells being in palmelloids and higher rates of multicellular group formation. Examining the distribution of 332 algae species across 478 lakes monitored over 55 years, showed that ECM and nitrogen availability also predicted patterns of obligate multicellularity in nature. Our results highlight that adaptations of unicellular organisms to cope with environmental challenges may be key to understanding evolutionary routes to multicellular life.


Conflict of interest statement

The authors declare no competing interests.

Figures

Fig. 1
Fig. 1. Multicellular group formation across wild strains of green algae depends on water turbulence, predation and nitrate levels.
a, Unicellular green algae were isolated from lakes across southern Sweden. Red dots show the lakes where strains used in experiments were collected, and black triangles show the 478 monitored lakes. b, Unicellular species with and without ECM. c, Four cells retained in a palmelloid after cell division. d, A multicellular group formed by a unicellular species in response to environmental conditions. e,f, Strains formed multicellular groups in response to experimental manipulation of environmental conditions: predator presence, nitrate levels and water turbulence. When exposed to more turbulent water, higher levels of nitrate and Brachionus predators, higher percentages of cells were found in multicellular groups. Lines indicate comparisons with pMCMC values from Bayesian phylogenetic mixed models (Methods ‘Statistical analyses’ and Supplementary Table 5). Small points represent values for each of the 35 strains examined across predation, nitrogen and turbulence treatments (274 data points). Large points with error bars (±1 standard error of the mean (SEM)) are the overall treatment means. Source data
Fig. 2
Fig. 2. Multicellularity was not associated with fitness under any experimental conditions.
a,b, The presence of multicellular groups (a) and the percentage of cells in multicellular groups (b) were not related to algal-population growth rates in the absence or presence of predators. c,d, The percentage of cells in multicellular groups among strains that formed groups was not related to algal-population growth rates when predation pressure was manipulated (c) and did not reduce the population growth of predators (d). In d, predators were unable to survive on some strains of the Microglena clade, generating a bimodal distribution of predator-population growth rates in the no-multicellular-group category. We suspect this is either because they produce toxins or provide limited nutrients for Brachionus. Sample sizes across panels: 35 strains examined across predation, nitrogen and turbulence treatments = 274 data points (a); 28 strains formed groups examined across predation, nitrogen and turbulence treatments = 79 data points (b); 10 strains formed groups across control, low and high treatments = 17 data points (c) and 34 strains examined across low- and high-predation treatments = 57 data points (d). The box plots show the median as the central line, the 25th and 75th percentiles as hinges and the extreme values within 1.5× the interquartile range as the whiskers. Source data
Fig. 3
Fig. 3. Multicellular group formation is associated with the retention of reproductive cells (palmelloids) surrounded by ECM.
a, In environments with higher levels of nitrate with more turbulent water, higher percentages of cells were found in palmelloids that was positively related to the percentages of cells in multicellular groups. Points represent values for each of the 28 strains that formed multicellular groups across predation, nitrogen and turbulence treatments = 79 data points. Regression lines are plotted with 95% confidence intervals as shaded areas. b, The percentage of cells retained within palmelloids over time (log2(% cells at day 0 / % cells at day 14)) was higher in strains that produced ECM. Line indicates comparisons with pMCMC values from Bayesian phylogenetic mixed models (Methods ‘Statistical analyses’ and Supplementary Table 11). Points are values for each of the 35 strains examined across predation, nitrogen and turbulence treatments = 274 data points. The box plot shows the median as the central line, the 25th and 75th percentiles as hinges and the extreme values within 1.5× the interquartile range as the whiskers. Source data
Fig. 4
Fig. 4. The production of ECM depends on environmental conditions and carries a fitness cost.
a, The probability of producing ECM (>10% cells with ECM) was higher in more nitrate-rich environments. Lines indicate comparisons with pMCMC values from Bayesian phylogenetic mixed models (Methods ‘Statistical analyses’ and Supplementary Table 12). Means across 35 strains with standard error bars (± 1 SEM) are presented. b, The population growth of algal strains that produced ECM was significantly lower than those that lacked ECM across all environments (pMCMC = 0.028; Supplementary Table 14), but particularly when nitrate was low (low N pMCMC = 0.008; Supplementary Table 14). Points are mean values for each of the 35 strains. The box plot shows the median as the central line, the 25th and 75th percentiles as hinges and the extreme values within 1.5× the interquartile range as the whiskers. Source data
Fig. 5
Fig. 5. The evolution of obligate multicellularity and ECM is associated with levels of ammonium across Swedish lakes.
a, Phylogeny of multicellular (blue, Ngenera = 66) and unicellular (yellow, Ngenera = 48) genera with (cyan points) and without (grey points) ECM in relation to ammonium concentrations (size of green circles) across 478 lakes in Sweden. A maximum-clade credibility tree of the 1,500 trees sampled for analyses was used for plotting. b, The probability that unicellular genera produce ECM increased with the level of ammonium levels in lakes (17 genera with data on ECM; Supplementary Table 4). c, Multicellular genera (Ngenera = 47) had a much higher probability of having ECM than unicellular genera (Ngenera = 17). Large triangles are means across genera with standard errors (± 1 SEM). d, The probability that genera without ECM (Ngenera = 13) were multicellular increased with ammonium concentrations in lakes, whereas genera with ECM (Ngenera = 51) had a high probability of being multicellular irrespective of ammonium concentrations. In bd, round points represent individual genera with sizes proportional to the number of species recorded for each genus. In b and d, lines are logistic regressions with 95% confidence intervals. Source data
Extended Data Fig. 1
Extended Data Fig. 1. Phylogeny of the strains used in the experiment.
The circle sizes represent the maximum percentage of cells observed across all experimental conditions with extracellular matrix in orange, palmelloids in red and multicellular groups in blue. A maximum clade credibility tree of the 1500 trees sampled for analyses was used for plotting. Source data
Extended Data Fig. 2
Extended Data Fig. 2. The reduction in growth rate caused by turbulent water conditions and predation.
Small points represent values for each of the 35 strains examined across predation, nitrogen and turbulence treatments = 274 data points. Large points with error bars (±1 SEM) are the overall treatment means. Source data
Extended Data Fig. 3
Extended Data Fig. 3. Multicellularity was not associated with relative growth rate under any experimental conditions.
(a) The presence of multicellular groups and (B) the percentage of cells in multicellular groups were not related to relative algal-population growth rates in the absence or presence of predators. In A, large points with error bars (±1 SEM) are the overall treatment means. Sample sizes across panels: (A) 35 strains examined across predation, nitrogen and turbulence treatments = 274 data points; (b) 28 strains formed groups examined across predation, nitrogen and turbulence treatments = 79 data points. Source data
Extended Data Fig. 4
Extended Data Fig. 4. Evaluation of the causal relationships between extracellular matrix (ECM), % cells in Palmelloids (Palmelloids) and % of cells in multicellular groups (Multicellular) using phylogenetic path analysis.
(a) Directed acyclic graphs (DAGs) of the different hypothetical causal models tested. (b) Summary of support for different causal models assessed using C-statistic information criterion corrected for small sample size (CICc) weights (higher weights = greater support). The numbers next to each bar are P values from d-separation tests examining if the model could be rejected based on the data (sample sizes: 35 strains examined across predation, nitrogen and turbulence treatments = 274 data points. P < 0.05 indicates that the model was rejected). Red bars show the top supported models that were not significantly different (a difference of less than 2 CICc units). (c) A path diagram of the standardised path coefficients averaged across the two best-supported models: ecm1 and palm3. (d) The standardised path coefficients with SEs from the best-supported model: ecm1. Source data

Similar articles

Cited by

References

    1. Ruiz-Trillo, I. & Nedelcu, A. M. Evolutionary Transitions to Multicellular Life: Principles and Mechanisms (Springer Berlin Heidelberg, 2015).
    1. Niklas, K. J. & Newman, S. A. Multicellularity: Origins and Evolution (MIT Press, 2016).
    1. Herron, M. D., Conlin, P. L. & Ratcliff, W. C. The Evolution of Multicellularity (Routledge, 2022).
    1. van Gestel J, Tarnita CE. On the origin of biological construction, with a focus on multicellularity. Proc. Natl Acad. Sci. USA. 2017;114:11018–11026. doi: 10.1073/pnas.1704631114. - DOI - PMC - PubMed
    1. Maynard-Smith, J. & Szathmary, E. The Major Transitions in Evolution (Oxford Univ. Press, 1997).