. 2023 May;24(5):792-801.
doi: 10.1038/s41590-023-01475-4. Epub 2023 Apr 20.

TREM2 macrophages drive NK cell paucity and dysfunction in lung cancer

Affiliations

TREM2 macrophages drive NK cell paucity and dysfunction in lung cancer

Matthew D Park et al. Nat Immunol. 2023 May.

Abstract

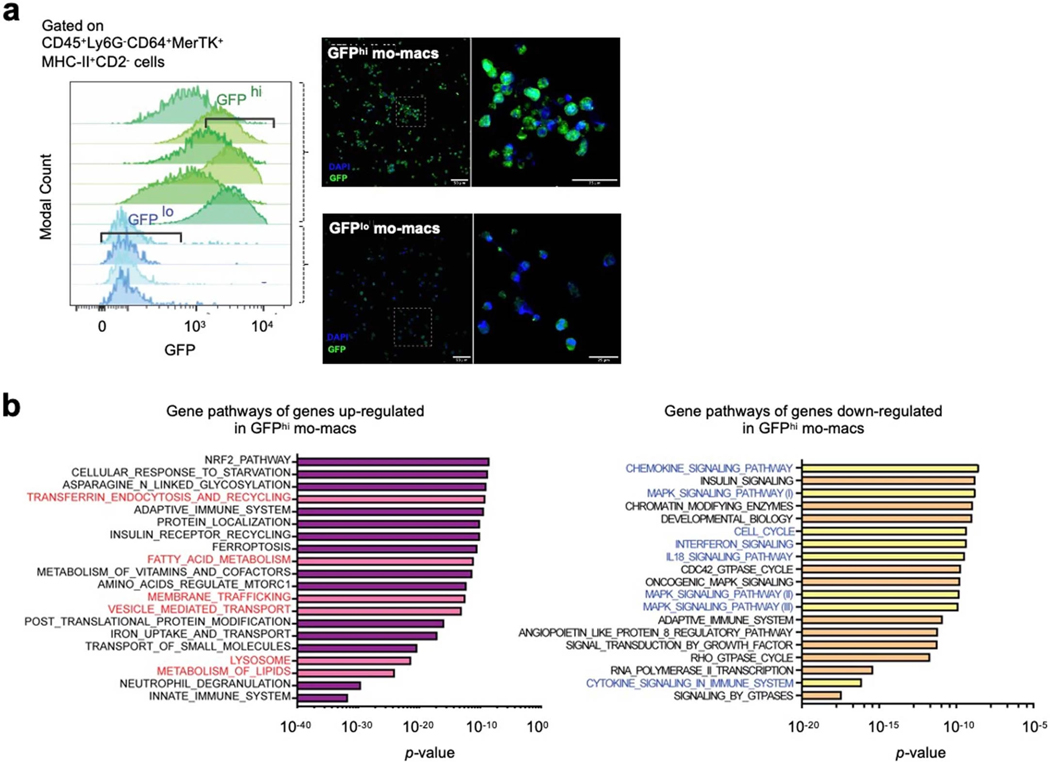
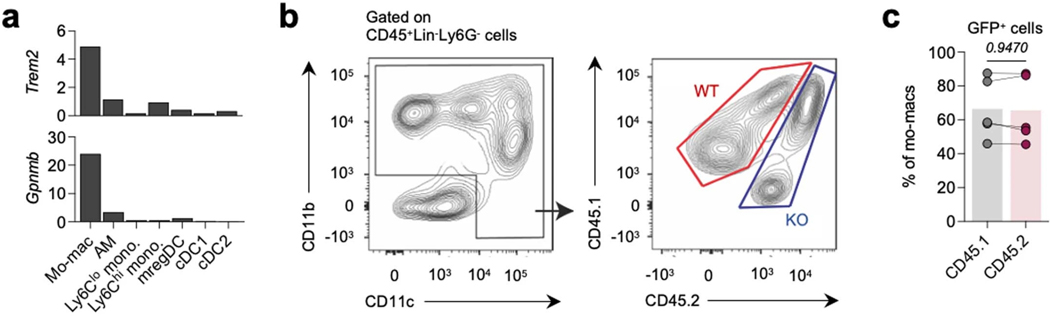
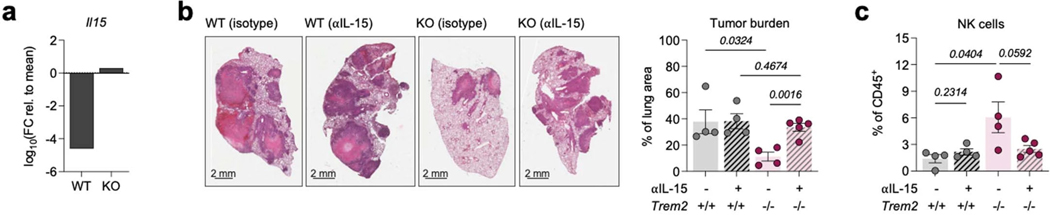
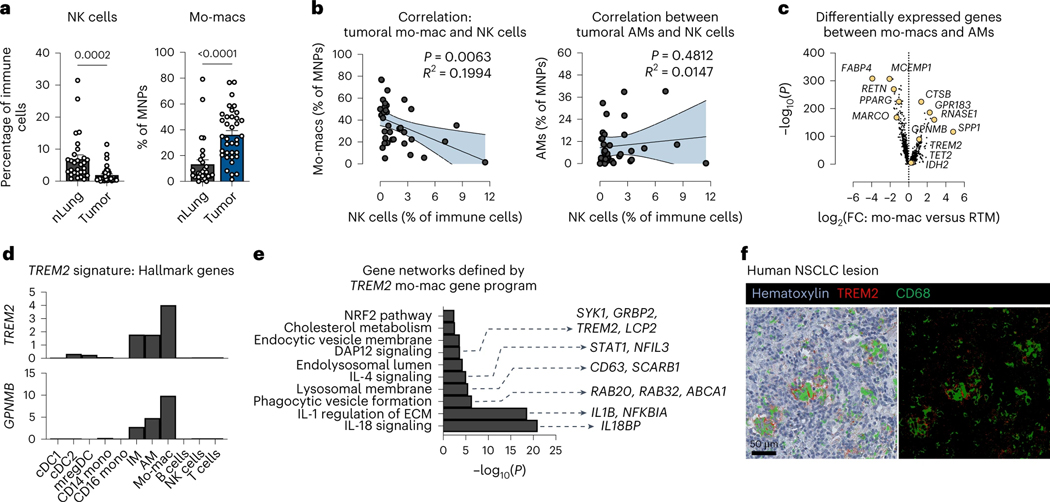
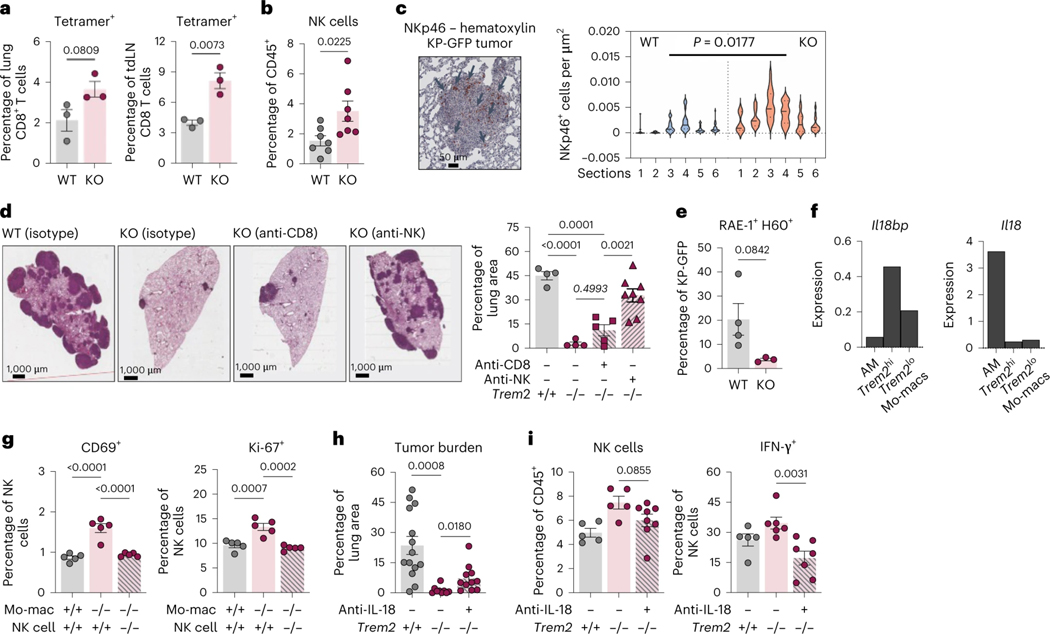
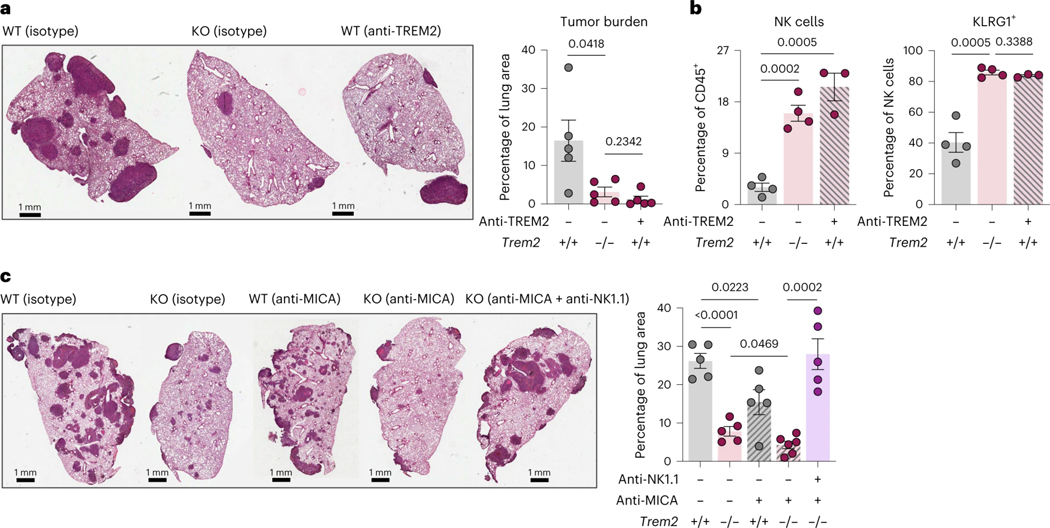
Natural killer (NK) cells are commonly reduced in human tumors, enabling many to evade surveillance. Here, we sought to identify cues that alter NK cell activity in tumors. We found that, in human lung cancer, the presence of NK cells inversely correlated with that of monocyte-derived macrophages (mo-macs). In a murine model of lung adenocarcinoma, we show that engulfment of tumor debris by mo-macs triggers a pro-tumorigenic program governed by triggering receptor expressed on myeloid cells 2 (TREM2). Genetic deletion of Trem2 rescued NK cell accumulation and enabled an NK cell-mediated regression of lung tumors. TREM2+ mo-macs reduced NK cell activity by modulating interleukin (IL)-18/IL-18BP decoy interactions and IL-15 production. Notably, TREM2 blockade synergized with an NK cell-activating agent to further inhibit tumor growth. Altogether, our findings identify a new axis, in which TREM2+ mo-macs suppress NK cell accumulation and cytolytic activity. Dual targeting of macrophages and NK cells represents a new strategy to boost antitumor immunity.


Figures

Extended Data Figure 1.
Extended Data Figure 1.. Purification and active signaling pathways in GFPlo and GFPhi mo-macs.
a) Flow cytometry sort strategy (left) for purifying GFPhi and GFPlo mo-macs from single-cell suspensions of digested KP-GFP tumor-bearing lungs at four weeks post-inoculation of KP-GFP cells. Histograms show the fluorescence spectrum of GFP in mo-macs from tumor-bearing lungs, comprised of GFPhi (green) and GFPlo (blue) mo-macs. Each row represents an individual replicate. Representative confocal immunofluorescence (IF) imaging of FACS-sorted GFPlo and GFPhi mo-macs (right). For each pair of images, a broad-field view with a region of interest (ROI, white outline) (left) and a magnification of the ROI (right) are shown. b) Gene set enrichment analysis (GSEA) (Broad Institute) for pathways annotated in the KEGG and Reactome databases performed on the significantly differentially regulated genes in GFPhi mo-macs, relative to GFPlo mo-macs. The top 15 most significantly enriched terms are shown, with notable pathways highlighted in red for up-regulated genes in GFPhi mo-macs (left) and up-regulated genes in GFPlo mo-macs (right).
Extended Data Figure 2.
Extended Data Figure 2.. scRNAseq profiling of mo-macs in chimeric mice.
a) Expression of Trem2 and Gpnmb, as hallmark genes of the TREM2 gene program, across cell subtypes (mo-macs, AMs, Ly6Clo and Ly6Chi monocytes, mregDCs, cDC1, and cDC2) identified by unsupervised clustering. b) Flow cytometry sort strategy to purify CD45.1 WT and CD45.2 KO fractions of MNPs from KP-GFP tumor-bearing chimeric mice. c) Flow cytometric quantification of GFP+ mo-macs, represented as relative frequency among total mo-macs from the purified CD45.1 WT and CD45.2 KO fractions of MNPs from KP-GFP tumor-bearing mice. Paired values shown for paired CD45.1 WT and CD45.2 KO cells that were purified from the same biological replicate. (mean ± standard error of mean (S.E.M.); paired two-tailed t-test at a 95% confidence interval)
Extended Data Figure 3.
Extended Data Figure 3.. Contributions of CD8 T cells and NK cells to tumor regression in KO mice.
a) Flow cytometric quantification of IFN-ɣ/TNF-α-producing CD8 T cells, as a relative frequency of total antigen-specific CD8 T cells, in the tumor-bearing lungs (left) and in the tumor-draining lymph nodes (tdLN) (right) of KP-GFP tumor-bearing WT and KO mice. (mean ± standard error of mean (S.E.M.); unpaired two-tailed t-test at a 95% confidence interval) b) Flow cytometric quantification of NK cells expressing activation/degranulation markers, as a relative frequency of total NK cells. (mean ± standard error of mean (S.E.M.); unpaired two-tailed t-test at a 95% confidence interval) c) Flow cytometric quantification of type 1 conventional dendritic cells (cDC1), as a relative frequency of CD45+ immune cells, in the tumor-bearing lungs of WT mice and KO mice treated with either an isotype control or CD8 (right) or NK cell (left)-depleting antibody. (mean ± standard error of mean (S.E.M.); unpaired two-tailed t-test at a 95% confidence interval) d) Quantification of the tumor area as a percent of the total area of the lung cross-section from tumor-bearing lungs of WT and KO mice treated with either an isotype control of NK cell-depleting antibody. e) Flow cytometric quantification of NK cells, as a relative frequency of CD45+ immune cells. (mean ± standard error of mean (S.E.M.); unpaired two-tailed t-test at a 95% confidence interval) f) Flow cytometric quantification of IFN-ɣ-producing (left) and TNF-α-producing (right) CD8 T cells in the tumor-bearing lungs of WT mice with isotype antibody, KO mice with isotype antibody, and KO mice given IL-18 neutralizing antibody. Data shown as a relative frequency among total CD8 T cells. (mean ± standard error of mean (S.E.M.); unpaired two-tailed t-test at a 95% confidence interval)
Extended Data Figure 4.
Extended Data Figure 4.. Cooperative IL-15 signaling is needed to confer the therapeutic benefit of a TREM2-deficient setting.
a) Relative expression of Il15 by mature mregDCs, as determined by scRNAseq profiling of MNPs in the tumor-bearing lungs of WT and KO mice (Figure 3C). b) Representative H&E images of tumor-bearing lungs of WT, isotype antibody (n = 4), WT mice that received the IL-15 neutralizing antibody (n = 4), KO, isotype antibody (n = 4), KO mice that received the IL-15 neutralizing antibody (n = 5) (left). Quantification of the tumor area as a percent of the total area of the lung cross-section (right) is shown. (mean ± standard error of mean (S.E.M.); unpaired two-tailed t-test at a 95% confidence interval) c) Flow cytometric quantification of NK cells, as a relative frequency of CD45+ immune cells, in the KP-GFP tumor-bearing lungs of isotype control WT and KO mice and WT and KO mice treated with the αIL-15 antibody. (mean ± standard error of mean (S.E.M.); unpaired two-tailed t-test at a 95% confidence interval)
Figure 1.
Figure 1.. TREM2+ monocyte-derived macrophages are major constituents of an NK cell-deprived microenvironment.
a) Cell frequency of NK cells identified by scRNAseq profiling as a percentage of immune cells (left) and the cell frequency of monocyte-derived macrophages (mo-macs) as a percentage of mononuclear phagocytes (MNPs) (right) in resected tumors (tumor) and patient-matched, non-involved adjacent lung tissues (nLung) from human non-small cell lung cancer (NSCLC) samples. (mean ± standard error of mean (S.E.M.); unpaired two-tailed t-test at a 95% confidence interval) b) Correlation between the frequency of tumor-infiltrating mo-macs (left) or alveolar macrophages (AMs) (right) and of intratumoral NK cells per patient. (Pearson correlation test was performed at a 95% confidence interval) c) Identification of the TREM2 gene program as a universal mo-mac cell state among differentially expressed genes that distinguish mo-macs from AMs. d) Expression of hallmark TREM2 program genes, showing specificity to mo-macs in the tumor microenvironment, relative to other immune cells identified by scRNAseq. e) Gene set enrichment analysis of gene networks that form amongst expressed genes in the TREM2 program from (c). f) Multiplex immunohistochemistry (mIHC) of human NSCLC lesions for TREM2 (red) and CD68 (green), shown with hematoxylin counterstain (left) and on a black negative background (right). Scale bar, 50 μm.
Figure 2.
Figure 2.. Uptake of cellular debris induces the TREM2 gene program in mo-macs.
a) (top) Confocal immunofluorescence IF) imaging of murine KP-GFP tumor-bearing lungs depicting GFP+ tumor cells (green) and TREM2+ cells (red) at different timepoints during tumor progression (day 7, 14, 21, and 28 post-inoculation). (bottom, left) Confocal IF imaging of KP-GFP tumor-bearing lungs after 28 days of engraftment and growth showing intracellular staining of nuclei (DAPI) and GFP (green) in TREM2+ cells (red). Middle and right images represent magnification of the region of interest (ROI, white outline); middle panel depicts cells staining for both DAPI and GFP (white arrow), and the right panel depicts cells staining for both GFP and TREM2 (white arrow). Scale bar, 50 μm. (bottom, right) Pictorial diagram showing relationship between efferocytosis and TREM2. b) Volcano plot of differentially expressed genes between GFPlo and GFPhi mo-macs. Statistical significance defined based on an adjusted P < 0.01. Significant genes are highlighted in either red (up-regulated upon tumor antigen capture) or blue (down-regulated upon tumor antigen capture). Data representative of two independent experiments. c) Expression of Trem2 signature genes and other select genes encoding machinery involved in phagocytosed cargo transport, antigen processing, and lipid metabolism by GFPlo and GFPhi mo-macs. Values shown as the logarithm of fold change of absolute number of transcripts relative to the mean value across replicates. d) Absolute expression (transcripts per million) of genes encoding LDL receptor, NPC1, and PLIN2 in GFPlo and GFPhi mo-macs. Paired values shown for paired GFPlo and GFPhi mo-macs that were purified from the same biological replicate. Data from two independent experiments. (mean ± standard error of mean (S.E.M.); unpaired two-tailed t-test at a 95% confidence interval) e) Absolute expression (transcripts per million) of genes encoding GPR183 and MARCKSL1 in GFPlo and GFPhi mo-macs. Paired values shown for paired GFPlo and GFPhi mo-macs that were purified from the same biological replicate. Data from two independent experiments. (mean ± standard error of mean (S.E.M.); unpaired two-tailed t-test at a 95% confidence interval) f) Relative qPCR quantification of Trem2, Gpnmb, and Apoe transcripts from in vitro differentiated bone marrow-derived macrophages (BMDMs) with or without (control) exposure to apoptotic KP-GFP cells. Briefly, BMDMs were differentiated and polarized with IL-4 and GM-CSF. KP-GFP cells were exposed to ultraviolet (UV) light for 30 min, left to undergo apoptosis overnight, and then added to BMDMs. After a four hour co-culture period, CD45+ CD64+ MerTK+ GFP+ cells were sorted by flow cytometry for PCR analysis. BMDMs cultured in the absence of apoptotic tumor cells were used as a negative control. Transcripts are shown as the two-fold difference in gene expression (ΔCt) over Ptprc expression. Data representative of two independent experiments. Values are shown as mean transcripts per million (TPM) ± standard error of mean (S.E.M.). (Unpaired two-tailed t-test at a 95% confidence interval)
Figure 3.
Figure 3.. TREM2 deficiency restricts tumor growth by remodeling the composition of MNPs.
a) Kaplan Meier survival curve of KP-GFP tumor-bearing WT (n = 8) and KO (n = 9) mice. b) Representative H&E images of tumor-bearing lungs of WT and KO mice at day 21 (WT, n = 4; KO, n = 4) and at day 28 (WT, n = 11; KO, n = 6) post-inoculation of tumor cells (left). Quantification of the tumor area as a percent of the total area of the lung cross-section (right) is shown. Data are representative of three independent experiments. (Multiple unpaired two-sampled t-tests) c) Clustering of mononuclear phagocytes (MNPs) based on scRNAseq profiling (CD45+ CD3 CD19 NK1.1 Ly6G CD11b+ CD11c+) from the tumor-bearing lungs of WT (n = 2) and KO (n = 2) mice, revealing cell frequency changes among Ly6Chi (inflammatory) and Ly6Clo (patrolling) monocytes, alveolar macrophages (AM), and Trem2+ mo-macs. Bar plot shows the composition of the monocyte-macrophage compartment in WT and KO mice. Frequencies for each group are shown as the mean of each pair of duplicates. d) Flow cytometric quantification of mo-macs, represented as relative frequency among CD45+ immune cells (left) and as absolute number of cells per lung (right) from tumor-bearing lungs of WT and KO mice at day 28 post-inoculation. The results shown are from one experiment, representative of five independent experiments. (mean ± standard error of mean (S.E.M.); unpaired two-tailed t-test at a 95% confidence interval) e) Flow cytometric quantification of AMs, represented as relative frequency among CD45+ immune cells (left) and as the absolute number of cells per lung (right), from tumor-bearing lungs of WT and KO mice at day 28 post-inoculation. The results shown are from one experiment, representative of five independent experiments. (mean ± standard error of mean (S.E.M.); unpaired two-tailed t-test at a 95% confidence interval) f) Flow cytometric quantification of cDC1, represented as the absolute number of cells per lung from tumor-bearing lungs of WT and KO mice at day 28 post-inoculation of tumor cells. The results shown are from one experiment, representative of five independent experiments. (mean ± standard error of mean (S.E.M.); unpaired two-tailed t-test at a 95% confidence interval) g) Sub-lethally irradiated CD45.1 WT recipient mice were reconstituted with CD45.1 WT (WT, n = 6), CD45.2 KO (KO, n = 6), or a 1:1 mixture of both CD45.1 WT and CD45.2 KO bone marrow cells (chimera, n = 6). Full donor marrow engraftment was confirmed after seven weeks.. Shown are representative H&E images of tumor-bearing lungs of WT, KO, and chimeric mice (left) at day 28 post-tumor cell inoculation. Quantification of the tumor area as a percent of the total area of the lung cross-section (right) is shown. (mean ± standard error of mean (S.E.M.); unpaired two-tailed t-test at a 95% confidence interval) h) Genes of the TREM2 gene program whose expression defines the TREM2 cell state. Frequencies of mo-macs in the TREM2hi and TREM2lo cell states, represented as a relative frequency among MNPs from the purified CD45.1 WT and CD45.2 KO fractions of MNPs from KP-GFP tumor-bearing chimeric mice. Paired values shown for paired CD45.1 WT and CD45.2 KO cells that were purified from the same biological replicate. (mean ± standard error of mean (S.E.M.); paired two-tailed t-test at a 95% confidence interval)
Figure 4.
Figure 4.. Therapeutic effect of TREM2 deficiency is critically dependent on intact IL-18 and IL-15 signaling.
a) Flow cytometric quantification of OVA-tetramer+ (antigen-specific) CD8 T cells, represented as the relative frequency among total CD8 T cells, in the lungs (left) and tumor-draining lymph nodes (tdLN) (right) of KP-GFP-OVA tumor-bearing WT and KO mice. (mean ± standard error of mean (S.E.M.); unpaired two-tailed t-test at a 95% confidence interval) b) Flow cytometric quantification of NK cells, represented as the relative frequency of CD45+ immune cells (left) and as absolute number of cells per lung (right), in the KP-GFP tumor-bearing lungs of WT and KO mice. (mean ± standard error of mean (S.E.M.); unpaired two-tailed t-test at a 95% confidence interval) c) Representative immunohistochemistry (IHC) staining of NKp46 for NK cells in a KP-GFP tumor from a KO mouse (left). Arrows mark positively-stained cells. Quantification of NKp46+ cells in a representative tissue section per lung sample from WT (n = 6) and KO (n = 6) mice (right). d) Representative H&E images of tumor-bearing lungs of WT, isotype antibody (n = 4), KO, isotype antibody (n = 4), KO mice depleted of CD8 T cells (KO+αCD8, n = 5), KO mice depleted of NK cells (KO+αNK, n = 8) at day 28 post-inoculation of tumor cells (left). Quantification of the tumor area as a percent of the total area of the lung cross-section (right) is shown. (mean ± standard error of mean (S.E.M.); unpaired two-tailed t-test at a 95% confidence interval) e) Flow cytometric quantification of RAE-1+H60+ tumor cells, as a relative frequency of total KP-GFP tumor cells, in the tumor-bearing lungs of WT and KO mice. (mean ± standard error of mean (S.E.M.); unpaired two-tailed t-test at a 95% confidence interval) f) Expression of the Il18bp (left) and Il18 (right) transcripts, as defined as the mean number of unique molecular identifiers (UMI), by AMs, Trem2hi mo-macs, and Trem2lo mo-macs, as identified by unsupervised clustering of scRNAseq profiling of MNPs in KP-GFP tumor-bearing WT and KO mice. g) Experimental schematic of in vitro co-culture study of mo-macs generated from the bone marrow of WT and KO mice and of splenic NK cells isolated from wild-type and Il18r1 knockout mice (Il18r1−/−). In brief, after mo-macs were fed with apoptotic KP-GFP cells for 4 hours, splenic NK cells were isolated and cultured with mo-macs at a 1:10 ratio. These cells were then stimulated with recombinant IL-18 and IL-12 with Brefeldin A for 4 hours, after which NK cells were collected for flow cytometric analysis. h) Flow cytometric quantification of CD69+ activated NK cells (left) and of Ki-67+ proliferative NK cells (right), shown as a frequency of total NK cells. The results shown are from one experiment, representative of three independent experiments. (mean ± standard error of mean (S.E.M.); unpaired two-tailed t-test at a 95% confidence interval) i) Quantification of the tumor area, as a percent of the total area of the lung cross-section, of tumor-bearing lungs of WT, isotype antibody (n = 6), KO, isotype antibody (n = 6), and KO mice that received the IL-18 neutralizing antibody (n = 8). The results shown are from two independent experiment. (mean ± standard error of mean (S.E.M.); unpaired two-tailed t-test at a 95% confidence interval) j) Flow cytometric quantification of NK cells, as a relative frequency of CD45+ immune cells (left), and of IFN-ɣ-producing NK cells, as a relative frequency among total NK cells (right). (mean ± standard error of mean (S.E.M.); unpaired two-tailed t-test at a 95% confidence interval)
Figure 5.
Figure 5.. Therapeutic inhibition of TREM2 synergizes with an NK cell stabilizing agent to promote superior NK cell immunity and tumor elimination.
a) Representative H&E images of tumor-bearing lungs of WT, isotype antibody (n = 5), KO, isotype antibody (n = 5), KO that received the TREM2 blocking antibody (αTREM2) (n = 5) (left). Quantification of the tumor area as a percent of the total area of the lung cross-section (right) is shown. (mean ± standard error of mean (S.E.M.); unpaired two-tailed t-test at a 95% confidence interval) b) Flow cytometric quantification of NK cells, as a relative frequency of CD45+ immune cells (left), and KLRG1-expressing NK cells, as a relative frequency of total NK cells (right), in the tumor-bearing lungs of WT mice and KO mice that were treated with either an isotype control or the αTREM2 antibody. (mean ± standard error of mean (S.E.M.); unpaired two-tailed t-test at a 95% confidence interval) c) Representative H&E images of tumor-bearing lungs of WT, isotype antibody (n = 5), KO, isotype antibody (n = 5), WT that received the MIC-A stabilizing antibody (αMICA) (n = 5), KO that received the αMICA (n = 6), and KO that received both αMICA and an NK cell-depleting antibody (n = 5) (left). Quantification of the tumor area as a percent of the total area of the lung cross-section from tumor-bearing lungs of these mice is shown (right). (mean ± standard error of mean (S.E.M.); unpaired two-tailed t-test at a 95% confidence interval) d) Graphical summary of the regulation of NK cells by TREM2+ mo-macs in the tumor microenvironment.

References

    1. de Andrade LF, Tay RE, Pan D, Luoma AM, Ito Y, Badrinath S, Tsoucas D, Franz B, May KF, Harvey CJ, et al. (2018). Antibody-mediated inhibition of MICA and MICB shedding promotes NK cell–driven tumor immunity. Science 359, 1537–1542. - PMC - PubMed
    1. Barry KC, Hsu J, Broz ML, Cueto FJ, Binnewies M, Combes AJ, et al. (2018). A natural killer-dendritic cell axis defines checkpoint therapy-responsive tumor microenvironments. Nat. Med. 24, 1178–91. - PMC - PubMed
    1. Binnewies M, Pollack JL, Rudolph J, Dash S, Abushawish M, Lee T, Jahchan NS, Canaday P, Lu E, Norng M, et al. (2021). Targeting TREM2 on tumor-associated macrophages enhances immunotherapy. Cell Rep. 37, 109844. - PubMed
    1. Bonacina F, Coe D, Wang G, Longhi MP, Baragetti A, Moregola A, Garlaschelli K, Uboldi P, Pellegatta F, Grigore L, et al. (2018). Myeloid apolipoprotein E controls dendritic cell antigen presentation and T cell activation. Nat. Comm. 9, 3083. - PMC - PubMed
    1. Bonnardel J, T’Jonck W, Gaublomme D, Browaeys R, Scott CL, Martens L, Vanneste B, De Prijck S, Nedospasov SA, Kremer A, et al. (2019). Stellate Cells, Hepatocytes, and Endothelial Cells Imprint the Kupffer Cell Identity on Monocytes Colonizing the Liver Macrophage Niche. Immunity 51, 638–654.e9. - PMC - PubMed

Publication types