. 2023 May;8(5):889-904.
doi: 10.1038/s41564-023-01358-2. Epub 2023 Apr 20.

A positive feedback loop controls Toxoplasma chronic differentiation

Affiliations

A positive feedback loop controls Toxoplasma chronic differentiation

M Haley Licon et al. Nat Microbiol. 2023 May.

Erratum in

Abstract

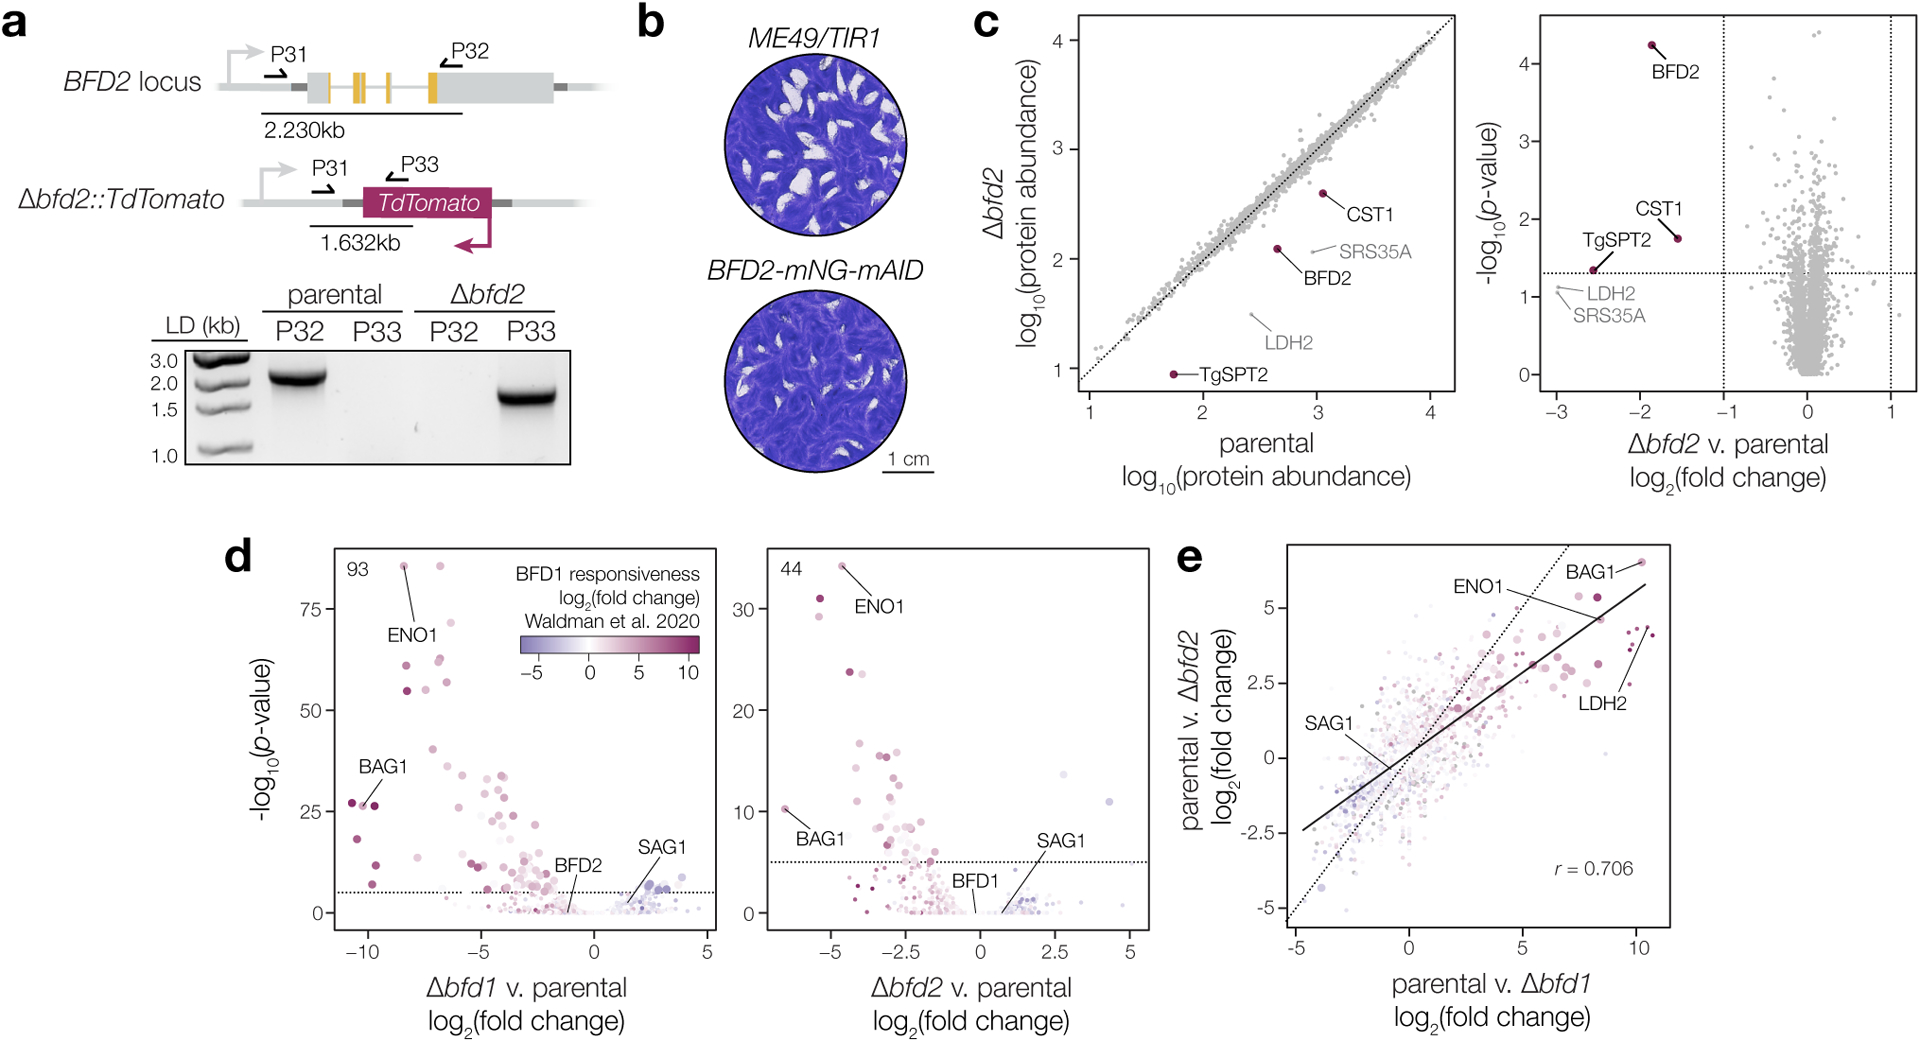
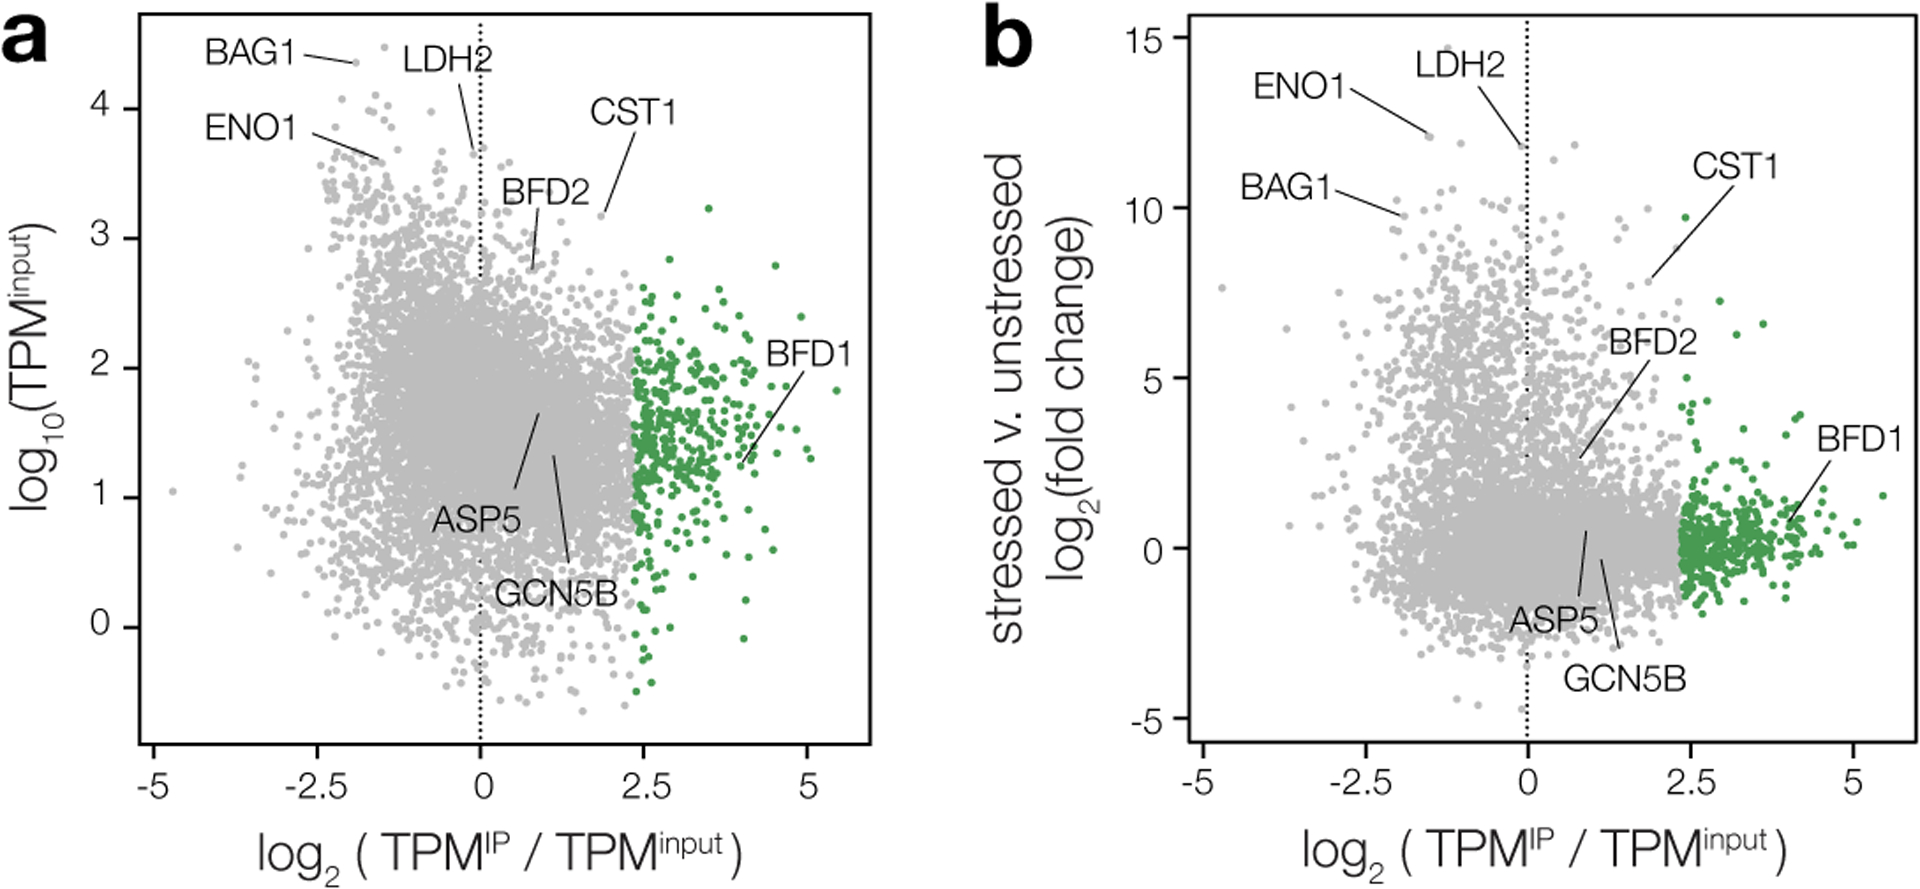
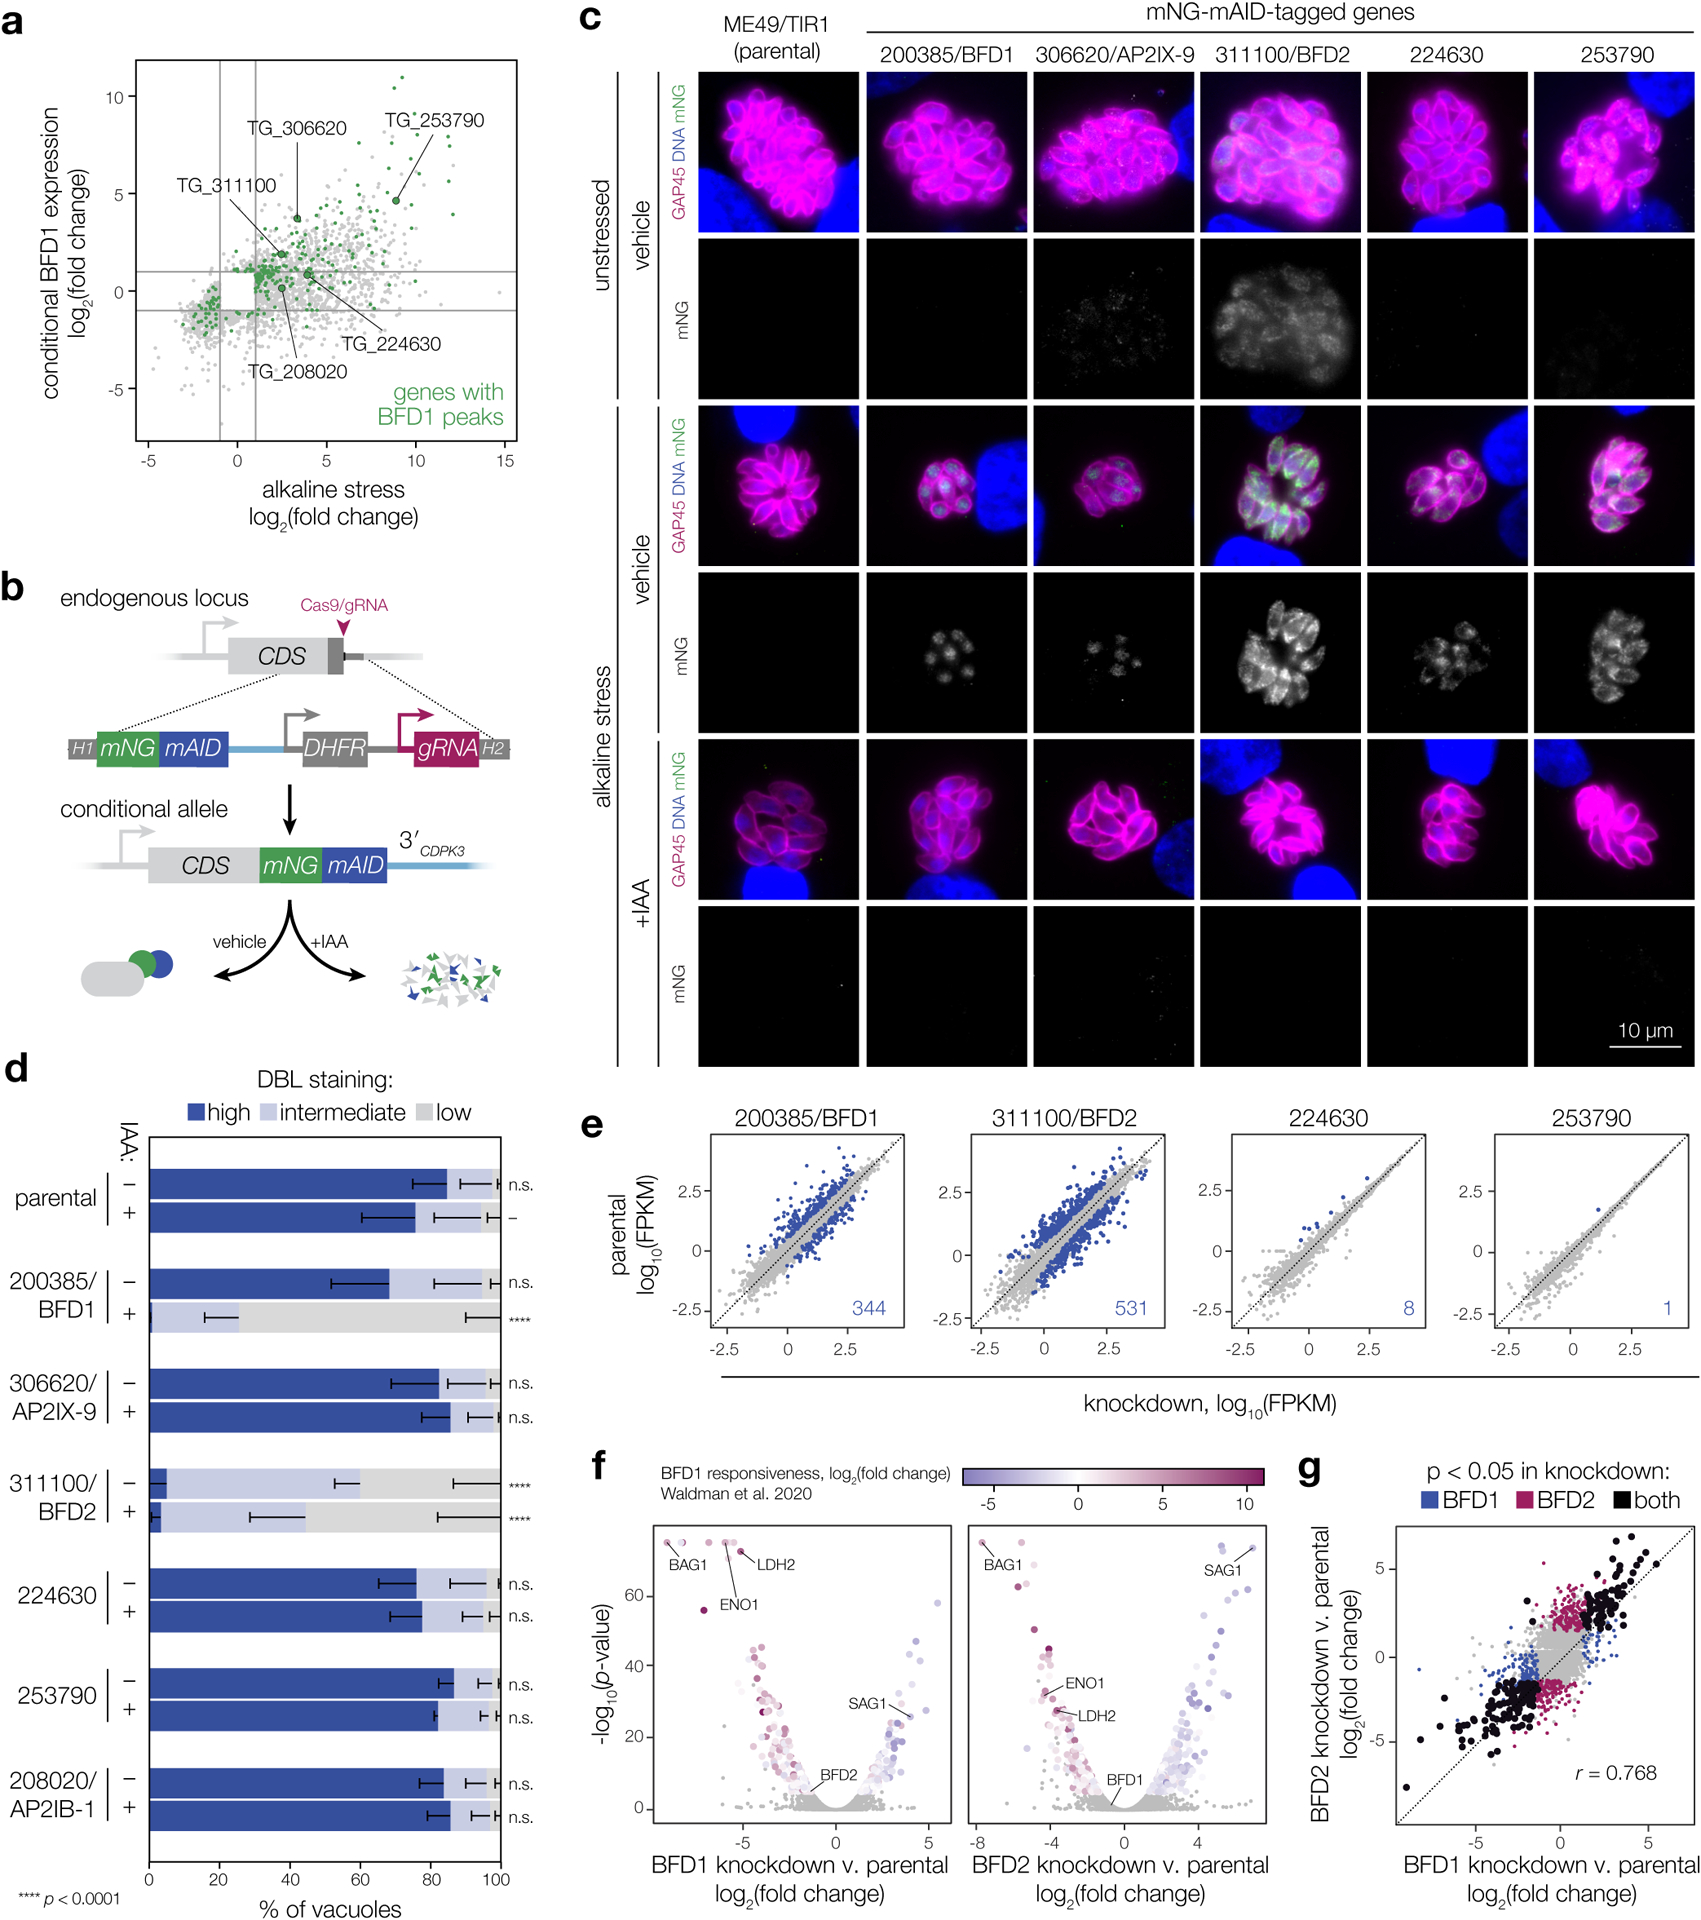
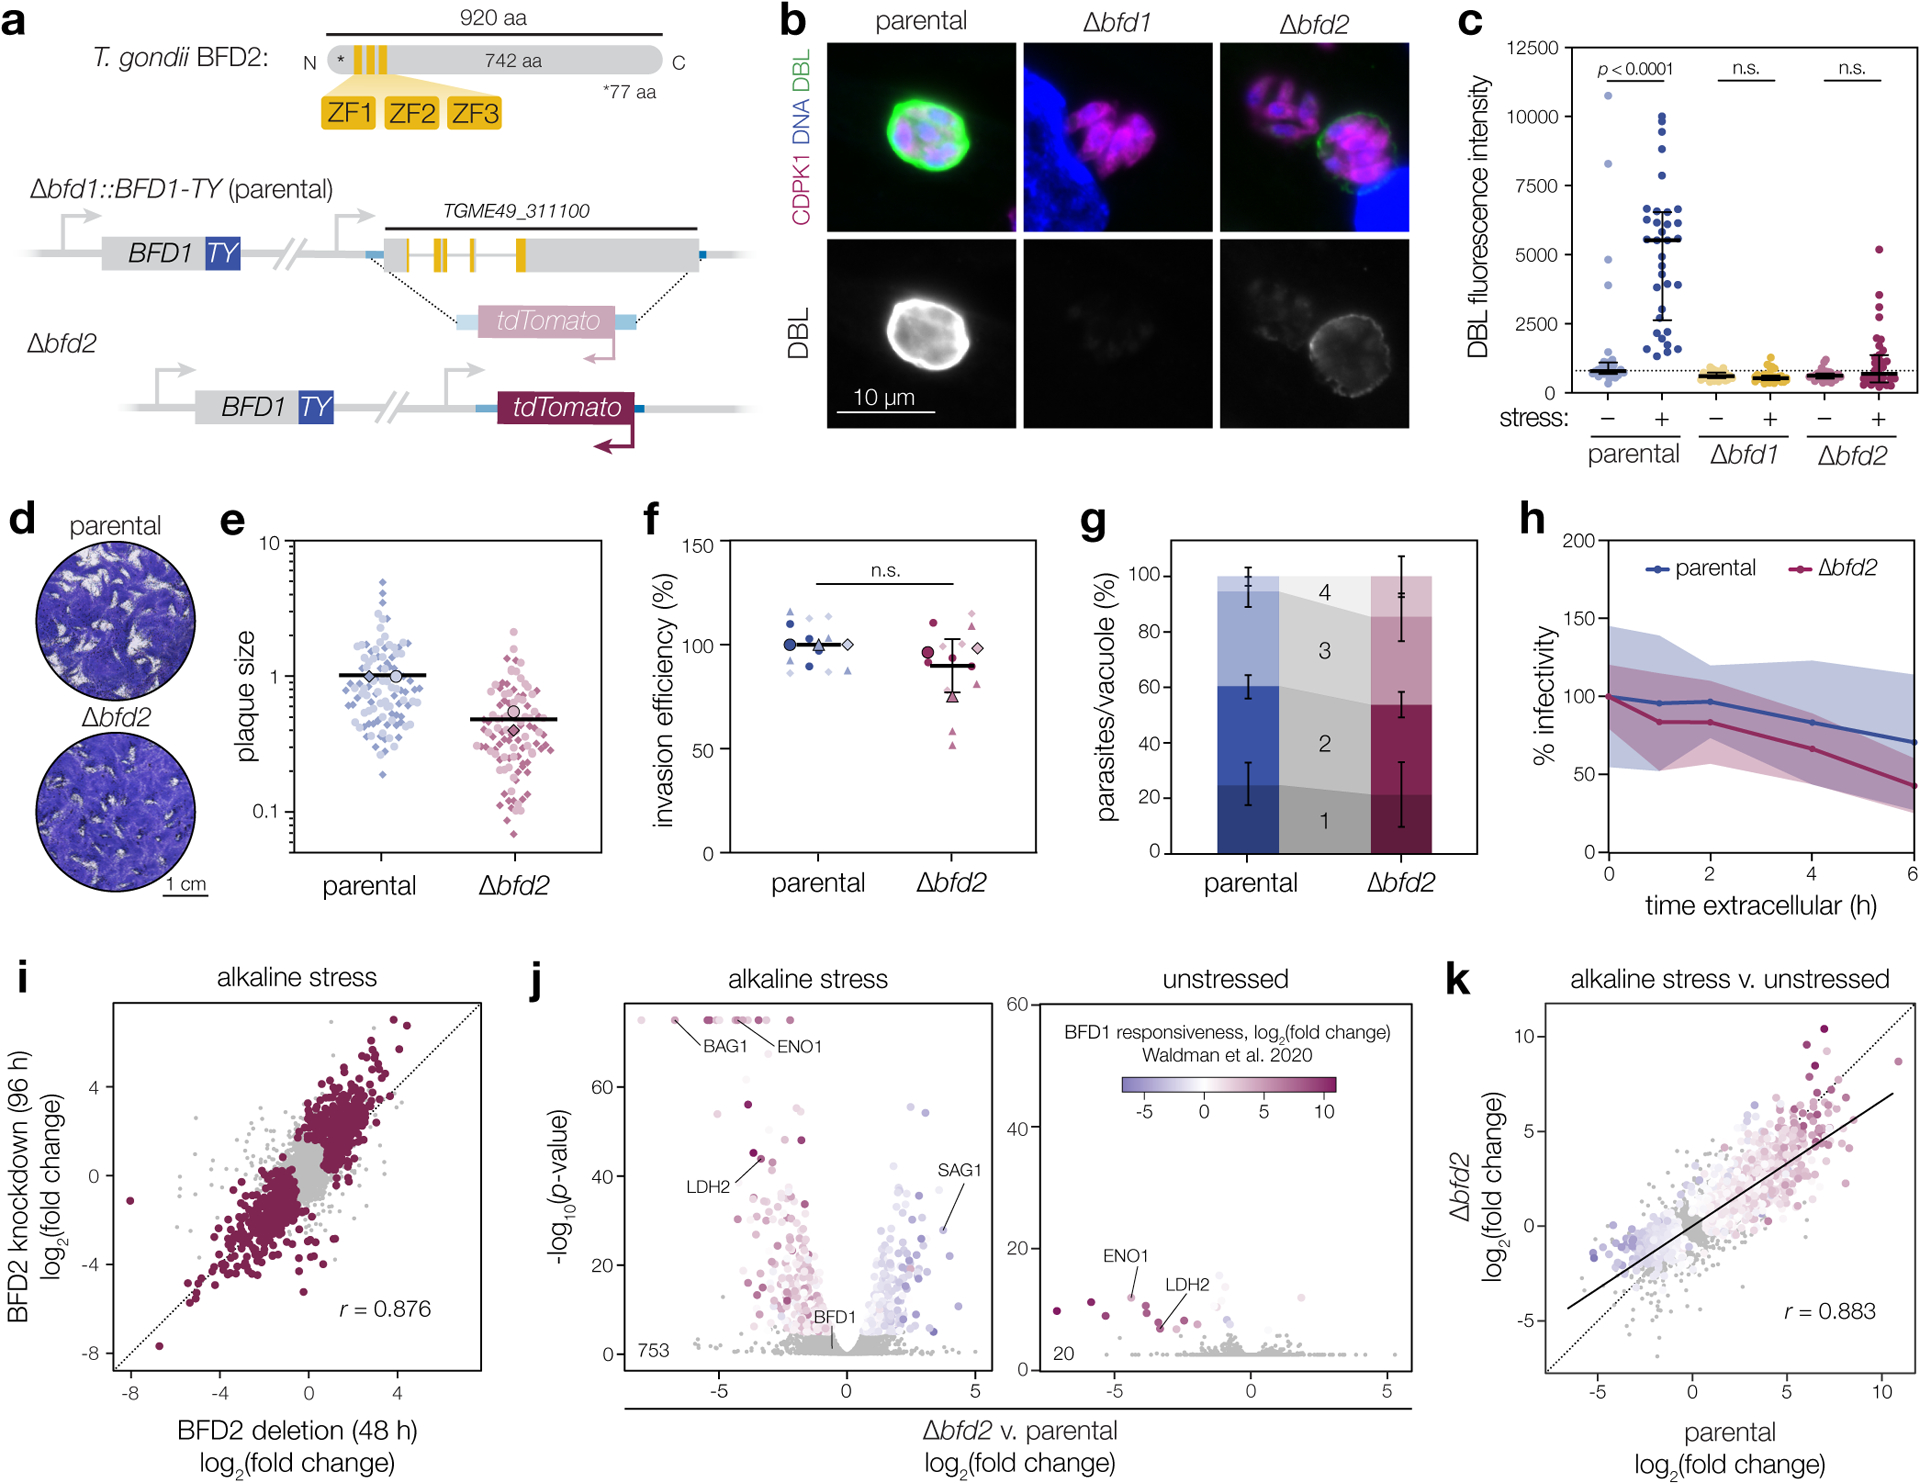
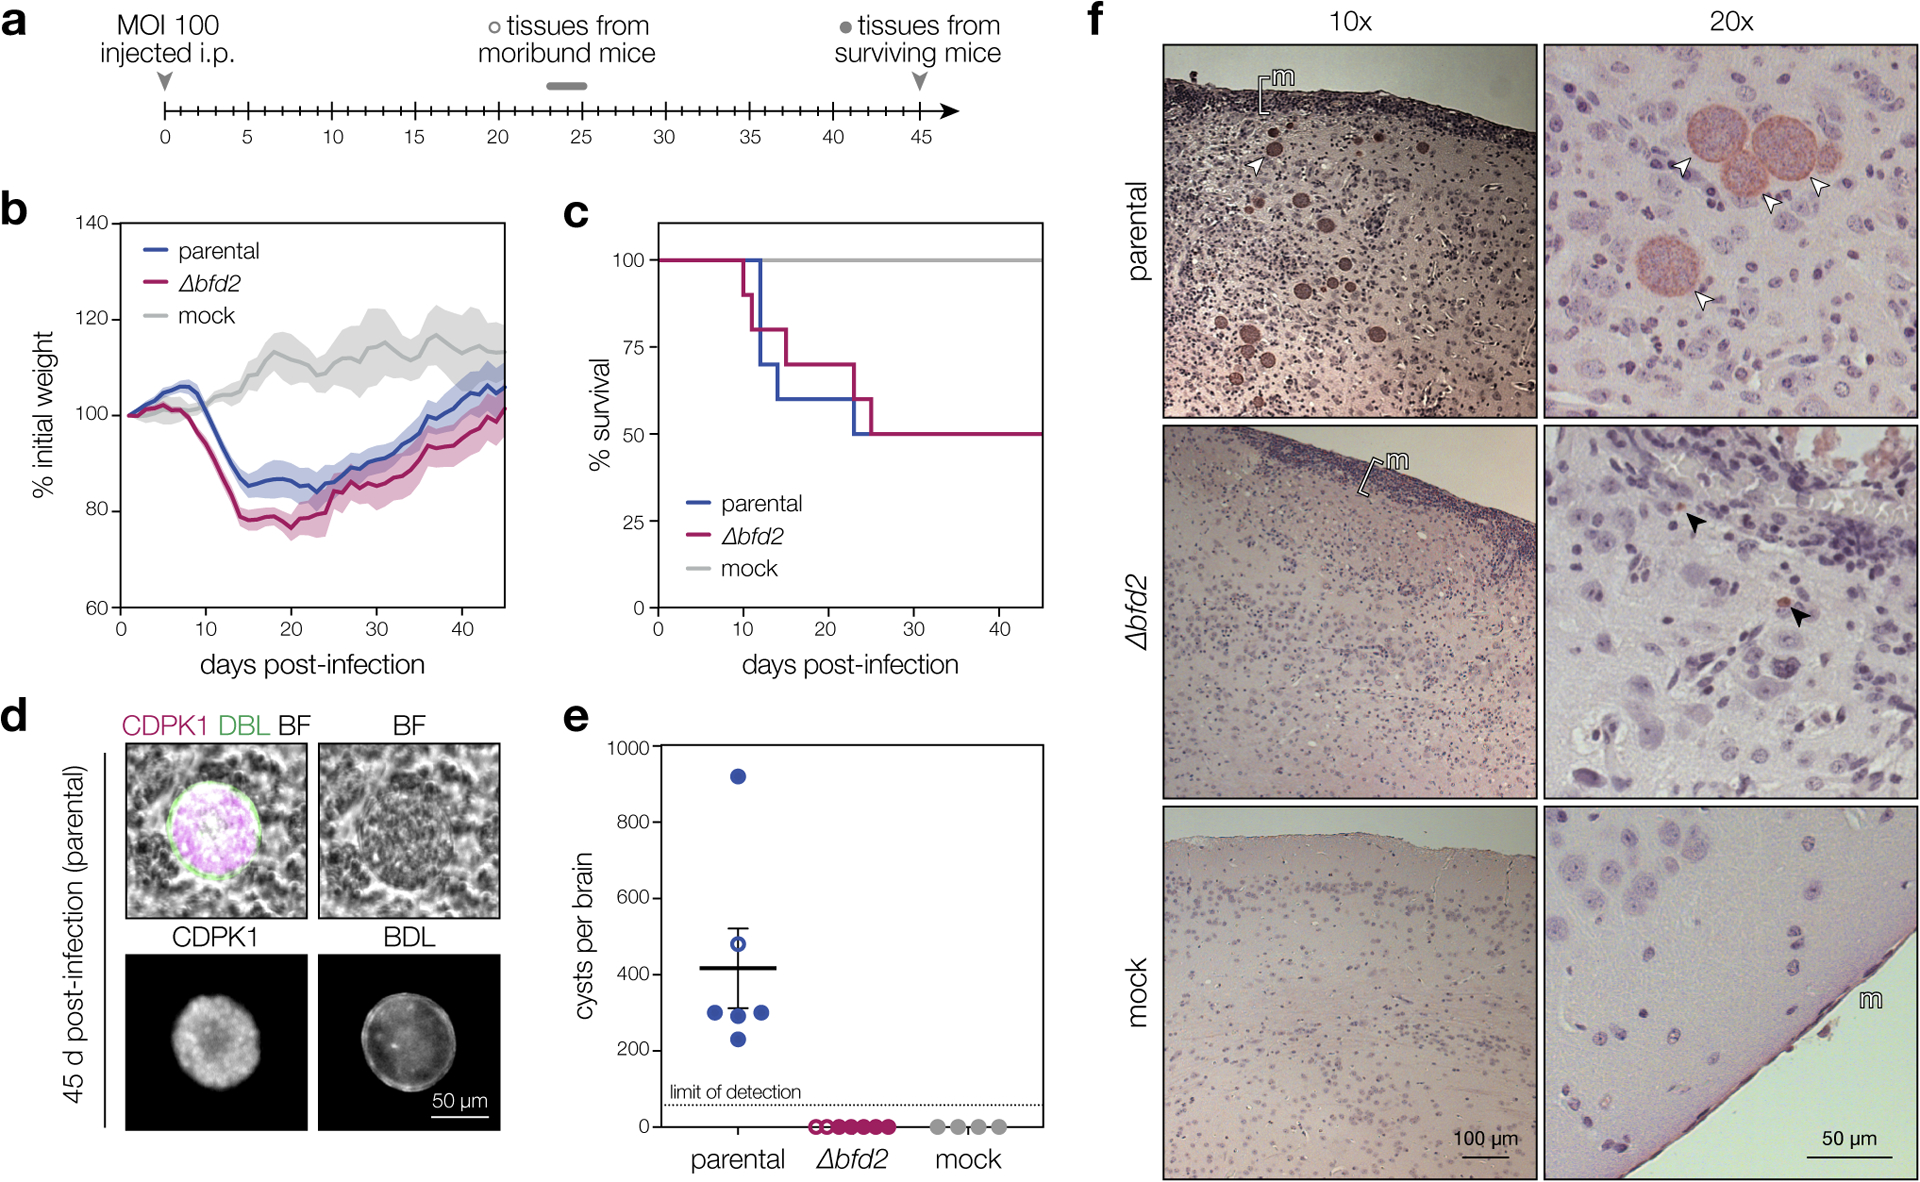
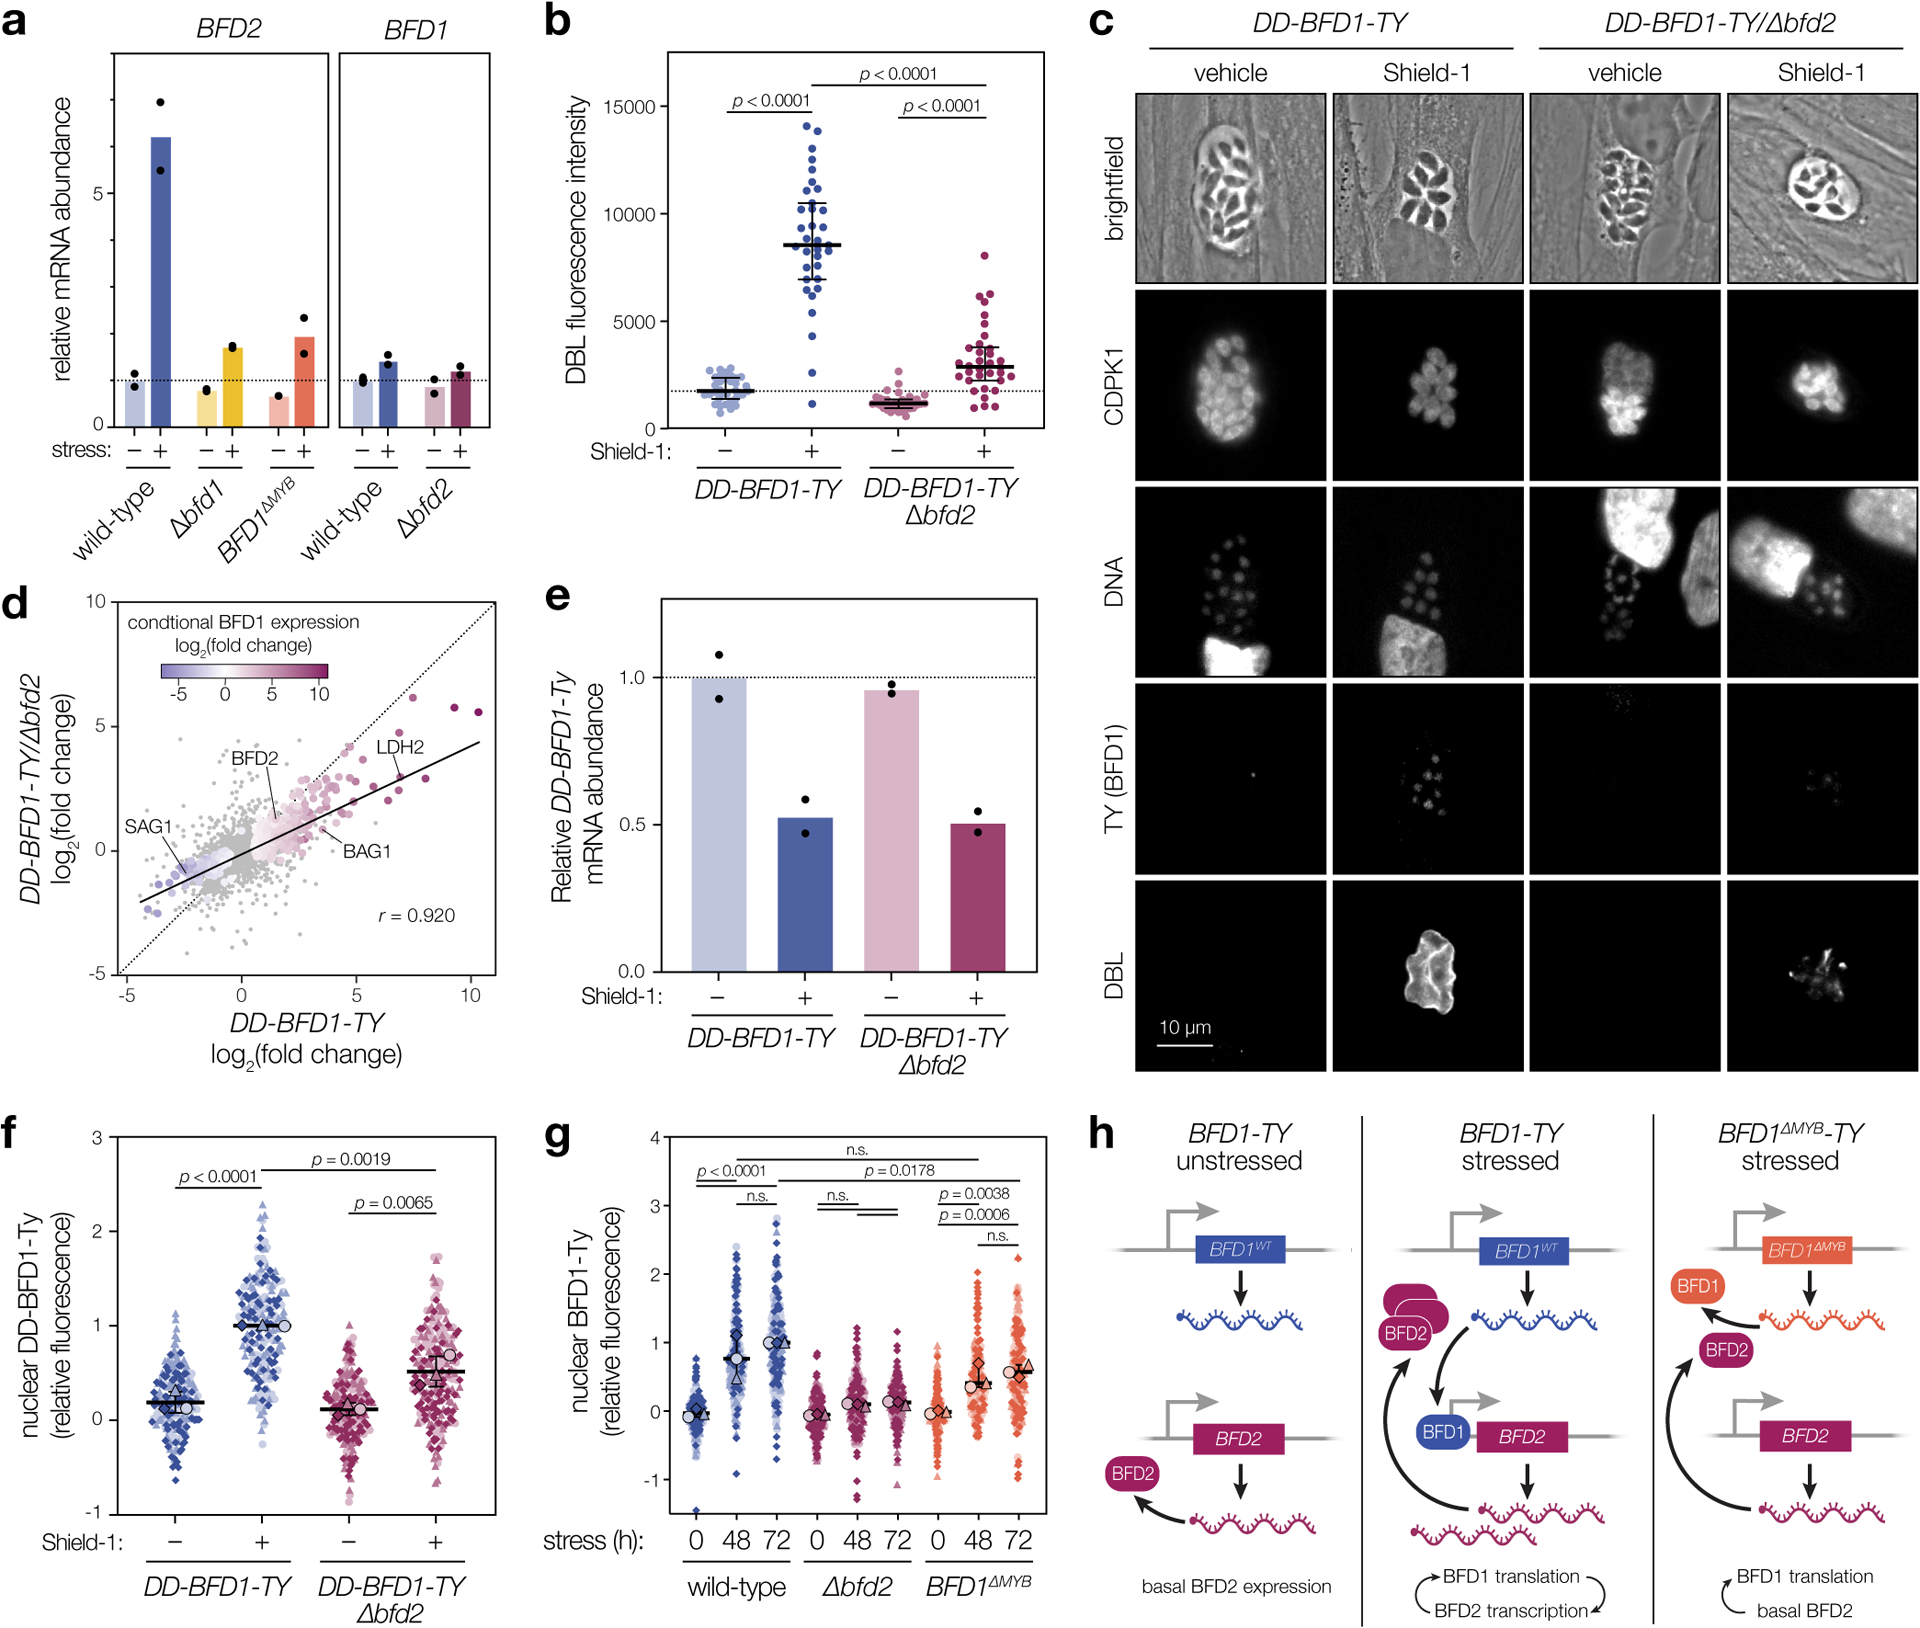
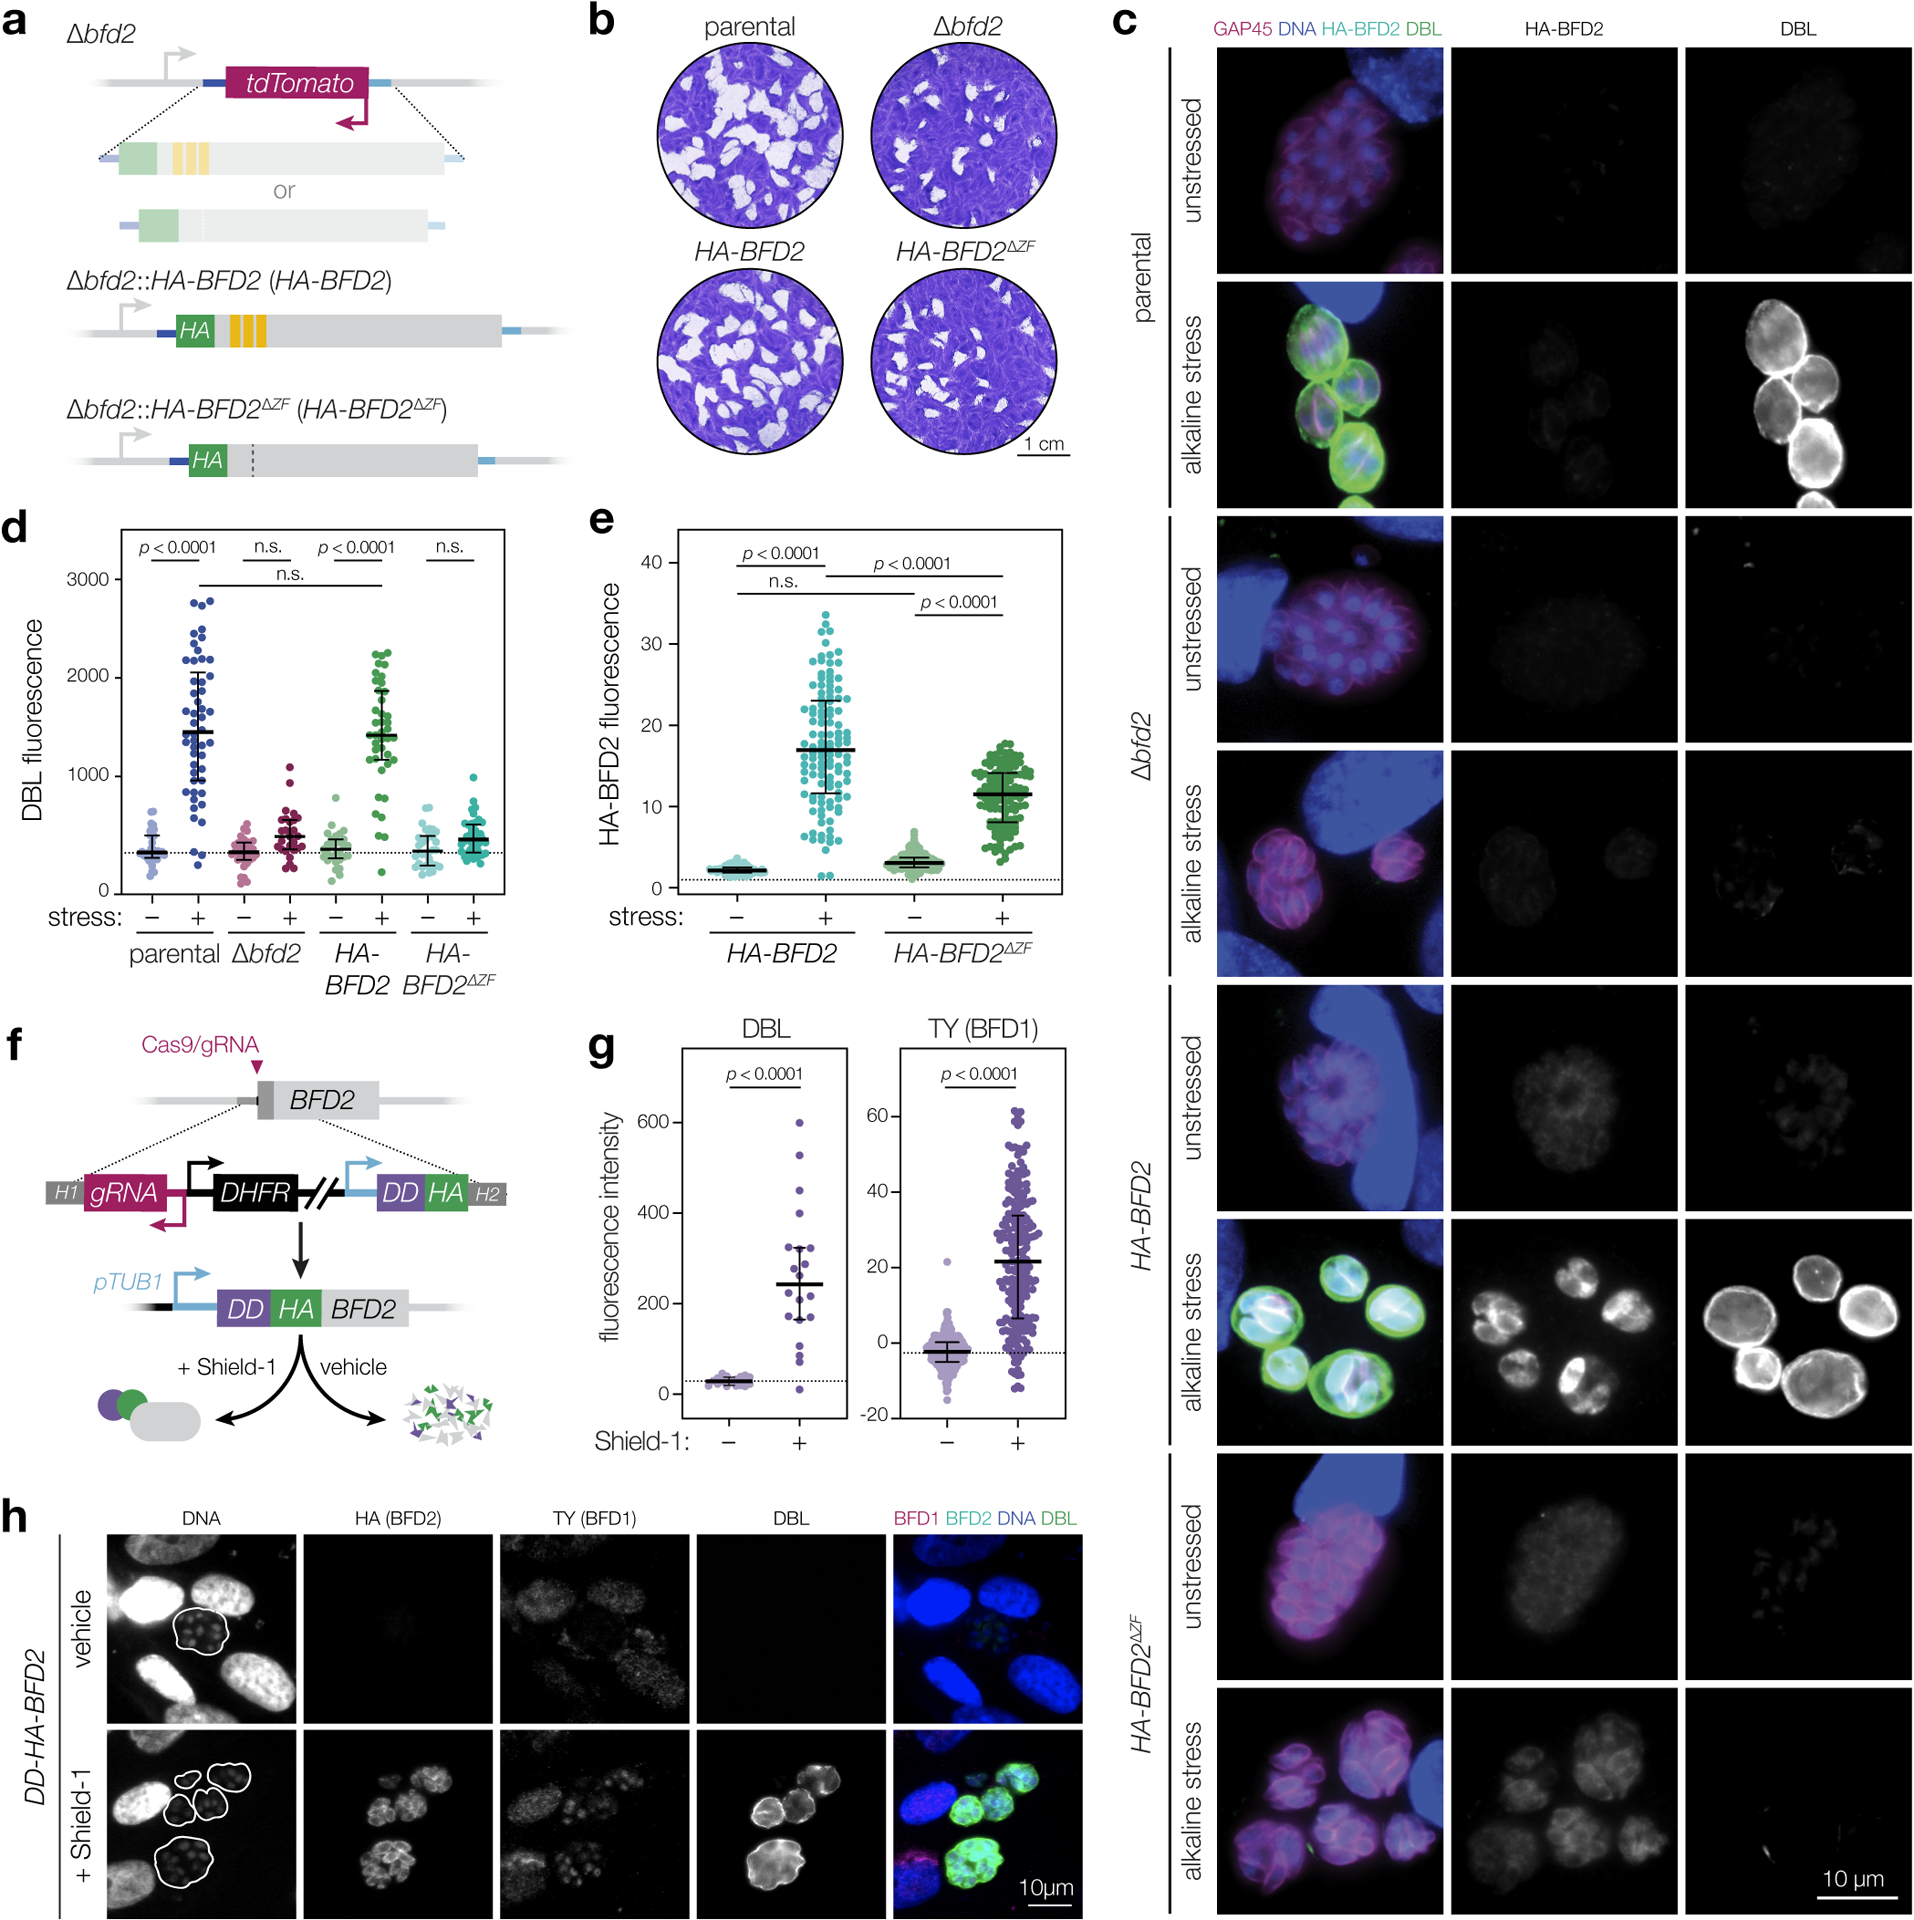
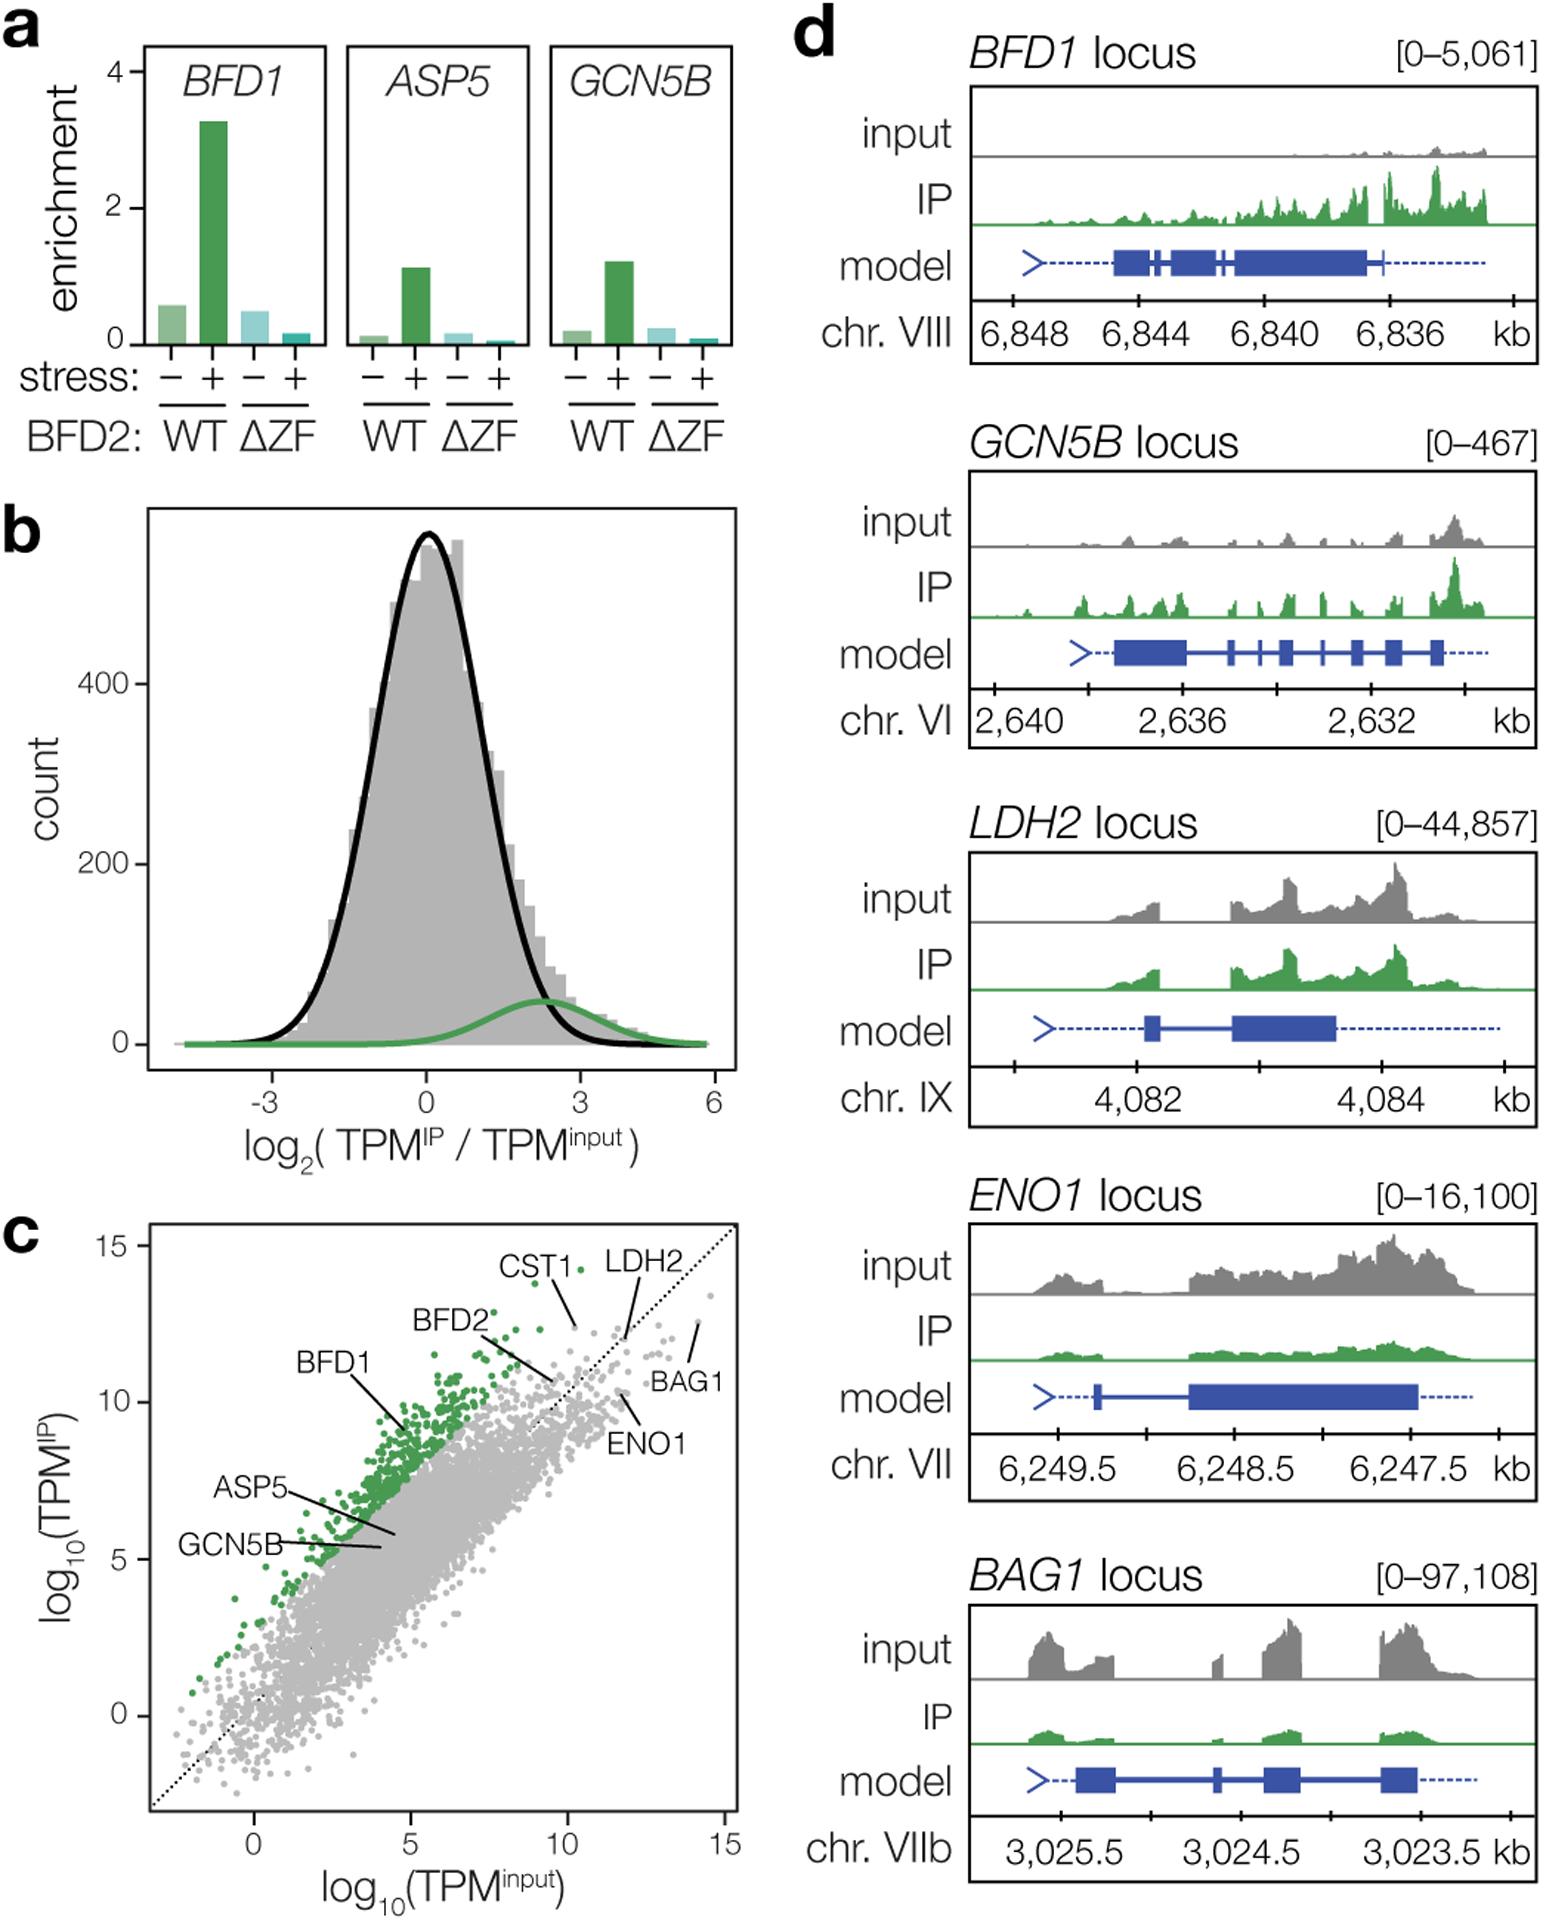
Successful infection strategies must balance pathogen amplification and persistence. In the obligate intracellular parasite Toxoplasma gondii this is accomplished through differentiation into dedicated cyst-forming chronic stages that avoid clearance by the host immune system. The transcription factor BFD1 is both necessary and sufficient for stage conversion; however, its regulation is not understood. In this study we examine five factors that are transcriptionally activated by BFD1. One of these is a cytosolic RNA-binding protein of the CCCH-type zinc-finger family, which we name bradyzoite formation deficient 2 (BFD2). Parasites lacking BFD2 fail to induce BFD1 and are consequently unable to fully differentiate in culture or in mice. BFD2 interacts with the BFD1 transcript under stress, and deletion of BFD2 reduces BFD1 protein levels but not messenger RNA abundance. The reciprocal effects on BFD2 transcription and BFD1 translation outline a positive feedback loop that enforces the chronic-stage gene-expression programme. Thus, our findings help explain how parasites both initiate and commit to chronic differentiation. This work provides new mechanistic insight into the regulation of T. gondii persistence, and can be exploited in the design of strategies to prevent and treat these key reservoirs of human infection.


Conflict of interest statement

COMPETING INTERESTS STATEMENT

The authors declare no competing interests.

Figures

Extended Data Fig. 1.
Extended Data Fig. 1.. Genotyping conditional depletion strains.
a, Clones were screened to verify integration of mNG-mAID downstream of the targeted coding sequence (CDS) and the reciprocal loss of the untagged allele. Diagram shows binding sites for primers listed in the table below, with regions used to direct construct integration (i.e., H1 & H2, Fig. 1b) in dark gray. In each case, a common gene-specific forward primer (P11–16) was paired with reverse primers against either mNG (P17) or the respective endogenous 3′ UTR (P18–23), downstream of the integration site. Expected PCR product size given for each template and primer combination. Refer to Supplementary Table 9 for a complete list of primer sequences. b, PCRs were performed on ME49/TIR1 gDNA (parental) as a control, in addition to the respective tagged strain. Lanes are labeled with the reverse primer and gDNA template used in each reaction. For positive clones, bands were extracted and subjected to Sanger sequencing to verify in-frame integration of the tag.
Extended Data Fig. 2.
Extended Data Fig. 2.. Effects of AP2IX-9 and AP2IB-1 knockdown on the chronic-stage transcriptome.
Data reflect changes in knockdown strains (relative to the parental) after 96 h in alkaline-stress medium containing IAA. Differential expression analysis was performed as in Fig. 1e, based on n = 2 biological replicates. No genes are significantly affected (adjusted p < 0.05, calculated by DESeq2) by depletion of either factor.
Extended Data Fig. 3.
Extended Data Fig. 3.. Genotyping and characterization of BFD2-deficient parasites.
a, Δbfd2 clones were screened by PCR for replacement of the endogenous coding sequence with TdTomato using a common forward primer in the BFD2 5′ UTR (P31) and reverse primers against either BFD2 (P32) or the fluorescent reporter (P33). Diagram shows priming in the parental strain (top) and at the modified allele in Δbfd2 (below), with expected product sizes indicated. Reverse primers and gDNA template used in each reaction are listed above the respective lane. b, Plaque assays after 16 days of undisturbed growth. c, Comparison of protein abundance in unstressed parental (Δbfd1::BFD1-TY) and Δbfd2 parasites. Quantitative proteomics identified a total of 29,806 unique peptides corresponding to 4,303 individual proteins. Significantly affected proteins (magenta) were defined as those meeting three criteria: (i) a minimum of two unique peptides, (ii) absolute fold-change > 2, and (iii) p-value < 0.05. Differences are limited to canonical bradyzoite markers (CST1, LDH2, and SRS35A) or other developmentally regulated genes (TgSPT2)78. d–e, Effects of BFD1 or BFD2 deletion on the parasite transcriptome during infection of mouse primary neurons. Data are based on n = 3 independent infections with color assigned based on log2(fold change) during conditional BFD1 expression. Significantly affected genes (adjusted p-value < 0.05 by Wald test with DESeq2) are indicated by larger point size. Differential expression analysis was performed for parasites lacking either factor, as compared to the parental strain. Number of genes meeting the cutoff for statistical significance is indicated (d). Comparison of the effects of BFD1- versus BFD2-deletion (e) reveals a comparatively larger impact for the former. Pearson correlation performed on all significant points with trend line fit by linear regression.
Extended Data Fig. 4.
Extended Data Fig. 4.. Re-analysis of BFD2-deficient parasites in previous ME49 screens.
a, Overview of the CRISPR-based screen that identified BFD1. A CRISPR-compatible ME49 strain was modified to express mNeonGreen (mNG) under the bradyzoite-specific BAG1 promoter (pBAG1), enabling isolation of chronic stages by fluorescence-activated cell sorting (FACS). The reporter strain was transfected with guide RNA (gRNA) libraries targeting ~200 predicted nucleic acid-binding proteins with five gRNAs per gene. After initial passages allowing for guide integration and gene disruption, transfectants were split between alkaline-stressed and unstressed (standard media) conditions. Samples were collected from each population over a 10-day period, with bradyzoites (mNG+-stressed parasites) isolated by FACS. Integrated gRNAs from all samples were enumerated by next-generation sequencing and the abundance of each guide was assessed relative to the input library. The log2(fold change) for guides targeting each gene is referred to as its fitness or differentiation score, based on representation in unstressed or bradyzoite samples, respectively. b,c. Analysis of BFD2-targeting gRNAs from the screen described in a. Four of the five guides targeting BFD2 were lost from the transfectant pool under standard conditions over the course of serial passaging (b). Subsequent sequence-level analysis revealed that the single guide that remains abundant (black) is likely non-cutting due to a mismatch in the protospacer and its intended genomic target. Among alkaline-stressed cultures (c), at both time points examined—with the exception of the non-cutting guide (black)—gRNAs targeting BFD2 are underrepresented in bradyzoite samples (mNG+) relative to the unsorted alkaline-stressed population (bulk).
Extended Data Fig. 5.
Extended Data Fig. 5.. BFD2 deletion in a conditional BFD1 strain.
a, Schematic of ligand-inducible BFD1. The DD-BFD1-TY strain was constructed previously, by integration at the HXGPRT locus in the Δbfd1 genetic background. A heterologous promoter (pTUB1) drives expression of the transgene, but DD-BFD1-TY protein is only stabilized upon treatment with Shield-1. b, Validation of BFD2-knockout in DD-BFD1-TY. Selected clones with screened using the same strategy described in Extended Data Fig. 3, verifying both loss of endogenous BFD2 and replacement with the fluorescence cassette. Gel shows PCRs performed on gDNA from both the parental (DD-BFD1-TY) and DD-BFD1-TYΔbfd2 strains. Reverse primers used are listed over the respective well, with expected product sizes indicated in the diagram above.
Extended Data Fig. 6.
Extended Data Fig. 6.. Genotyping BFD2-complemented and conditional overexpression strains.
a, Complementation with wild-type (HA-BFD2) or non-RNA-binding (HA-BFD2ΔZF) BFD2 was verified by PCR using the same primers as in Extended Data Fig. 3, screening for reintroduction of the coding sequence and reciprocal loss of TdTomato at the endogenous BFD2 locus. Diagram shows PCR priming in Δbfd2 (top) versus the complemented loci (below), with expected product sizes indicated. Reverse primers and gDNA template used in each reaction are listed above the respective lane. b, For conditional BFD2 expression, pTUB1-DD-HA was integrated at the endogenous BFD2 locus (P51/P32), resulting in coincident loss of the untagged allele (P50/P32). As in a, diagram shows the relative positions of primer binding with expected product sizes, and lanes are labeled above with the gDNA template and forward primer used.
Extended Data Fig. 7.
Extended Data Fig. 7.. Neither mRNA abundance nor differential expression are predictive of interaction with BFD2.
Comparison of log-transformed enrichment ratios (TPMIP/TPMinput) for all transcripts detected in stressed HA-BFD2 parasites and either abundance in the unenriched input (a) or change in expression after 48 h of stress, based on a previously published dataset (b). The 375 most highly enriched genes identified by Gaussian mixture modeling are highlighted in green.
Extended Data Fig. 8.
Extended Data Fig. 8.. Strain construction using the HiT vector strategy.
a, Schematic of C-terminal tagging HiT vectors (top), as described previously79. Targeted integration of BsaI-linearized constructs (bottom) is facilitated by a guide RNA (gRNA) specific to the 3′ end of the coding sequence and 40 bp homology regions (H1, H2), both encoded in the gene-specific cutting unit. Transcription of the gRNA is driven by a type III promoter (pU6). A heterologous 3′ untranslated region (3′CDPK3) allows expression of the gene product. DHFR denotes a pyrimethamine resistance cassette to enable mutant selection. b, N-terminal HiT vector configuration for generation of conditional overexpression strains. Construct integration endogenously tags the targeted gene with the Shield-1-stabilized degradation domain (DD) and replaces the native promoter with that of alpha tubulin (pTUB1). Cutting units are designed similarly to those in a, with a gRNA that targets the coding sequence 5′ end encoded in reverse orientation. For the inducible BFD2 strain in particular, HA was also designed into the cutting unit to enable detection of the protein by the same epitope used for examination of endogenously regulated BFD2.
Figure 1.
Figure 1.. Screening for downstream effectors of BFD1.
a, Comparison of genes significantly regulated after 48 h under alkaline stress or conditional BFD1 expression (≥2-fold; adjusted p < 0.001, Wald test in DESeq2). BFD1 targets identified by CUT&RUN chromatin profiling are in green, with the five genes encoding predicted nucleic acid-binding domains indicated. b, Generation of conditional knockdown strains. Tagging with mNG-mAID targets proteins for degradation upon IAA treatment. Additional strain construction details are provided in Extended Data Fig. 8. c, Knockdown strains after 48 h under alkaline-stressed or unstressed conditions, treated with IAA or vehicle. Parasites are labeled by GAP45 (magenta), DNA with Hoechst (blue), and tagged genes by immunostaining for mNG (green). For clarity, mNG signal is shown below the corresponding merged image. Assay was performed twice with similar results. d, Differentiation of knockdown strains after 48 h of alkaline stress, assessed by cyst wall staining (DBL). Mean ± s.d. plotted for n = 3 biological replicates, with a minimum of 175 vacuoles counted per sample. ****p < 0.0001, One-way ANOVA with Dunnett’s correction performed on % DBL-high vacuoles. e–g, Effects of candidate knockdown on the chronic-stage transcriptome. Data reflect changes after 96 h of alkaline stress in the presence of IAA for n = 2 independent infections. Genes significantly affected by depletion of each factor (adjusted p-value < 0.05, Wald test in DESeq2) are highlighted and quantified in the respective plot (e). Complete lists of affected genes are provided in Supplementary Table 1. For BFD1- and BFD2- knockdown strains (f), significantly affected genes are colored by log2(fold change) during conditional BFD1 expression. A comparison of the transcriptional effects of BFD1 versus BFD2 depletion is shown (g), highlighting genes meeting the significance threshold in both (black) or either sample independently (blue and magenta). Pearson correlation was performed on the union of statistically regulated points.
Figure 2.
Figure 2.. BFD2 is a CCCH-type zinc finger protein required for differentiation.
a, BFD2 with zinc finger domains indicated (top). A fluorescence cassette was integrated in place of BFD2 in the Δbfd1::BFD1-TY background (bottom). b, Representative vacuoles after 48 h of alkaline stress. Parasites are labeled by CDPK1 (magenta), DNA with Hoechst (blue), and differentiated vacuoles with DBL (green and below the corresponding merged image). Assay was performed three times with similar results. c, DBL staining intensity after 48 h under unstressed or alkaline-stressed conditions. Median ± IQR plotted for n = 34 vacuoles. n.s., p > 0.05 by One-way ANOVA with Tukey’s correction. d, Plaque assays after 16 days of growth. e, Plaque sizes were quantified for n = 2 independent infections, with replicate means (large points) calculated from at least 50 plaques (small points) and normalized to the parental mean. f, Invasion assay. Mean ± s.d. plotted for n = 3 infections in technical quadruplicate, normalized to the parental mean. n.s., p > 0.05 by Student’s two-tailed t-test. g, Parasites per vacuole after 24 hr of growth. Mean ± s.d. plotted for n = 3 biological replicates, with a minimum of 100 vacuoles counted per sample. p > 0.05 for all bins by Student’s two-tailed t-test. h, Parasite infectivity over extended extracellular stress. Mean ± s.d. for n = 5 fields counted from one infection series, normalized to infectivity at t = 0. i–k, Effects of BFD2 deletion. Data reflect n = 3 independent infections with significantly affected genes highlighted (adjusted p-value < 0.05, Wald test in DESeq2). Comparison of changes in Δbfd2 versus BFD2-mNG-mAID parasites after 48 and 96 h, respectively, under stress (i). Pearson correlation performed on the union of significant genes in both samples. Differential expression analysis (j) of parental versus Δbfd2 parasites after 48 h under alkaline-stressed and unstressed conditions. Significant points colored by log2(fold change) during conditional BFD1 expression. Comparison of the effects of alkaline stress on parental versus Δbfd2 parasites (k). Trend line fit by linear regression and Pearson correlation performed on all significant points, colored as in j.
Figure 3.
Figure 3.. Parasites lacking BFD2 fail to generate brain cysts in mice.
a, Timeline of mouse infections. CD-1 female mice were infected i.p. with 100 tachyzoites from each strain (n = 10) or buffer alone (n = 4). Cyst burdens were assessed in all moribund animals at the time of euthanasia and in surviving animals 45 days post-infection. b–c, Normalized weights (b) and survival (c) of animals in each infection group. Mean weight ± s.e.m. plotted for all surviving animals at a given time point. d, Representative cyst produced by the parental strain. The cyst wall is stained with DBL (green) and individual parasites are stained with CDPK1 (magenta). All structures scored as cysts in e were double-positive for DBL and CDPK1. e, Cyst burden per infected brain. Graphs reflect counts from surviving animals (closed circles) as well as all moribund animals sacrificed after 23 days of infection (open circles). Mean ± s.e.m. plotted for all cyst counts from parental-, Δbfd2-, and mock-infected animals (n = 6, 7, and 4, respectively) regardless of status at the time of brain harvest. f, Histology of brain sections from infected and mock-infected animals. Representative images at 10x and 20x magnification are shown for each strain. The meninges (m) are shown, with regions of inflammation highlighted with brackets. Cysts and individual parasites are indicated with white and black arrows, respectively. Samples were prepared from all surviving mice (closed circles in e) and selected images are representative of phenotypes observed throughout each infection cohort.
Figure 4.
Figure 4.. BFD1 and BFD2 comprise a positive-feedback loop.
a, RT-qPCR of BFD1 and BFD2 mRNA after 48 h under alkaline-stressed or unstressed conditions. Wild-type and BFD1ΔMYB refer to the version of BFD1 expressed. Mean transcript abundance (n = 2 biological replicates) plotted relative to GCN5B, with normalization to the unstressed wild-type sample. See Supplementary Table 4 for CT values and analysis. b, DBL staining intensity after 48 h in Shield-1 or vehicle. Data quantified for a single replicate representative of assays performed in biological triplicate. Median ± IQR plotted for n = 34 vacuoles per condition. c, Representative vacuoles after 48 h in Shield-1 or vehicle. Parasites are labeled with CDPK1, DNA with Hoechst, BFD1 via the TY epitope, and differentiated vacuoles with DBL. d, Comparison of transcriptional changes in DD-BFD1-TY versus DD-BFD1-TYΔbfd2 parasites after 48 h of Shield-1 or vehicle treatment. Genes significantly affected in either sample (adjusted p < 0.05, Wald test in DESeq2) are colored by fold change during conditional BFD1 expression. Pearson correlation performed on all significant points with trend line fit by linear regression. e, RT-qPCR of DD-BFD1-TY transcripts after 72 h in Shield-1 or vehicle. Relative quantification performed as in a, with normalization to vehicle-treated DD-BFD1-TY samples. Mean plotted for n = 2 independent infections. See Supplementary Table 5 for analysis. f, Quantification of BFD1 staining in c. Data are normalized to the mean of Shield-1-treated DD-BFD1-TY samples. Mean ± s.d. plotted for n = 3 infections, with replicate means (large points) generated from at least 59 parasite nuclei (small points) per strain. g, Quantification of BFD1 staining under alkaline-stressed or unstressed conditions. Mean ± s.d. plotted for n = 3 infections, with replicate data normalized to the 72 h-stressed wild-type mean. h, Model of BFD1-BFD2 feedback. In acute stages (left), BFD2 is basally expressed; BFD1 is transcribed but not translated. Under stress (center), BFD2 promotes BFD1 translation which, in turn, enhances BFD2 transcription. If BFD1 is nonfunctional (right), transcriptional activation of BFD2 does not occur, so BFD1 is not maximally induced. In b,f,g: n.s., p > 0.05; One-way ANOVA with Tukey’s correction.
Figure 5.
Figure 5.. BFD2 overexpression induces chronic differentiation.
a, An HA-tagged cDNA copy of either wild-type (HA-BFD2) or non-RNA-binding (HA-BFD2ΔZF) BFD2 was integrated back into the endogenous locus for Δbfd2 complementation. b, Plaque assays after 15 days of growth. Parental refers to the Δbfd1::BFD1-TY strain used to construct Δbfd2. c–e, Immunofluorescence analysis after 48 h under alkaline-stressed or unstressed conditions. In representative images (c), parasites are labeled with GAP45 (magenta), DNA with Hoechst (blue), BFD2 via the HA epitope (cyan), and differentiated vacuoles with DBL (green). For clarity, HA-BFD2 and DBL channels are shown separately in grey scale. Quantification of DBL and HA-BFD2 staining are plotted in d and e, respectively. From left to right, data reflect the median ± IQR of measurements taken from n = 36, 50, 32, 27, 29, 41, 32, and 42 vacuoles (d) and n = 101, 114, 156, and 126 individual parasites (e) per sample. DBL signal is normalized to the unstressed parental strain. HA-BFD2 is normalized to background measured from an untagged control (dashed horizontal line). n.s., p > 0.05, One-way ANOVA with Tukey’s correction. f, Generation of a conditional BFD2 overexpression strain. The alpha tubulin promoter (pTUB1) drives transgene expression while an N-terminal destabilization domain (DD) enables regulatable induction of the gene product. Accumulated BFD2 is detected by the HA epitope. See Extended Data Fig. 8 for additional strain construction details. g, Analysis of DBL staining and BFD1 protein accumulation in DD-HA-BFD2 parasites grown for 48 h under Shield-1 or vehicle treatment. Median ± IQR plotted for n = 17 and 20 vacuoles (DBL), and n = 236 and 216 individual nuclei (BFD1), in vehicle- and Shield-1–treated samples, respectively. n.s., p > 0.05, Student’s two-tailed t-test. h, Representative vacuoles corresponding to the data plotted in g. DNA is stained with Hoechst (blue), BFD2 via the HA epitope (cyan), BFD1 by TY (magenta) and differentiated vacuoles with DBL (green). Vacuole boundaries are overlaid on the DNA channel.
Figure 6.
Figure 6.. BFD2 binds a cohort of transcripts during differentiation that includes BFD1.
a, RT-qPCR analysis of BFD2-bound mRNAs after 72 h under alkaline-stressed or unstressed conditions. Pull-downs of HA-BFD2 and HA-BFD2ΔZF were performed using antibodies specific to the HA epitope, and enrichment of the indicated transcripts in IP versus input samples was assessed by the ercent Input method. For ΔCT values and analysis, refer to Supplementary Table 6. b, Log-transformed enrichment ratios for all transcripts detected in alkaline-stressed HA-BFD2 parasites. Using mixture modeling, the data were fitted with a combination of two Gaussian curves, one which corresponds to a broad range of non- or moderately interacting RNAs (black line), and one representing our conservative cutoff for enrichment (green). c, Relative abundance of mRNAs following immunoprecipitation of HA-BFD2, as compared to the input transcriptome. Enrichment was defined based on the log of the odds (LOD) ratio between the Gaussian functions plotted in b. Transcripts with a LOD > 0 (that is, having a greater likelihood of falling within the upper distribution) were considered highly enriched (green). Grey points represent all other RNAs not meeting this statistical cutoff. d, Representative transcripts reflecting varying degrees of enrichment following HA-BFD2 immunoprecipitation. Profiles display the total read count at each nucleotide position in either input (gray) or IP-enriched (green) samples, with paired tracks plotted on the same scale (denoted in brackets) for a given gene.

References

    1. Cressler CE, McLEOD DV, Rozins C, VAN DEN Hoogen J & Day T The adaptive evolution of virulence: a review of theoretical predictions and empirical tests. Parasitology 143, 915–930 (2016). - PMC - PubMed
    1. Barrett MP, Kyle DE, Sibley LD, Radke JB & Tarleton RL Protozoan persister-like cells and drug treatment failure. Nat. Rev. Microbiol 17, 607–620 (2019). - PMC - PubMed
    1. Montoya JG & Liesenfeld O Toxoplasmosis. Lancet 363, 1965–1976 (2004). - PubMed
    1. Dubey JP, Lindsay DS & Speer CA Structures of Toxoplasma gondii tachyzoites, bradyzoites, and sporozoites and biology and development of tissue cysts. Clin. Microbiol. Rev 11, 267–299 (1998). - PMC - PubMed
    1. Grant IH, Gold JW, Rosenblum M, Niedzwiecki D & Armstrong D Toxoplasma gondii serology in HIV-infected patients: the development of central nervous system toxoplasmosis in AIDS. AIDS 4, 519–521 (1990). - PubMed

Publication types

Substances