. 2023 May;55(5):777-786.
doi: 10.1038/s41588-023-01371-5. Epub 2023 Apr 20.

Genetics of myocardial interstitial fibrosis in the human heart and association with disease

Affiliations

Genetics of myocardial interstitial fibrosis in the human heart and association with disease

Victor Nauffal et al. Nat Genet. 2023 May.

Abstract

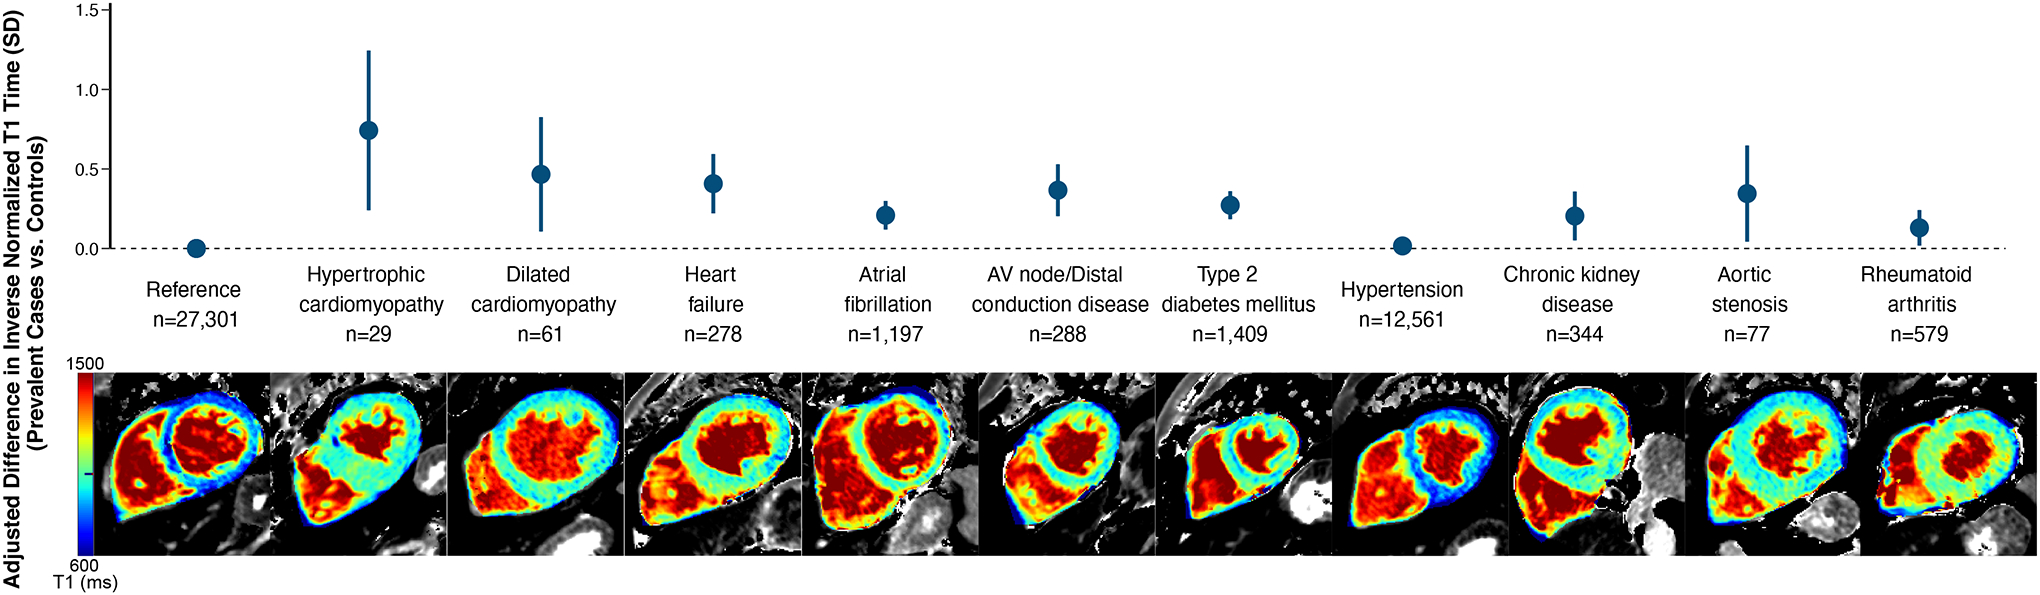
Myocardial interstitial fibrosis is associated with cardiovascular disease and adverse prognosis. Here, to investigate the biological pathways that underlie fibrosis in the human heart, we developed a machine learning model to measure native myocardial T1 time, a marker of myocardial fibrosis, in 41,505 UK Biobank participants who underwent cardiac magnetic resonance imaging. Greater T1 time was associated with diabetes mellitus, renal disease, aortic stenosis, cardiomyopathy, heart failure, atrial fibrillation, conduction disease and rheumatoid arthritis. Genome-wide association analysis identified 11 independent loci associated with T1 time. The identified loci implicated genes involved in glucose transport (SLC2A12), iron homeostasis (HFE, TMPRSS6), tissue repair (ADAMTSL1, VEGFC), oxidative stress (SOD2), cardiac hypertrophy (MYH7B) and calcium signaling (CAMK2D). Using a transforming growth factor β1-mediated cardiac fibroblast activation assay, we found that 9 of the 11 loci consisted of genes that exhibited temporal changes in expression or open chromatin conformation supporting their biological relevance to myofibroblast cell state acquisition. By harnessing machine learning to perform large-scale quantification of myocardial interstitial fibrosis using cardiac imaging, we validate associations between cardiac fibrosis and disease, and identify new biologically relevant pathways underlying fibrosis.


Conflict of interest statement

M.D.R.K., P.D.A, S.F.F. and P.B. are supported by grants from Bayer AG and IBM applying machine learning in cardiovascular disease. P.B. serves as a consultant for Novartis and Prometheus Biosciences. P.B. is employed by Flagship Pioneering as of January 4, 2023. C.R. is supported by a grant from Bayer AG to the Broad Institute focused on the development of therapeutics for cardiovascular disease. S.A.L. is employed at Novartis Institutes for Biomedical Research as of July 18, 2022. S.A.L. received sponsored research support from Bristol Myers Squibb / Pfizer, Bayer AG, Boehringer Ingelheim, Fitbit, and IBM, and has consulted for Bristol Myers Squibb / Pfizer, Bayer AG, Blackstone Life Sciences, and Invitae previously. P.T.E. receives sponsored research support from Bayer AG, Novartis, Myokardia and Quest. L.-C.W. receives sponsored research support from IBM to the Broad Institute. The remaining authors have no disclosures.

Figures

Figure 1 |
Figure 1 |. Overview of the automated pipeline for native myocardial T1 time measurement at the interventricular septum using machine learning.
A representative healthy heart and one with increased interstitial fibrosis are shown for illustration. Cardiac T1 mapping using the Shortened Modified Look-Locker Inversion (shMOLLI) recovery sequence was performed at the mid-ventricular short-axis. A machine-learning model trained on the raw MRI T1 maps generated automated segmentation of the interventricular segment (solid yellow contour) followed by selection of representative myocardial regions of interest (dashed yellow contour) using morphological operations. T1 map color legends were then used to transform pixel intensities within the region of interest into T1 times. For each participant, the median T1 time by ROI was calculated and used as the representative T1 time. MRI, magnetic resonance imaging; ROI, region of interest; SAX, short-axis; shMOLLI, Shortened Modified Look-Locker Inversion. The heart schematics were drawn by using pictures from Servier Medical Art, which were further modified. Servier Medical Art by Servier is licensed under a Creative Commons Attribution 3.0 Unported License (https://creativecommons.org/licenses/by/3.0/). T1 maps shown are reproduced by kind permission of UK Biobank ©.
Figure 2 |
Figure 2 |. Change in native myocardial T1 time associated with prevalent cardiovascular, metabolic and systemic inflammatory diseases as compared to healthy controls.
Healthy controls free of prevalent dilated cardiomyopathy, hypertrophic cardiomyopathy, heart failure, atrial fibrillation, atrioventricular node/distal conduction disease, hypertension, diabetes mellitus, aortic stenosis, chronic kidney disease, hemochromatosis and rheumatoid arthritis constituted the reference group. Numbers of controls or cases with available native myocardial T1 time are shown below each category. For each disease, a representative T1 map of a case is provided from the study sample. Multiple linear regression was implemented and a two-sided P-value threshold adjusted for multiple testing of < 3.1 ×10⁻³ was used to define statistically significant associations. Data are presented as mean adjusted change in T1 time along with (1 − α)*100 (%) confidence intervals. Confidence intervals were constructed using the adjusted two-sided α (3.1 × 10⁻³) for multiple testing. AV, atrioventricular. T1 maps shown are reproduced by kind permission of UK Biobank ©.
Figure 3 |
Figure 3 |. Adjusted cumulative incidence of heart failure, atrial fibrillation, atrioventricular node/distal conduction disease and MACE stratified by top 20th percentile vs. lower 80th percentile of native myocardial T1 time.
MACE, major adverse cardiovascular events.
Figure 4 |
Figure 4 |. Genome-wide and transcriptome-wide association analyses.
a, Native myocardial T1 time genome-wide association results across 22 autosomes. Nearest genes are used for annotation. A fixed effect multiple linear regression model was implemented. The dashed grey line represents the threshold for genome-wide significance (two-sided P-value < 5 × 10⁻⁸ adjusted for multiple testing). b, Volcano plots depicting transcriptome-wide association results for native myocardial T1 time using human left ventricular tissue gene expression from GTEx v8 and S-PrediXcan. Upward facing triangles reflect increased T1 time associated with increased gene expression in left ventricular tissue. Downward facing triangles reflect decreased T1 time associated with increased gene expression in left ventricular tissue. The dashed grey line represents the threshold for transcriptome-wide significance (two-sided P-value < 7.5 × 10⁻⁶ adjusted for multiple testing).
Figure 5 |
Figure 5 |. Multi-omic examination of human cardiac fibroblast activation.
a, Graphical schematic describing the cardiac fibroblast activation experiments created with BioRender.com. b, Principal component analysis of control and TGFβ1-treated cardiac fibroblast RNA-seq. c, Volcano plot displaying differentially expressed genes between control (0 h) and stimulated cardiac fibroblasts (72 h post-TGFβ1 treatment) assessed using a generalized linear model implementing a negative binomial distribution. Expected differentially expressed cardiac fibrosis regulator genes are labeled. Red dots indicate significantly differentially expressed genes (FDR < 0.01) with |log2 fold-change| > 1.0 associated with TGFβ1 treatment. d, Heatmap of normalized expression levels for prioritized genes associated with GWAS loci and expressed in cardiac fibroblasts. Red labels indicate that the gene is significantly differentially expressed (FDR < 0.01). e, Genome browser tracks showing expected enhanced chromatin accessibility in cardiac fibroblasts around IGFBP1 and IGFBP3, which are known to mediate TGFβ1-induced cardiac fibroblast activation. Labels indicate hours (h) post-TGFβ1 treatment. f, Principal component analysis of ATAC-seq data from activated cardiac fibroblasts. g, left, Heatmap displaying differential chromatin accessibility analysis presented as normalized accessibility counts. Columns represent average accessibility for 3 replicates. Right, de novo motif enrichment analysis carried out on the clusters of differentially accessible ATAC-seq peaks. h, Venn diagram showing the intersection of significantly differentially expressed genes from RNA-seq, differentially accessible peaks enriched in TGFβ- treated fibroblasts (FDR < 1 × 10⁻¹⁰), and prioritized genes associated with GWAS loci. i, Representative genome browser track of ATAC-seq data depicting decreased chromatin accessibility in a promoter flanking region upstream of the KANK1 locus following TGFβ1 treatment concordant with RNA-seq data demonstrating decreased expression with TGFβ1 treatment. Genomic coordinates are based on Genome Reference Consortium Human Build 38.

Similar articles

Cited by

References

    1. del Monte-Nieto G, Fischer JW, Gorski DJ, Harvey RP & Kovacic JC Basic Biology of Extracellular Matrix in the Cardiovascular System, Part 1/4. Journal of the American College of Cardiology 75, 2169–2188 (2020). - PMC - PubMed
    1. aus dem Siepen F et al. T1 mapping in dilated cardiomyopathy with cardiac magnetic resonance: quantification of diffuse myocardial fibrosis and comparison with endomyocardial biopsy. European Heart Journal - Cardiovascular Imaging 16, 210–216 (2015). - PubMed
    1. Frangogiannis NG & Kovacic JC Extracellular Matrix in Ischemic Heart Disease, Part 4/4. Journal of the American College of Cardiology 75, 2219–2235 (2020). - PMC - PubMed
    1. Díez J, González A & Kovacic JC Myocardial Interstitial Fibrosis in Nonischemic Heart Disease, Part 3/4. Journal of the American College of Cardiology 75, 2204–2218 (2020). - PMC - PubMed
    1. Bing R et al. Imaging and Impact of Myocardial Fibrosis in Aortic Stenosis. JACC Cardiovasc Imaging 12, 283–296 (2019). - PMC - PubMed

METHODS-ONLY REFERENCES

    1. Sudlow C et al. UK biobank: an open access resource for identifying the causes of a wide range of complex diseases of middle and old age. PLoS Med 12, e1001779 (2015). - PMC - PubMed
    1. Puyol-Antón E et al. Automated quantification of myocardial tissue characteristics from native T1 mapping using neural networks with uncertainty-based quality-control. J Cardiovasc Magn Reson 22, 60 (2020). - PMC - PubMed
    1. Huang G, Liu Z, van der Maaten L & Weinberger KQ Densely Connected Convolutional Networks. arXiv:1608.06993 [cs] (2018).
    1. Ronneberger O, Fischer P & Brox T U-Net: Convolutional Networks for Biomedical Image Segmentation. arXiv:1505.04597 [cs] (2015).
    1. Deng J et al. ImageNet: A large-scale hierarchical image database. in 2009 IEEE Conference on Computer Vision and Pattern Recognition 248–255 (IEEE, 2009). doi:10.1109/CVPR.2009.5206848. - DOI

Publication types