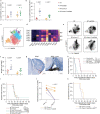
. 2023 May;4(5):665-681.
doi: 10.1038/s43018-023-00547-6. Epub 2023 Apr 20.

CD103+ regulatory T cells underlie resistance to radio-immunotherapy and impair CD8+ T cell activation in glioblastoma

Affiliations

CD103+ regulatory T cells underlie resistance to radio-immunotherapy and impair CD8+ T cell activation in glioblastoma

Luuk van Hooren et al. Nat Cancer. 2023 May.

Abstract

Glioblastomas are aggressive primary brain tumors with an inherent resistance to T cell-centric immunotherapy due to their low mutational burden and immunosuppressive tumor microenvironment. Here we report that fractionated radiotherapy of preclinical glioblastoma models induce a tenfold increase in T cell content. Orthogonally, spatial imaging mass cytometry shows T cell enrichment in human recurrent tumors compared with matched primary glioblastoma. In glioblastoma-bearing mice, α-PD-1 treatment applied at the peak of T cell infiltration post-radiotherapy results in a modest survival benefit compared with concurrent α-PD-1 administration. Following α-PD-1 therapy, CD103+ regulatory T cells (Tregs) with upregulated lipid metabolism accumulate in the tumor microenvironment, and restrain immune checkpoint blockade response by repressing CD8+ T cell activation. Treg targeting elicits tertiary lymphoid structure formation, enhances CD4+ and CD8+ T cell frequency and function and unleashes radio-immunotherapeutic efficacy. These results support the rational design of therapeutic regimens limiting the induction of immunosuppressive feedback pathways in the context of T cell immunotherapy in glioblastoma.


Conflict of interest statement

The authors have no competing interests to declare.

Figures
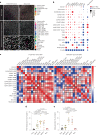
Fig. 1
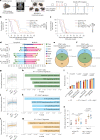
Fig. 1. The glioblastoma microenvironment is highly heterogeneous and T cell scarce.
a, Representative IMC images from treatment-naive human glioblastoma and their matched recurrent tumors post standard of care therapy. Unprocessed images (top) with corresponding processed images with lineage assignment (bottom) are shown, representative of n = 4 independent repeats. b, Bubble plot representing the difference in cell abundance in treatment-naive glioblastoma versus their matched recurrent tumors and the log2 fold change in average signal intensity of the indicated activation markers for each corresponding cell type (n = 4 patients). c, Heat map showing the Spearman correlation between indicated cell types in treatment-naive glioblastoma and their matched recurrent tumors (n = 4 patients). d,e, Flow cytometry quantification of CD3+ T cells (gated from CD45+CD11b cells) in the tumor microenvironment of PDG-Ink4a/Arf-/- (PDG-Ink4a) (d) and PDG-p53KD (PDG-p53) (e) glioblastoma isolated from primary, treatment-naive tumors (Prim) or from tumors treated with 5x2Gy RT and isolated 6 days, 12 days or 18 days post initial radiation dose (6d, 12d and 18d, respectively), or at tumor regrowth 3–4 weeks post-RT (herein termed recurrence (Rec)) (in d, Prim n = 6, d6 RT n = 9, d12 RT n = 8, d18 RT = 6, Rec n = 4 mice; in e, Prim n = 8, d6 RT n = 10, d12 RT n = 6, d18 RT = 5, Rec n = 5 mice). Statistics: one-way ANOVA with Benjamini, Krieger and Yekutieli correction for multiple testing (d and e). Data are represented as mean ± s.e.m. (d and e). Source data
Fig. 2
Fig. 2. The glioblastoma tumor microenvironment rather than antigen availability restrains RT response.
a, TMB in the PDG-Ink4a, PDG-p53 and GL261 glioblastoma mouse models and patients with glioblastoma as determined by WES analyses (Methods; MB = mutational burden; PDG-Ink4a n = 4 mice, PDG-p53 n = 3 mice, GL261 n = 3 mice, patients with glioblastoma n = 14 patients). b, Donut charts of the variant type (outer circle) and functional class (inner circle) distribution of mutations in each glioblastoma mouse model and from glioblastoma patient datasets (MNP = multiple nucleotide polymorphism; PDG-Ink4a control n = 3 mice, tumor n = 3 mice; PDG-p53 control n = 3 mice, tumor n = 3 mice; GL261 control n = 3 mice, tumor n = 3 mice; patients with glioblastoma n = 14 patients). c, Grading of key histopathological features observed in the PDG-Ink4a, PDG-p53, PDG-Ink4a-OVA and GL261 glioblastoma mouse models (pseudop. necr., pseudopallisading necrosis; cystic degen., cystic degeneration; PDG-Ink4a n = 7 mice; PDG-p53 n = 9 mice; PDG-Ink4a-OVA n = 6 mice; GL261 n = 9 mice). df, Flow cytometry quantification of CD24+CD11b dendritic cells (cDC1s, gated from CD45+Ly6CCD64MHCII+CD11c+ cells) (d), CD103+ cDC1s (e) and CD3+ T cells (gated from CD45+CD11bcells) (f) in end-stage, treatment-naive PDG-Ink4a, PDG-p53, PDG-Ink4a-OVA and GL261 tumors (in d and e, PDG-Ink4a n = 6 mice, PDG-p53 n = 6 mice, PDG-Ink4a-OVA n = 5 mice, GL261 n = 5 mice; in f, PDG-Ink4a n = 5 mice, PDG-p53 n = 7 mice, PDG-Ink4a-OVA n = 7 mice, GL261 n = 5 mice). g,h, Kaplan–Meier survival curves of GL261 (g) and PDG-Ink4a-OVA (h) tumor-bearing mice treated with rIgG2a isotype control (Cont), anti-PD-1 (IT), 5x2Gy RT or adjuvant combination treatment (RT + Adj.IT). Statistics: one-way ANOVA with Benjamini, Krieger and Yekutieli correction for multiple testing (a and df), log-rank test (g and h). Data are represented as mean ± s.e.m. (a and df). Median survival and significance depicted in Supplementary Table 1 (g and h). Source data
Fig. 3
Fig. 3. RT with adjuvant IT leads to a modest therapeutic benefit over concurrent IT in poorly immunogenic glioblastomas.
a, Schematic overview of the experimental design. PDG-Ink4a and PDG-p53 tumors were initiated as described in Methods. At 4–7 weeks post tumor initiation, tumor size was quantified by MRI. On the basis of tumor volume, mice were distributed into treatment groups by block randomization (Cont, RT, IT, RT + Adj.IT or concurrent combination treatment (RT + Conc.IT)), followed up weekly by MRI and killed at 80 days or at humane endpoint. The schematic was created using BioRender.com. b,c, Kaplan–Meier survival curves of PDG-Ink4a-treated (b) and PDG-p53-treated (c) tumor-bearing mice. d, Immune composition of PDG-Ink4a tumors. Prim, primary; Treg, regulatory T cells; CD8, CD8+ T cells; CD4, CD4+ T cells; Mono, Ly6C+ monocytes; MDM, CD49d+ Ms; MG, CD49d microglia; Neutro, Ly6G+ neutrophils; cDC1, CD24+CD11b dendritic cells; cDC2, CD24CD11b+ dendritic cells (Prim: CD8 n = 2, CD4 n = 7, Treg n = 7, Mono n = 6, MDM n = 6, MG n = 6, Neutro n = 6, cDC1 n = 5, cDC2 n = 5; d6 RT: CD8 n = 3, CD4 n = 8, Treg n = 8, Mono n = 7, MDM n = 7, MG n = 7, Neutro n = 7, cDC1 n = 6, cDC2 n = 6; d12 RT: CD8 n = 3, CD4 n = 11, Treg n = 11, Mono n = 11, MDM n = 11, MG n = 11, Neutro n = 11, cDC1 n = 10, cDC2 n = 10; d18 RT: CD8 n = 1, CD4 n = 7, Treg n = 7, Mono n = 6, MDM n = 6, MG n = 6, Neutro n = 6, cDC1 n = 3, cDC2 n = 3 mice; d6 RT + Conc.IT: CD8 n = 5, CD4 n = 10, Treg n = 10, Mono n = 7, MDM n = 7, MG n = 7, Neutro n = 7, cDC1 n = 9, cDC2 n = 9; d12 RT + Conc.IT: CD8 n = 3, CD4 n = 8, Treg n = 8, Mono n = 8, MDM n = 8, MG n = 8, Neutro n = 8, cDC1 n = 7, cDC2 n = 7; d18 RT + Conc.IT: CD8 n = 3, CD4 n = 8, Treg n = 8, Mono n = 5, MDM n = 5, MG n = 5, Neutro n = 5, cDC1 n = 3, cDC2 n = 3; d6 RT + Adj.IT: CD8 n = 3, CD4 n = 9, Treg n = 9, Mono n = 8, MDM n = 8, MG n = 8, Neutro n = 8, cDC1 n = 6, cDC2 n = 6; d12 RT + Adj.IT: CD8 n = 3, CD4 n = 9, Treg n = 9, Mono n = 9, MDM n = 9, MG n = 9, Neutro n = 9, cDC1 n = 10, cDC2 n = 10; d18 RT + Adj.IT: CD8 n = 2, CD4 n = 7, Treg n = 7, Mono n = 5, MDM n = 5, MG n = 5, Neutro n = 5, cDC1 n = 3, cDC2 n = 3). e,f, Venn diagram depicting the genes enriched in CD8+ (e) and CD4+ (f) T cells FACS-purified from d12 RT + Conc.IT and RT + Adj.IT versus RT PDG-Ink4a glioblastoma subjected to RNA-seq (Supplementary Table 2). g, Line charts displaying the normalized gene expression of the RT + IT common gene signatures in CD4+ T cells with each dot representing a gene, and lines connecting the same gene across treatment groups. Colored lines are the average of the whole gene signature (Supplementary Tables 2 and 6). h, Bar plots showing the adjusted P value of relevant significantly enriched gene sets in the RT + IT common gene signature from g (Supplementary Table 6). i, Bar plots depicting the GAGE gene set activity in CD4+ T cells for RT, RT + Conc.IT and RT + Adj.IT treatment groups. j, Line charts as described in g displaying the normalized gene expression of the RT + Adj.IT gene signatures in CD4+ T cells (Supplementary Tables 2 and 7). k, Bar plot showing the adjusted P value of relevant significantly enriched pathways in the RT + Adj.IT gene signature from j (Supplementary Table 7). l, Line charts as described in g displaying the normalized gene expression of the RT + Conc.IT gene signatures in CD4+ T cells (Supplementary Tables 2 and 8). m, Bar plot showing the adjusted P value of relevant significantly enriched pathways in the RT + Conc.IT gene signature from l (Supplementary Table 8). For em, CD4+ and CD8+ RT n = 3, CD4+ and CD8+ RT + Conc.IT n = 3, CD4+ and CD8+ RT + Adj.IT n = 3 mice. n, Flow cytometry quantification of FOXP3+ Tregs (gated from CD45+CD11bCD3+CD4+ T cells) in the TME of PDG-Ink4a glioblastoma post treatment (Prim n = 6, d6 RT n = 10, d12 RT n = 12, d6 RT + Conc.IT n = 10, d12 RT + Conc.IT n = 8, d6 RT + Adj.IT n = 5, d12 RT + Adj.IT n = 6 mice). Statistics: Fisher’s exact test in combination with the Benjamini–Hochberg method for correction of multiple hypotheses testing (two-sided; h, k and m; Supplementary Tables 6–8) and one-way ANOVA with Benjamini, Krieger and Yekutieli correction for multiple testing (i and n). Data are shown as mean − s.e.m. (d), mean + s.e.m. (i) or mean ± s.e.m. (n). NS, not significant. Median survival and significance depicted in Supplementary Table 1 (b and c). Source data
Fig. 4
Fig. 4. α-PD-1 checkpoint blockade alters the regulatory T cell contexture and leads to immunosuppressive CD103+ Tregs accumulation in the glioblastoma TME.
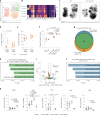
a, UMAP projection and unsupervised FlowSOM clustering of the Treg population in PDG-Ink4a tumors identified five distinct subpopulations of Tregs (Pop 1–5). b, Heat map depicting the mean fluorescence intensity (MFI) of activation markers for the identified Treg subpopulations in a. c, UMAP density projections plot of Treg subpopulations from a in RT and RT + Conc.IT treatment groups. For ac: RT n = 5, RT + Conc.IT n = 6 mice. d, Quantification of CD103+ Tregs (gated from CD45+CD11b+CD3+CD4+FOXP3+KLRG1) and KLRG1+ Tregs (gated from CD45+CD11b+CD3+CD4+FOXP3+) in RT- or RT + Conc.IT-treated PDG-Ink4a tumors (Tu, tumor). e, Quantification of CD25+ Tregs in the CD103+ and KLRG1+ Treg populations from d. For d and e: RT CD103+ n = 5, RT KLRG1+ n = 5, RT + Conc.IT CD103+ n = 6, RT + Conc.IT KLRG1+ n = 6 mice. fj, CD4+ T cells, CD25+ Tregs and CD103+ Tregs FACS-purified from RT- and RT + Conc.IT-treated PDG-Ink4a glioblastoma submitted to RNA-seq analyses. Enrichment of the Magnuson Treg gene signature (f) (RT CD4+ n = 3, RT + Conc.IT CD4+ n = 3, RT CD25+ n = 3, RT + Conc.IT CD25+ n = 3, RT + Conc.IT CD103+ n = 3 mice). Venn diagram (g) of differentially upregulated genes in RT + Conc.IT CD103+ Tregs and RT + Conc.IT CD25+ Tregs versus RT CD25+ Tregs (Supplementary Table 2). Bar graph (h) of upregulated pathways identified from the 702 shared genes common to RT + Conc.IT CD25+ Tregs and RT + Conc.IT CD103+ Tregs versus RT CD25+ Tregs (Supplementary Table 9). Volcano plot (i) depicting log2 fold change (x axis) versus significance (−log10(P value)) of differentially expressed genes in RT + Conc.IT CD25+ versus RT + Conc.IT CD103+ Tregs (Supplementary Table 12). Bar graph (j) depicting the upregulated pathways identified from the 122 genes upregulated only in RT + Conc.IT CD103+ Tregs (not in RT + Conc.IT CD25+ Tregs) versus RT CD25+ Tregs (Supplementary Table 11). For gj: RT CD25+ n = 3, RT + Conc.IT CD25+ n = 3, RT + Conc.IT CD103+ n = 3 mice. k, Flow cytometry quantification of CD39+, Ki67+, IFNy+, GrzB+ and GrzA+ FACS-purified CD8+ T cells (from control spleens) after 24 h of monoculture (mono) or co-culture (cocx) with CD25 T cells, CD25+ or CD103+ Tregs isolated from RT + Conc.IT-treated PDG-Ink4a. Cells were stimulated with anti-CD3/anti-CD28 antibodies, and cultured at a 1:1 ratio (Tregs:CD8+ T cells; mono: n = 11, CD25 n = 6, CD25+ n = 3, CD103+ n = 3 biologically independent samples). For all graphs, analyses were done at d12 post treatment initiation on the tumor-containing brain quadrant. Statistics: one-way ANOVA with Benjamini, Krieger and Yekutieli correction for multiple testing (df and k), Fisher’s exact test (two-sided; h and j) and Wald test (i) in combination with the Benjamini–Hochberg method for correction of multiple hypotheses testing (two-sided; h and j). Data are represented as mean ± s.e.m. (df) or ± s.d. (k). Gating strategies (g and k) depicted in Extended Data Fig. 6a. Source data
Fig. 5
Fig. 5. Targeting CD25+ regulatory T cells results in the formation of TLS in glioblastoma.
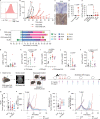
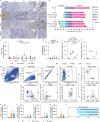
a,b, Flow cytometry quantification of CD103+ Tregs (a) and KLRG1+ (b) Tregs in PDG-Ink4a tumors (Tu, tumor; for treatment schedule, see Extended Data Fig. 7a). RT and RT + Conc.IT data points are from Fig. 4d supplemented with three additional data points per treatment group (RT n = 8, RT + aCD25 n = 4, RT + Conc.IT n = 9, RT + Conc.IT + aCD25 n = 7 mice). c,d, UMAP projections and unsupervised FlowSOM clustering analysis of CD45+CD11b cells isolated from PDG-Ink4a tumors identified seven main populations: B, B cells; NK, NK cells; CD8, CD8+ T cells; PD-1hiCD8, CD8+ T cells with high PD-1 expression; Treg, regulatory T cells; CD4, CD4+ T cells; Lin, cells negative for lineage markers (RT n = 5, RT + aCD25 n = 4, RT + Conc.IT n = 6, RT + Conc.IT + aCD25 n = 7 mice). d, Density projection plots from c of RT + Conc.IT and RT + Conc.IT + aCD25 treatment groups. e,f, Flow cytometry quantification of CD19+ B cells (e) (gated from CD45+CD11b+CD3) and CD62L+ cells (f) (% of CD19+ B cells from e; RT n = 8, RT + aCD25 n = 4, RT + Conc.IT n = 8, RT + Conc.IT + aCD25 n = 7 mice). g, Quantification of TLS area as a percentage of total tumor area in the different treatment groups (RT n = 4, RT + aCD25 n = 5, RT + Conc.IT n = 4, RT + Conc.IT + aCD25 n = 8 mice). h, Representative H&E staining of TLS quantified in g (scale bars, 10 µm; representative of n = 8 independent repeats). iq, Representative image of a TLS in RT + Conc.IT + aCD25-treated PDG-Ink4a tumor sequentially stained for B220 (i), Ki67 (j), CD3 (k), CD8 (l), CD4 (m), PD-1 (n), FOXP3 (o), PNA (p) and H&E (q). Red squares (oq) indicate magnified areas. Red arrows (q) identify lymphoblastic-like cells within the TLS. Scale bars, 100 µm for the main and 10 µm for the magnified panels (iq). Representative of n = 8 independent repeats. For all graphs, analyses were done at d12 post treatment initiation on the tumor-containing brain quadrant. Statistics: one-way ANOVA with Benjamini, Krieger and Yekutieli correction for multiple testing (a, b and eg). Data are represented as mean ± s.e.m. (a, b and eg). Source data
Fig. 6
Fig. 6. Combination treatment of RT and CD25+ Treg targeting improves survival in a CD8+ T cell-dependent manner.
a, Flow cytometry quantification of CD25+ Tregs (gated from CD45+CD11bCD3+CD4+FOXP3+ T cells) in the blood of PDG-Ink4a tumor-bearing mice treated with RT + Conc.IT or RT + Conc.IT + aCD25 (Pre Tx, before treatment; RT + Conc.IT n = 6, RT + Conc.IT + aCD25 n = 11 mice). b, Kaplan–Meier survival curves of PDG-Ink4a tumor-bearing mice treated with 5x2Gy RT + Conc.IT or RT + Conc.IT + aCD25 (for treatment schedule, see Extended Data Fig. 7a). c, Flow cytometry quantification of CD8+ T cells (gated from CD45+CD11bCD3+ cells) in d12-treated PDG-Ink4a glioblastoma (RT n = 5, RT + aCD25 n = 4, RT + Conc.IT n = 18, RT + Conc.IT + aCD25 n = 7 mice). d, Flow cytometry quantification of GrzA+ CD8+ T cells from c (RT n = 5, RT + aCD25 n = 4, RT + Conc.IT n = 6, RT + Conc.IT + aCD25 n = 7 mice). e, Flow cytometry quantification of CD8+ T cells (gated from CD45+CD11bCD3+ cells) in the blood of PDG-Ink4a glioblastoma-bearing mice from the indicated treatment groups. Each line indicates the matched quantification before start treatment and at d6–7 (RT + Conc.IT + aCD25 n = 5, RT + Conc.IT + aCD25 + aCD8 n = 6 mice). f, Kaplan–Meier survival curves of PDG-Ink4a tumor-bearing mice treated with RT + Conc.IT + aCD25 or RT + Conc.IT + aCD25 + aCD8. Statistics: log-rank test (b and f), one-way ANOVA with Benjamini, Krieger and Yekutieli correction for multiple testing (c and d), two-tailed unpaired t-test (e). Data are represented as mean + s.e.m. (a) or ± s.e.m. (c and d). Median survival and significance depicted in Supplementary Table 1 (b and f). Source data
Extended Data Fig. 1
Extended Data Fig. 1. Imaging Mass Cytometry analyses of immune cell interactions and avoidance in the human glioblastoma tumor microenvironment.
a, Heatmap showing the interaction/avoidance scores of cell types quantified in Fig. 1b in treatment-naive human glioblastoma (Primary (Prim), upper half square) and their matched recurrent tumors post standard of care therapy (Recurrent (Rec) lower half square). Each column displays the cell type interaction/avoidance score with the corresponding cell types in the rows below (n = 4 patients). be, Flow cytometry quantification of T cells (gated as CD45+CD11bCD3+) in the TME of PDG-Ink4a (b,c) or PDG-p53 (d,e) glioblastoma isolated from treatment-naïve, primary tumors (Prim), or from tumors treated with 5x2Gy radiotherapy (RT) isolated 6 days, 12 days or 18 days post initial radiation dose (6d, 12d, 18d, respectively) or at tumor regrowth 3-4 weeks post-RT (herein termed recurrence (Rec)) tumors. B, CD8+ T cells (gated from CD45+CD11b+CD3+; Prim n = 5, d6 RT n = 6, d12 RT n = 8 mice). c, CD4+ T cells (gated from CD45+CD11b+CD3+; Prim n = 5, d6 RT n = 10, d12 RT n = 8, d18 RT n = 4, Rec n = 4 mice). d, CD8+ T cells (gated from CD45+CD11b+CD3+; Prim n = 4, d6 RT n = 6, d12 RT n = 5, d18 RT n = 5 mice). e, CD4+ T cells (gated from CD45+CD11b+CD3+; Prim n = 4, d6 RT n = 10, d12 RT n = 8, d18 RT n = 5 mice). Statistics: one-way ANOVA with Benjamini, Krieger and Yekutieli correction for multiple testing (b-e). Data are represented as mean ± S.E.M. (b-e). Source data
Extended Data Fig. 2
Extended Data Fig. 2. PDG-Ink4a-OVA model setup and tumor response to RT + IT in immunogenic glioblastoma.
a, Representative flow cytometry histograms displaying ovalbumin (OVA) fluorescence intensity in DF1-OVA cells used to generate PDG-Ink4a-OVA glioblastoma. b, Longitudinal individual tumor volumes measured by weekly MRI in PDG-Ink4a (black) and PDG-Ink4a-OVA (red) tumor-bearing mice. Each dot is a tumor volume quantification. Lines indicate matched tumor progression per animal (PDG-Ink4a n = 6, PDG-Ink4a-OVA n = 17 mice). c, Representative image of immunohistochemical OVA staining in endpoint, treatment-naïve PDG-Ink4a (upper panel) and PDG-Ink4a-OVA glioblastoma (lower panel; scale bar: 50μm; representative of n = 6 PDG-Ink4a and n = 12 PDG-Ink4a-OVA independent repeats). d,e Flow cytometry quantification of OVA+ T cells (gated from CD45+CD11b-CD3+CD8+) in tumor (d) and superficial cervical lymph nodes (LN), spleen (SP) and blood (e) in endstage, treatment-naive PDG-Ink4a-OVA tumor-bearing mice (FMO = fluorescence minus one; d: Tumor FMO n = 6, Tumor = 12 mice. e: SP FMO n = 8, LN FMO n = 3, Blood FMO n = 6, SP n = 9, LN n = 8, Blood n = 12 mice). f, Relative immune composition in the glioblastoma TME of primary, treatment-naive tumors. Treg = regulatory T cells, CD8 = CD8+ T cells, CD4 = CD4+ T cells, Mono = Ly6C+ monocytes, MDM = CD49d+ monocyte-derived macrophages, MG = CD49d- microglia, Neutro = Ly6G+ neutrophils, cDC1 = CD24+CD11bdendritic cells, cDC2 = CD24CD11b+ dendritic cells (PDG-Ink4a: CD8 n = 2, CD4 n = 7, Treg n = 7, Mono n = 6, MDM n = 6, MG n = 6, Neutro n = 6, cDC1 n = 5, cDC2 n = 5; PDG-p53: CD8 n = 4, CD4 n = 8, Treg n = 8, Mono n = 2, MDM n = 2, MG n = 2, Neutro n = 2, cDC1, cDC2 = N/A; PDG-Ink4a-OVA: CD8 n = 9, CD4 n = 9, Treg n = 9, Mono n = 9, MDM n = 9, MG n = 9, Neutro n = 9, cDC1 n = 9, cDC2 n = 9; GL261: CD8 n = 5, CD4 n = 5, Treg n = 6, Mono n = 5, MDM n = 5, MG n = 5, Neutro n = 5, cDC1 n = 5, cDC2 n = 5). g-k, Flow cytometry quantification of CD8+ T cells in end-stage, treatment-naive PDG-Ink4a, PDG-p53, PDG-Ink4a-OVA and GL261 tumors. g, total CD8+ T cells (gated from CD45+CD11bCD3+ cells). h, Ki67+ CD8+ T cells from (g). i, CD69+ CD8+ T cells from (g). j, CD44+ CD8+ T cells from (g). k, PD-1+ CD8+ T cells from (g). For g: PDG-Ink4a n = 5, PDG-p53 n = 7, PDG-Ink4a-OVA n = 9 mice, GL261 n = 5 mice. For h-k: PDG-Ink4a n = 5, PDG-p53 n = 4, PDG-Ink4a-OVA n = 9 mice, GL261 n = 5 mice. l, Schematic overview of the experimental design. GL261 and PDG-Ink4a-OVA tumors were initiated as described in Methods. Tumor size was quantified by MRI. Based on tumor volume, mice were distributed into treatment groups by block randomization (rIgG2a isotype control (Cont), anti-PD-1 (IT), 5x2Gy radiotherapy (RT), or adjuvant combination treatment (RT + Adj.IT)), followedup weekly by MRI and sacrificed at 80d or at humane endpoint. Schematic created using BioRender.com. m, Distribution of GL261 tumor volume at the time of inclusion into treatment (Cont n = 8, IT n = 10, RT n = 13, RT + Adj.IT n = 13 mice). n, Longitudinal individual tumor volumes measured by weekly MRI in Cont, RT, IT, and RT + Adj.IT treated GL261 tumor-bearing mice (Cont n = 4, IT n = 7, RT n = 7, RT + Adj.IT n = 6 mice). o, Distribution of PDG-Ink4a-OVA tumor volume at the time of inclusion into treatment (Cont n = 10, IT n = 9, RT n = 6, RT + Adj.IT n = 7 mice). p, Longitudinal individual tumor volumes measured by weekly MRI in Cont, RT, IT and RT + Adj.IT treated PDG-Ink4a-OVA tumor-bearing mice (Cont n = 5, IT n = 4, RT n = 6, RT + Adj.IT n = 7 mice). For (n,p), each line indicates matched tumor progression per mouse. The vertical dashed line indicates start of treatment (Tx start). Statistics: Two-sided unpaired t-test (d), one-way ANOVA with Benjamini, Krieger and Yekutieli correction for multiple testing (e,g-k). Data are represented as mean ± S.E.M. (d,e,g-k,m,o) or - S.E.M. (f). Source data
Extended Data Fig. 3
Extended Data Fig. 3. Tumor volume monitoring and progression during radio-immunotherapy response in the PDG-Ink4a and PDG-p53 poorly-immunogenic glioblastoma models.
a,b, Distribution of PDG-Ink4a (a) and PDG-p53 (b) tumor volume measured by MRI imaging at the time of inclusion into treatment Cont, RT, IT, RT + Concurrent IT (RT + Conc.IT) and RT + Adj.IT (a, Cont n = 8, IT n = 8, RT n = 17, RT + Conc.IT n = 18, RT + Adj.IT n = 17 mice. b, Cont n = 8, IT n = 4, RT n = 15, RT + Conc.IT n = 17, RT + Adj.IT n = 18 mice). c-h, Longitudinal individual tumor volumes measured by weekly MRI in PDG-Ink4a (c-e) and PDG-p53 (f-h) tumor-bearing mice treated with Cont, IT, RT, RT + Conc.IT and RT + Adj.IT. Each line indicates the matched tumor progression per individual mouse (c-e: Cont n = 8, IT n = 8, RT n = 17, RT + Conc.IT n = 18, RT + Adj.IT n = 18 mice; f-h: Cont n = 8, IT n = 5, RT n = 18, RT + Conc.IT n = 22, RT + Adj.IT n = 17 mice). i, Tumor volume regression in PDG-Ink4a glioblastoma calculated by MRI at d7 and d14 in mice included in Cont, IT, RT, RT + Conc.IT and RT + Adj.IT treatment groups (d7 Cont n = 4, d7 IT n = 6, d7 RT n = 18, d7 RT + Conc.IT n = 22, d7 RT + Adj.IT n = 22, d14 RT n = 19, d14 RT + Conc.IT n = 23, d14 RT + Adj.IT n = 26 mice). j,k, Dot plot graphs depicting the correlation between PDG-Ink4a (j) and PDG-p53 (k) individual tumor volume at treatment inclusion and the animal overall survival in days (j: RT n = 17, RT + Conc.IT n = 17, RT + Adj.IT n = 17; k: RT n = 15, RT + Conc.IT n = 17, RT + Adj.IT n = 18). Data are represented as mean ± S.E.M. (a,b) or + S.E.M. (i). Source data
Extended Data Fig. 4
Extended Data Fig. 4. Dynamic changes in the tumor microenvironment in response to RT, RT + Conc.IT and RT + Adj.IT.
a, Representative image of immunohistochemical staining for CD3, CD8, CD4 and FOXP3 on sequential sections of endpoint PDG-Ink4a tumors from cont, RT, IT, RT + Conc.IT and RT + Adj.IT treated mice (scale bar: 50 um; Cont is representative of n = 7, IT is representative of n = 8, RT is representative of n = 16, RT + Conc.IT is representative of n = 24 and RT + Adj.IT is representative of n = 21 independent repeats). b, Relative immune composition of primary (Prim) PDG-p53 glioblastoma as a percentage of CD45+ immune cells. Treg = regulatory T cells, CD8 = CD8+ T cells, CD4 = CD4+ T cells, Mono = Ly6C+ monocytes, MDM = CD49d+ monocyte-derived macrophages, MG = CD49d- microglia, Neutro = Ly6G+ neutrophils (Prim: CD8 n = 4, CD4 n = 8, Treg n = 8, Mono n = 2, MDM n = 2, MG n = 2, Neutro n = 2; d6 RT: CD8 n = 6, CD4 n = 10, Treg n = 10, Mono n = 9, MDM n = 9, MG n = 9, Neutro n = 9; d12 RT: CD8 n = 4, CD4 n = 7, Treg n = 6, Mono n = 3, MDM n = 3, MG n = 3, Neutro n = 3; d6 RT + Conc.IT: CD8 n = 5, CD4 n = 9, Treg n = 9, Mono n = 9, MDM n = 9, MG n = 9, Neutro n = 9; d12 RT + Conc.IT: CD8 n = 9, CD4 n = 8, Treg n = 9, Mono n = 5, MDM n = 5, MG n = 5, Neutro n = 5; d6 RT + Adj.IT: CD8 n = 4, CD4 n = 8, Treg n = 8, Mono n = 9, MDM n = 9, MG n = 9, Neutro n = 9; d12 RT + Adj.IT: CD8 n = 5, CD4 n = 4, Treg n = 5, Mono n = 5, MDM n = 5, MG n = 5, Neutro n = 5). c, Flow cytometry quantification of Ly6G+ neutrophils (gated from CD45+CD11b+Ly6cint) from PDG-Ink4a treated tumors (Prim, RT, RT + Conc.IT or RT + Adj.IT) at the indicated time points post treatment initiation (Prim n = 6, d6 RT n = 5, d12 RT n = 10, d18 RT n = 10, d6 RT + Conc.IT n = 8, d12 RT + Conc.IT n = 8, d18 RT + Conc.IT n = 9, d6 RT + Adj.IT n = 12, d12 RT + Adj.IT n = 5, d18 RT + Adj.IT n = 5 mice). d-f, Flow cytometry quantification of PD-L1 mean fluorescence intensity (MFI) in myeloid cells in the TME of primary human (d), PDG-Ink4a (e) and PDG-p53 (f) glioblastoma. Tu = tumor cells (gated from CD45CD11b), Mono = monocytes (gated from CD45+CD11B+CD14+CD16+ (d) or CD45+CD11b+Ly6G(e,f), MDM = monocyte-derived macrophages (gated from CD45+CD11B+CD14+CD16CD49D+ (d) or CD45+CD11b+Ly6GLy6CCD49d+ (e,f)), MG = microglia (gated from CD45+CD11B+CD14+CD16CD49D (d) or CD45+CD11b+Ly6GLy6CCD49d (e,f)), Neu = neutrophils (gated from CD45+CD11B+CD66B+ (d) or CD45+CD11b+Ly6G+Ly6Cint (e,f). d, n = 5 patients. e, n = 6 mice. f, n = 2 mice). g, Flow cytometry plots of CD4+ (gated CD45+CD11bCD3+CD4+) and CD8+ T cell (gated CD45+CD11bCD3+CD8+) FACS-isolation strategy of d12 RT, RT + Conc.IT and RT + Adj.IT PDG-Ink4a tumors. Sorted cells gated in red. Representative of n = 3 independent repeats. h-k, Normalized expression of indicated genes in CD8+ T cells (gated from CD45+CD11bCD3+) FACS-purified from PDG-Ink4a tumors 12d post treatment initiation and subjected to RNA sequencing. l, Enriched pathways specific to RT + Adj.IT CD8+ T cells. (Supplementary Table S5). For h-l, RT n = 3, RT + Conc.IT n = 3 and RT + Adj.IT n = 3 mice. Statistics: one-way ANOVA with Benjamini, Krieger and Yekutieli correction for multiple testing (c,h-k) and Fisher’s exact test in combination with the Benjamini-Hochberg method for correction of multiple hypotheses testing (l). Data are represented as mean - S.E.M. (b), ± S.E.M. (c-f) or + S.E.M. (h-k). Source data
Extended Data Fig. 5
Extended Data Fig. 5. Analyses of CD4+ T cell and Treg subsets in radio-immunotherapy treated glioblastoma.
a-e, Flow cytometry quantification of FOXP3+ Tregs from primary (P), RT, RT + Conc.IT and RT + Adj.IT treated tumor-bearing mice at indicated timepoints. a, Ki67+ Tregs (gated from CD45+CD11bCD3+CD4+FOXP3+ T cells) in PDG-Ink4a tumors (Primary n = 5, RT n = 7, RT + Conc.IT n = 9, RT + Adj.IT n = 9 mice). b,c FOXP3+ Tregs (gated from CD45+CD11bCD3+CD4+ T cells) in the superficial cervical lymph nodes (LN) (b) and blood (c) of PDG-Ink4a tumor bearing mice (b: Primary n = 4, d6 RT n = 9, d12 RT n = 10, d6 RT + Conc.IT n = 9, d12 RT + Conc.IT n = 7, d6 RT + Adj.IT n = 5, d12 RT + Adj.IT n = 6 mice. c: Primary n = 4, d6 RT n = 8, d12 RT n = 9, d6 RT + Conc.IT n = 10, d12 RT + Conc.IT n = 13, d6 RT + Adj.IT n = 10, d12 RT + Adj.IT n = 10 mice). d,e FOXP3+ Tregs (gated from CD45+CD11bCD3+CD4+ T cells) in tumors (d) and LN (e) of PDG-p53 tumor-bearing mice (d: Primary n = 4, d6 RT n = 8, d12 RT n = 8, d6 RT + Conc.IT n = 7, d12 RT + Conc.IT n = 7, d6 RT + Adj.IT n = 9, d12 RT + Adj.IT n = 5 mice. e: d6 RT n = 5, d12 RT n = 4, d6 RT + Conc.IT n = 4, d12 RT + Conc.IT n = 2, d6 RT + Adj.IT n = 4, d12 RT + Adj.IT n = 3 mice). f, UMAP projection and unsupervised FlowSOM clustering of CD4+ T cell subpopulations in PDG-Ink4a glioblastoma 6d post treatment initiation identified 4 distinct subpopulations of CD4+ T cells (Pop 0-3). g, Heatmap depicting the MFI of activation markers for each subpopulation identified in (f). h, UMAP density projections plot of CD4 + T cell subpopulations from (f). i, UMAP projection and unsupervised FlowSOM clustering of CD4+ T cell subpopulations in PDG-Ink4a glioblastoma 12d post treatment initiation identified 4 distinct subpopulations of CD4+ T cells (Pop 0-3). j, Heatmap depicting the MFI of activation markers for each subpopulation identified in (i). k, UMAP density projections plot of CD4 + T cell subpopulations from (i) l-m, Stacked bar plot displaying the distribution of CD4+ T cells subpopulations in RT + Conc.IT and RT + Adj.IT treated tumors at d6 (l) and d12 (m) post treatment initiation. For f-h,l: d6 RT + Conc.IT n = 4, d6 RT + Adj.IT n = 4 mice. For i-k,m: d12 RT + Conc.IT n = 6, d12 RT + Adj.IT n = 7 mice. Statistics: one-way ANOVA with Benjamini, Krieger and Yekutieli correction for multiple testing (a-e) and two-stage linear step-up procedure of Benjamini, Krieger and Yekutieli (m). Data are represented as mean ± S.E.M. (a-e) or - S.E.M. (l,m). Source data
Extended Data Fig. 6
Extended Data Fig. 6. Transcriptional and functional analyses of Treg subsets in RT + Conc.IT treated glioblastoma.
a, Representative flow cytometry plots depicting the FACS-isolation strategy for CD25 T cells (gated CD45+CD11bCD3+CD4+CD8KLRG1), CD25+ Tregs (gated CD45+CD11bCD3+CD4+CD8) and CD103+ Tregs (gated CD45+CD11bCD3+CD4+CD8KLRG1) from tumors or spleens of PDG-Ink4a glioblastoma-bearing mice, 12d post RT and RT + Conc.IT treatment initiation, as well as CD8+ T cells from control spleens (gated CD45+CD11bCD3+). Sorted cells gated in red. Representative of n = 5 independent repeats. b, Bar graphs showing the normalized expression of indicated genes in CD25+ Tregs (gated from CD45+CD11b+CD3+CD8CD4+) and CD103+ Tregs (gated from CD45+CD11b+CD3+CD8CD4+KLRG1) FACS-purified from PDG-Ink4a glioblastoma 12d post treatment initiation (RT CD25+ n = 3, RT + Conc.IT CD25+ n = 3, RT + Conc.IT CD103+ n = 3 mice). c, Flowcytometry quantification of CD39+, Ki67+, IFNy+, GrzB+ and GrzA+ FACS-purified CD8+ T cells (CD45+CD11bCD3+) from control spleen after 24 h of monoculture (mono) or co-culture (cocx) with CD25 T cells (CD45+CD11bCD3+CD4+CD8KLRG1), CD25+ Tregs (CD45+CD11bCD3+CD4+CD8) or CD103+ Tregs (CD45+CD11bCD3+CD4+CD8KLRG1) isolated from spleens of tumor-bearing PDG-Ink4a mice 12d post RT + Conc.IT initiation. Cells were stimulated with anti-CD3/anti-CD28 antibodies, except for the monoculture control (mono unstim), and cultured in 1:1 and 1:2 ratios (Treg:CD8+ T cell; unstim n = 7, mono: n = 7, 1:1 CD25 n = 5, 1:1 CD25+ n = 3, 1:1 CD103+ n = 2, 1:2 CD25 n = 5, 1:2 CD25+ n = 5, 1:2 CD103+ n = 5 biologically independent samples). Statistics: one-way ANOVA with Benjamini, Krieger and Yekutieli correction for multiple testing (b,c). Data in this figure are represented as mean + S.E.M (b) and ± S.E.M (c). Gating strategies (c) depicted in Extended Data Fig. 6a. Source data
Extended Data Fig. 7
Extended Data Fig. 7. Alterations of the systemic and local immune cell contexture post CD25-mediated depletion of Tregs in glioblastoma combination treatment.
a, Schematic overview of the experimental design. PDG-Ink4a tumors were initiated as described in Methods. At 4-7 weeks post tumor initiation, tumor size was quantified by MRI. Based on tumor volume, mice were distributed into treatment groups with (anti-CD25 (aCD25), anti-CTLA-4 (aCTLA-4), RT, RT combined with anti-CD25 (RT + aCD25), RT + Conc.IT, RT + Conc.IT combined with anti-CD25 (RT + Conc.IT + aCD25), RT + Conc.IT + aCD25 combined with anti-CD8 (RT + Conc.IT + aCD25 + aCD8), RT combined with concurrent anti-CTLA-4 immunotherapy (RT + aCTLA-4), RT + aCTLA-4 combined with anti-CD25 (RT + aCTLA-4 + aCD25). Anti-PD-1 and anti-CTLA-4 treatment were administered every third day until endpoint, anti-CD25 at 0d, 5d and 11d and anti-CD8 treatment every sixth day until endpoint. Mice were followed-up weekly by MRI and sacrificed for immunohistochemical and flow cytometry analysis at d12 post treatment initiation or for survival analysis at humane endpoint or at experimental endpoint (80d). The schematic was created using BioRender.com. bg, Flow cytometry quantification of CD25+ Tregs (gated from CD45+CD11bCD3+CD4+FOXP3+ T cells), FOXP3+ Tregs (gated from CD45+CD11b-CD3+CD4+ T cells), CD25+ CD4+FOXP3 T cells (gated from CD45+CD11bCD3+CD4+FOXP3 T cells) and CD25+ CD8+ T cells (gated from CD45+CD11bCD3+ T cells) of PDG-Ink4a tumor-bearing mice. b,c, CD25+ Tregs (b) and FOXP3+ Tregs (c) in the blood at d6-7 after treatment start (b: RT n = 5, RT + aCD25 n = 5, RT + Conc.IT n = 6, RT + Conc.IT + aCD25 n = 9 mice. c: RT n = 13, RT + aCD25 n = 5, RT + Conc.IT n = 15, RT + Conc.IT + aCD25 n = 9 mice). d,e, Intratumoral CD25+ Tregs (d) and FOXP3+ Tregs (e) at d12 (d: RT n = 5, RT + aCD25 n = 4, RT + Conc.IT n = 6, RT + Conc.IT + aCD25 n = 7 mice. e: RT n = 16, RT + aCD25 n = 4, RT + Conc.IT n = 14, RT + Conc.IT + aCD25 n = 7 mice). f,g, CD25+ Tregs (f) and FOXP3+ Tregs (g) in the superficial cervical LN at d12 (f: RT n = 5, RT + aCD25 n = 4, RT + Conc.IT n = 6, RT + Conc.IT + aCD25 n = 7 mice. g: RT n = 12, RT + aCD25 n = 4, RT + Conc.IT n = 11, RT + Conc.IT + aCD25 n = 7 mice). h,i, Flow cytometry quantification of intratumoral CD25+ CD4+FOXP3 T cells (h) and CD25+ CD8+ T cells (i) at d12 (h: RT n = 5, RT + aCD25 n = 4, RT + Conc.IT n = 6, RT + Conc.IT + aCD25 n = 7 mice. i: RT n = 5, RT + aCD25 n = 4, RT + Conc.IT n = 6, RT + Conc.IT + aCD25 n = 7 mice). j, Flow cytometry quantification of intratumoral CD103+ Tregs at d12 (RT n = 8, RT + aCD25 n = 4, RT + Conc.IT n = 9, RT + Conc.IT + aCD25 n = 7 mice). For (c,e,g), RT and RT + Conc.IT data points include data from Fig. 3n (e) and Fig. 5b,c (c,g). Statistics: one-way ANOVA with Benjamini, Krieger and Yekutieli correction for multiple testing (b-j). Data are represented as mean ± S.E.M. (b-j). Source data
Extended Data Fig. 8
Extended Data Fig. 8. CD25-mediated Treg depletion combined with RT + Conc.IT leads to TLS formation, increased effector T cell levels and a survival benefit.
a,b, Flow cytometry quantification of CD4+FOXP3 T cells (gated from CD45+CD11bCD3+ T cells) (a) and of CD4+FOXP3 T cells/CD4+FOXP3+ Treg ratio (gated from CD45+CD11bCD3+ T cells) (b). For a,b, RT n = 5, RT + aCD25 n = 4, RT + Conc.IT n = 6, RT + Conc.IT + aCD25 n = 7 mice. c, UMAP projection and unsupervised FlowSOM clustering of the CD4+ T cell population (from Fig. 5c) identified 7 distinct subpopulations of CD4+ T cells (Pop 0-6). D, Heatmap depicting the MFI of activation markers in the CD4+ T cell subpopulations identified in (c). e, UMAP density projections plot of CD4+ T cell subpopulations identified in RT, RT + aCD25, RT + Conc.IT and RT + Conc.IT + aCD25 treatment groups. For c-e, RT n = 5, RT + aCD25 n = 4, RT + Conc.IT n = 6, RT + Conc.IT + aCD25 n = 7 mice. f, Flow cytometry quantification of NK1.1+ NK cells (gated from CD45+CD11bCD19CD3; RT n = 5, RT + aCD25 n = 4, RT + Conc.IT n = 7, RT + Conc.IT + aCD25 n = 7 mice). g, Representative image of immunohistochemical staining for B220 in RT + Conc.IT + aCD25 treated tumors (scale bar: 500 um for main panel, 50 um for magnified panel; representative of n = 8 independent repeats). h, Kaplan–Meier survival curve of PDG-Ink4a tumor-bearing mice treated with Cont, aCD25, RT or RT + aCD25 (see Extended Data Fig. 7a for treatment schedule). i, Kaplan–Meier survival curve of PDG-Ink4a tumor-bearing mice treated with aCTLA-4, RT, RT + aCTLA-4, RT + Conc.IT (aPD-1) or RT + aCTLA-4 + aCD25 (see Extended Data Fig. 7a for treatment schedule). j, Flow cytometry quantification of CD8+ T cells (gated from CD45+CD11bCD3+ cells) in the blood of PDG-Ink4a glioblastoma-bearing mice at the indicated treatment groups. Each line indicates the matched quantification before start of treatment and at d6-7. k, Kaplan–Meier survival curves of PDG-Ink4a tumor-bearing mice treated with RT + Conc.IT or RT + Conc.IT + aCD8 (RT + Conc.IT n = 5 and RT + Conc.IT + aCD8 n = 6 mice). For a-g, analyses were done at d12 post treatment initiation. Statistics: one-way ANOVA with Benjamini, Krieger and Yekutieli correction for multiple testing (a,b,f), log-rank test (h,i,k) and two-sided unpaired t-test (j). Data are represented as mean ± S.E.M (a,b,f). Mice depicted in the survival curves were treated within the same cohorts (h,i,k). Median survival and significance depicted in Supplementary Table S1 (h,i,k). Source data

Similar articles

Cited by

References

    1. De Martino M, Daviaud C, Vanpouille-Box C. Radiotherapy: an immune response modifier for immuno-oncology. Semin. Immunol. 2021;52:101474. doi: 10.1016/j.smim.2021.101474. - DOI - PubMed
    1. Aldape K, et al. Challenges to curing primary brain tumours. Nat. Rev. Clin. Oncol. 2019;16:509–520. doi: 10.1038/s41571-019-0177-5. - DOI - PMC - PubMed
    1. Reardon DA, et al. Effect of nivolumab vs bevacizumab in patients with recurrent glioblastoma: the CheckMate 143 phase 3 randomized clinical trial. JAMA Oncol. 2020;6:1003–1010. doi: 10.1001/jamaoncol.2020.1024. - DOI - PMC - PubMed
    1. Cloughesy TF, et al. Neoadjuvant anti-PD-1 immunotherapy promotes a survival benefit with intratumoral and systemic immune responses in recurrent glioblastoma. Nat. Med. 2019;25:477–486. doi: 10.1038/s41591-018-0337-7. - DOI - PMC - PubMed
    1. Versluis JM, Long GV, Blank CU. Learning from clinical trials of neoadjuvant checkpoint blockade. Nat. Med. 2020;26:475–484. doi: 10.1038/s41591-020-0829-0. - DOI - PubMed

Publication types

MeSH terms

Substances