. 2023 Apr 20;8(1):23.
doi: 10.1186/s41235-023-00474-1.

Illusion of knowledge in statistics among clinicians: evaluating the alignment between objective accuracy and subjective confidence, an online survey

Affiliations

Illusion of knowledge in statistics among clinicians: evaluating the alignment between objective accuracy and subjective confidence, an online survey

Camille Lakhlifi et al. Cogn Res Princ Implic. .

Abstract

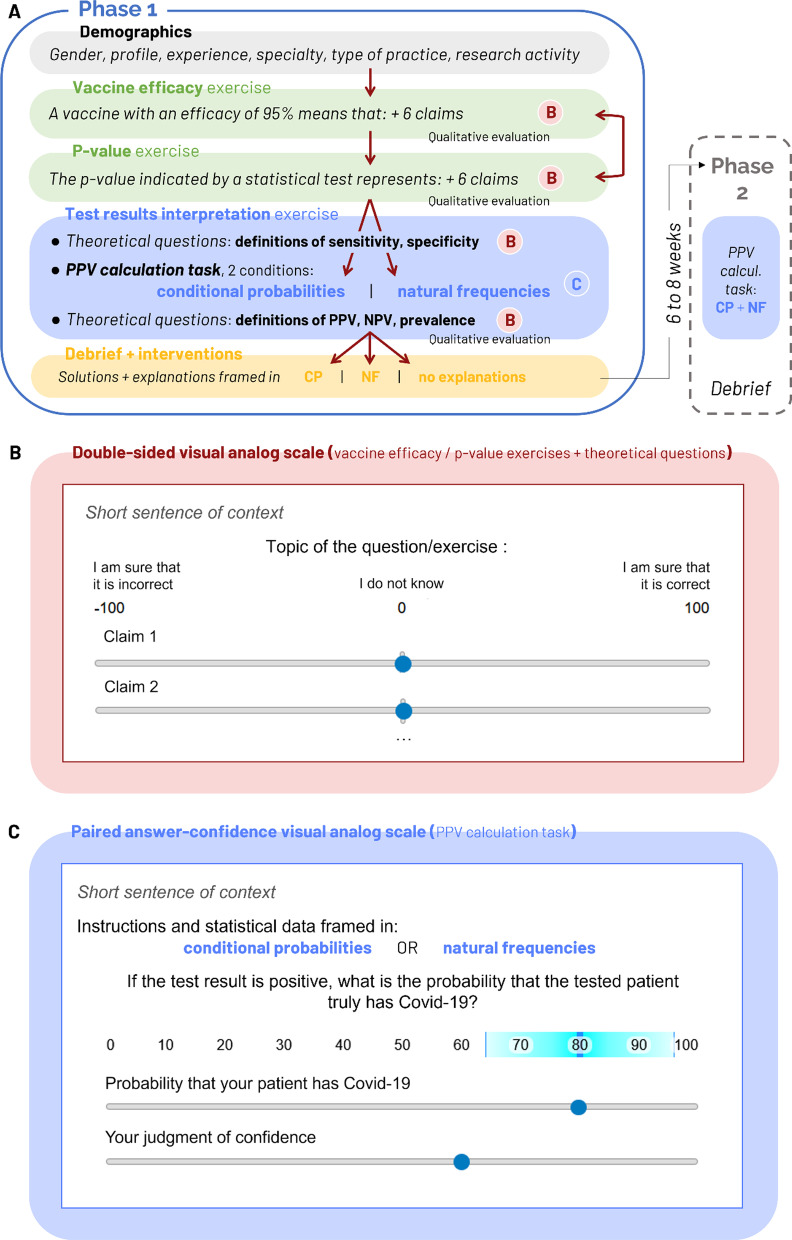
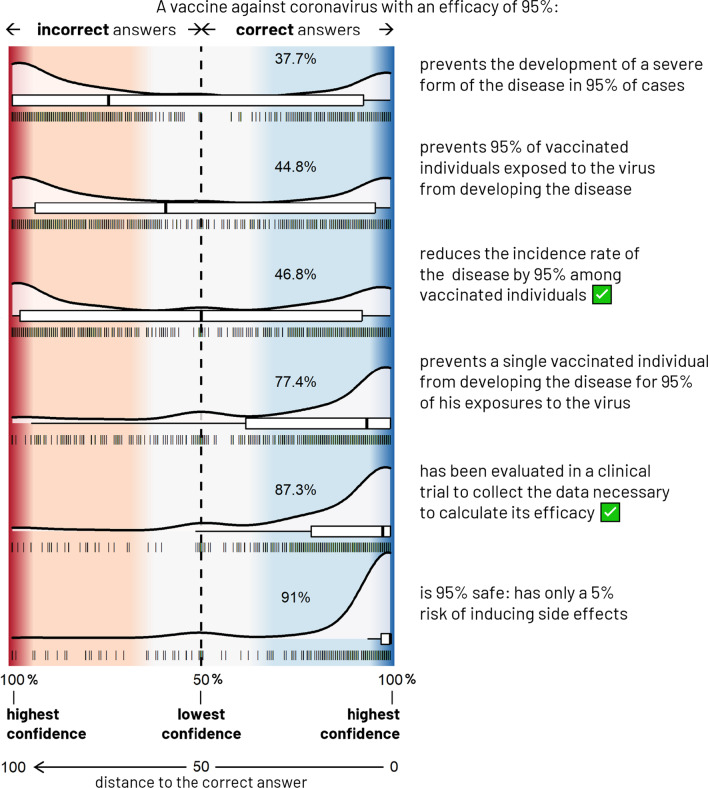
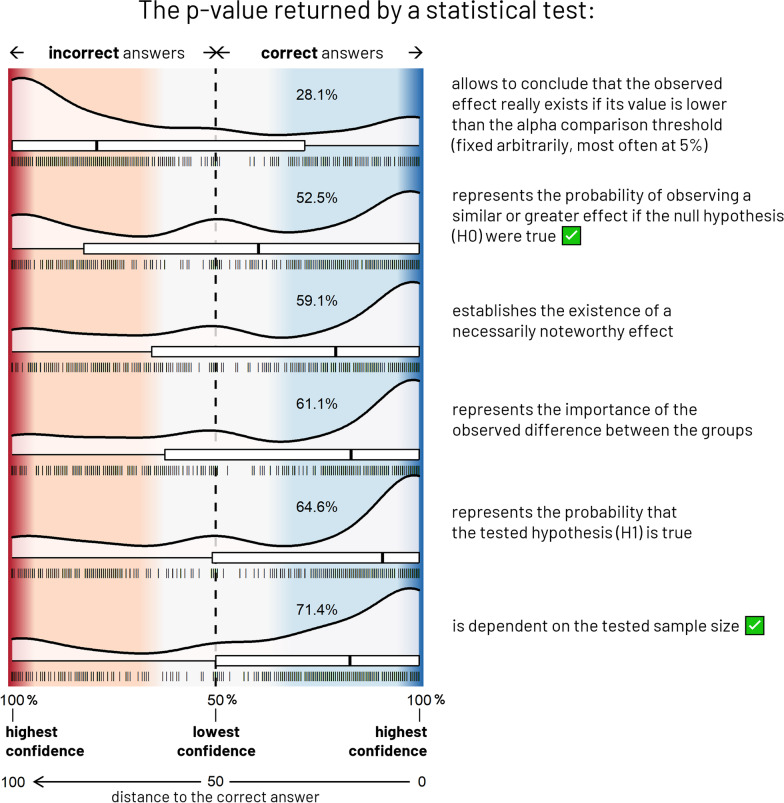
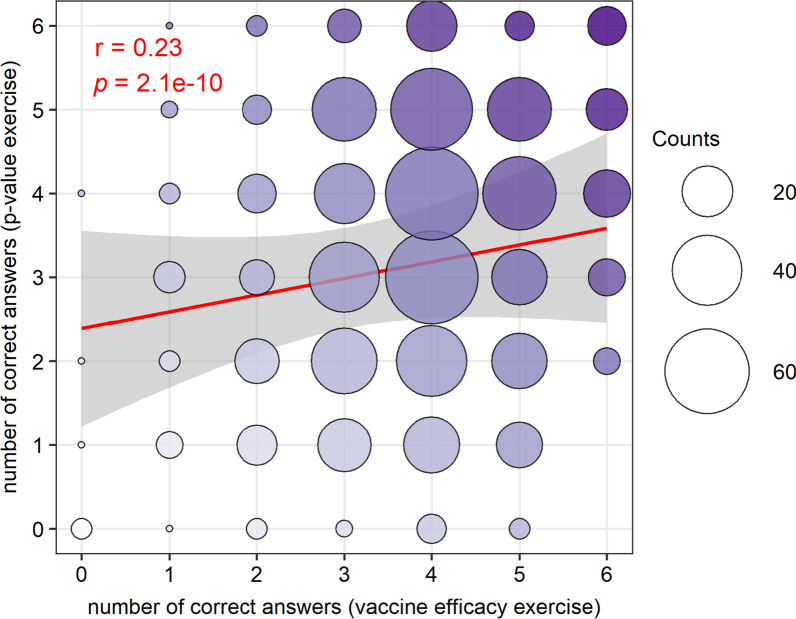
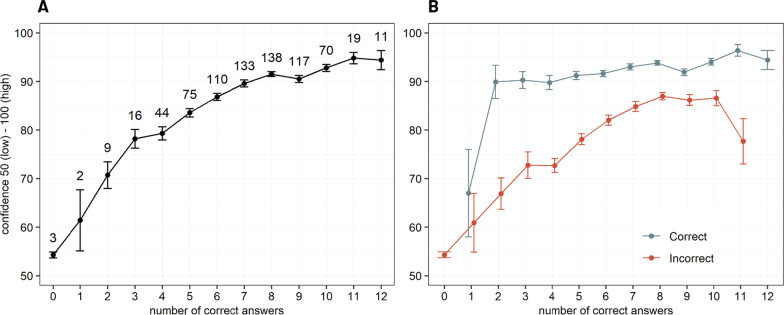
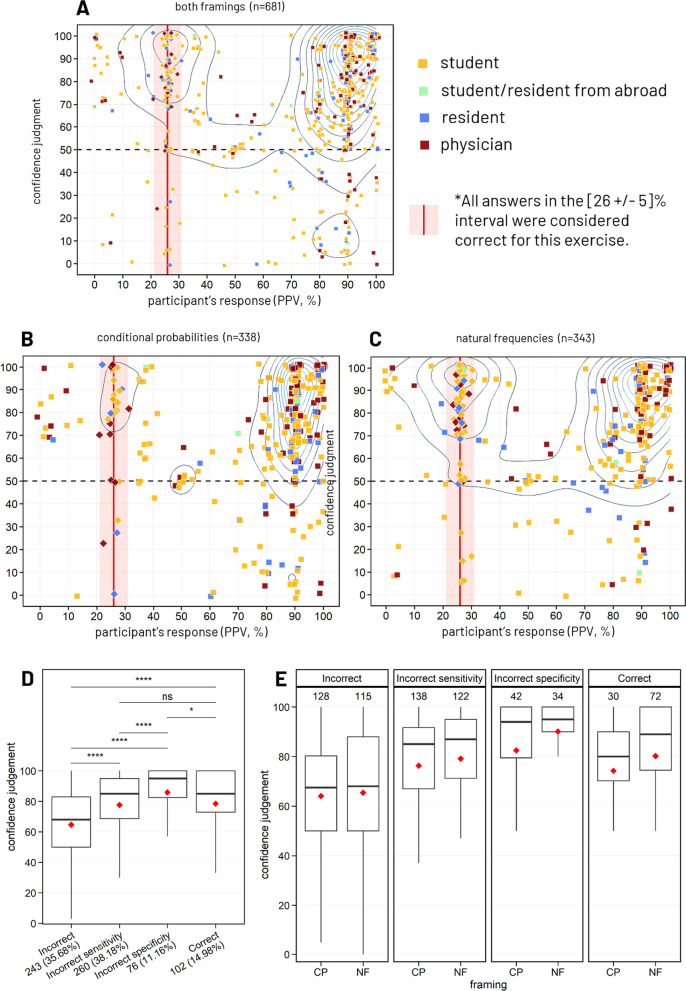
Healthcare professionals' statistical illiteracy can impair medical decision quality and compromise patient safety. Previous studies have documented clinicians' insufficient proficiency in statistics and a tendency in overconfidence. However, an underexplored aspect is clinicians' awareness of their lack of statistical knowledge that precludes any corrective intervention attempt. Here, we investigated physicians', residents' and medical students' alignment between subjective confidence judgments and objective accuracy in basic medical statistics. We also examined how gender, profile of experience and practice of research activity affect this alignment, and the influence of problem framing (conditional probabilities, CP vs. natural frequencies, NF). Eight hundred ninety-eight clinicians completed an online survey assessing skill and confidence on three topics: vaccine efficacy, p value and diagnostic test results interpretation. Results evidenced an overall consistent poor proficiency in statistics often combined with high confidence, even in incorrect answers. We also demonstrate that despite overconfidence bias, clinicians show a degree of metacognitive sensitivity, as their confidence judgments discriminate between their correct and incorrect answers. Finally, we confirm the positive impact of the more intuitive NF framing on accuracy. Together, our results pave the way for the development of teaching recommendations and pedagogical interventions such as promoting metacognition on basic knowledge and statistical reasoning as well as the use of NF to tackle statistical illiteracy in the medical context.

Keywords: Calibration; Conditional probabilities; Decision-making; Discrimination; Medical context; Metacognition; Natural frequencies; Overconfidence bias; Sensitivity; Statistical illiteracy.


Conflict of interest statement

The authors declare that they have no competing interests.

Figures

Fig. 1
Fig. 1
Experimental paradigm and measurements scales. A Study design. Exercises focusing on vaccine efficacy and p value were presented in a random order, while the exercise about test results interpretation was always the last. In this figure section, the letters B and C, respectively, refer to sections B and C from Fig. 1, each section describing the response interface used for some questions. The full survey content including sentences of context, questions as well as explanations is provided in Annex of Additional file 1. B A double-sided visual analog scale was used in exercises about vaccine efficacy and p value as well as in the five theoretical questions of the exercise about test results interpretation to collect simultaneously participants’ accuracy (side of the cursor) and confidence (distance to the center/extremity of the scale) on each claim. Instructions given to the participants To give your answer, move the slider on the scale: the more hesitant you are about your answer, the closer the slider should be placed to the middle, the more confident you are about your answer, the closer the slider should be placed to the extremity of the scale. If you don't know and you answer randomly, place the slider on the center. C The practical PPV calculation task of the exercise focused on test results interpretation used two paired visual analog scales: participants indicated their PPV estimation (ranging from 0 to 100%) by moving the first cursor on the first visual analog scale, and then reported their judgment of confidence by adjusting the width of a blue zone of uncertainty around the first value using the second cursor of the second visual analog scale (width of blue zone = 0.02 * confidence2). The lower the judgment of confidence, the more extended the blue area. Instructions given to the participants To answer, move the first slider on the scale to indicate your answer, then adjust your confidence level by moving the second slider
Fig. 2
Fig. 2
Responses to the “vaccine efficacy” exercise, N = 822. The density and box plots represent the distribution of participants’ responses for each of the 6 proposed claims. The collected data are here mapped onto a double-sided probability scale ranging from 50% (lowest confidence, the participant answered randomly) to 100% (maximal confidence judgment), both for correct (blue area) and incorrect (red area) answers. Also represented on the x-axis, the distance to the correct answer (d) is defined as a score composed both by the accuracy and confidence, ranging from 0: correct answer with maximal confidence to 100: incorrect answer with maximal confidence through 50: “I do not know”, d < 50 and d > 50, respectively, corresponding to correct and incorrect answers. Each vertical line stands for a response. The percentage of this exercise’s participants who gave a correct answer is indicated in each blue area. True claims are indicated by a green ticked box
Fig. 3
Fig. 3
Responses to the “p value” exercise, N = 794. The density and box plots represent the distribution of participants’ responses for each of the 6 proposed claims. The collected data are here mapped onto a double-sided probability scale ranging from 50% (lowest confidence, the participant answered randomly) to 100% (maximal confidence judgment), both for correct (blue area) and incorrect (red area) answers. Also represented on the x-axis, the distance to the correct answer (d) is defined as a score composed both by the accuracy and confidence, ranging from 0: correct answer with maximal confidence to 100: incorrect answer with maximal confidence through 50: “I do not know”, d < 50 and d > 50, respectively, corresponding to correct and incorrect answers. Each vertical line stands for a response. The percentage of this exercise’s participants who gave a correct answer is indicated in each blue area. True claims are indicated by a green ticked box
Fig. 4
Fig. 4
Bubble plot with regression line of the number of correct answers on the p value exercise as a function of number of correct answers on the vaccine efficacy exercise. There were six claims in each exercise. Performance correlated on the two exercises across participants (r and p indicate Pearson’s correlation coefficient and statistical significance). The red line represents the linear regression line with shaded gray area illustrating the 95% confidence interval. The circles are proportional to the number of responses in each of the cases and are for display purposes. The color intensity increases with the number of correct answers over the two exercises (from 0 in white to 12 in dark purple). All participants that completed both exercises are pooled together for this analysis (N = 756). Performance (number of correct answers out of the 6 claims) correlates between the exercises focusing on vaccine efficacy and p value
Fig. 5
Fig. 5
Confidence as a function of performance (number of correct answers) across the 12 claims of exercises on vaccine efficacy and p value (N(A) = 756, N(B) = 756). The collected data are here mapped onto a probability scale from 50 (lowest confidence, the participant answered randomly) to 100 (maximal confidence judgment). This was done by applying the transformation / 2 + 50 to the collected confidence judgments. A Confidence judgments of all claims from both exercises were averaged for each participant to indicate their global confidence. The linear plot shows the mean progression of these individual global confidence levels in function of the participants’ respective performance (number of correct answers) across the two exercises. Error bars indicate standard error of the mean (SEM). The values above each mean point indicate the number of participants with X correct answers. Global reported confidence increases more rapidly than performance across exercises on vaccine efficacy and p value. B Confidence judgments plotted separately for correct and incorrect answers as a function of performance (number of correct answers). Error bars indicate SEM over participants. Values for participants with 0 and 1 correct answers were, respectively, plotted according to 3 and 2 participants’ data points. Overall, confidence in correct answers was significantly higher than in incorrect answers for all levels of performance superior to one correct answer
Fig. 6
Fig. 6
Responses to predictive positive value calculation task, N = 681. Distribution of participants’ predictive positive value (PPV) estimation and their associated confidence judgment ranging from 0 (low confidence) to 100 (high confidence). Overall accuracy was 15% (A) and dependent on the problem framing: 9% in conditional probabilities (B) & 21% for natural frequencies (C). The red line stands for the PPV (26%); all answers included in the 26 ± 5% interval were considered correct. Density contour lines highlight the most represented answers and confidence judgments among participants. In the task instructions, sensitivity and specificity were, respectively, 90 and 99%. D Boxplots comparing the confidence judgments by response correctness. Means are indicated by a red diamond shape and the counts and percentages are given in the group labels. Post hoc comparisons using Tukey’s method (emmeans R package). ****p value < 0.0001, *p value < 0.05, NS: non-significant (p value > 0.05). (E) Boxplots representing the confidence judgments of respondents by framing and response correctness. Means are indicated by a red diamond shape and counts are given on top of the plots. Tests based on a multivariate linear regression model indicated an effect of the factors “correctness” and "framing" with no interaction effect between the two factors. Type II ANOVA (F-tests) (car R package)

Similar articles

Cited by

References

    1. Ahmed O, Walsh TN. Surgical trainee experience with open cholecystectomy and the Dunning-Kruger effect. Journal of Surgical Education. 2020;77(5):1076–1081. doi: 10.1016/j.jsurg.2020.03.025. - DOI - PubMed
    1. Altman DG, Bland JM. Diagnostic tests 1: Sensitivity and specificity. BMJ British Medical Journal. 1994;308(6943):1552. doi: 10.1136/bmj.308.6943.1552. - DOI - PMC - PubMed
    1. Altman DG, Bland JM. Statistics notes: Diagnostic tests 2: Predictive values. BMJ. 1994;309(6947):102. doi: 10.1136/bmj.309.6947.102. - DOI - PMC - PubMed
    1. Anderson BL, Gigerenzer G, Parker S, Schulkin J. Statistical literacy in obstetricians and gynecologists. Journal for Healthcare Quality. 2014;36(1):5–17. doi: 10.1111/j.1945-1474.2011.00194.x. - DOI - PubMed
    1. Baden LR, El Sahly HM, Essink B, Kotloff K, Frey S, Novak R, Diemert D, Spector S, Nadine Rouphael C, Creech B, McGettigan J, Khetan S, Segall N, Solis J, Brosz A, Fierro C, Schwartz H, Neuzil K, Corey L, Gilbert P, Janes H, Follmann D, Marovich M, Mascola J, Polakowski L, Ledgerwood J, Graham BS, Bennett H, Pajon R, Knightly C, Leav B, Deng W, Zhou H, Han S, Ivarsson M, Miller J, Zaks T. Efficacy and safety of the mRNA-1273 SARS-CoV-2 vaccine. New England Journal of Medicine. 2021;384(5):403–416. doi: 10.1056/NEJMoa2035389. - DOI - PMC - PubMed

Publication types

LinkOut - more resources