. 2023 May;26(5):788-797.
doi: 10.1038/s41593-023-01306-7. Epub 2023 Apr 20.

Inhibitory control of sharp-wave ripple duration during learning in hippocampal recurrent networks

Affiliations

Inhibitory control of sharp-wave ripple duration during learning in hippocampal recurrent networks

Bert Vancura et al. Nat Neurosci. 2023 May.

Abstract

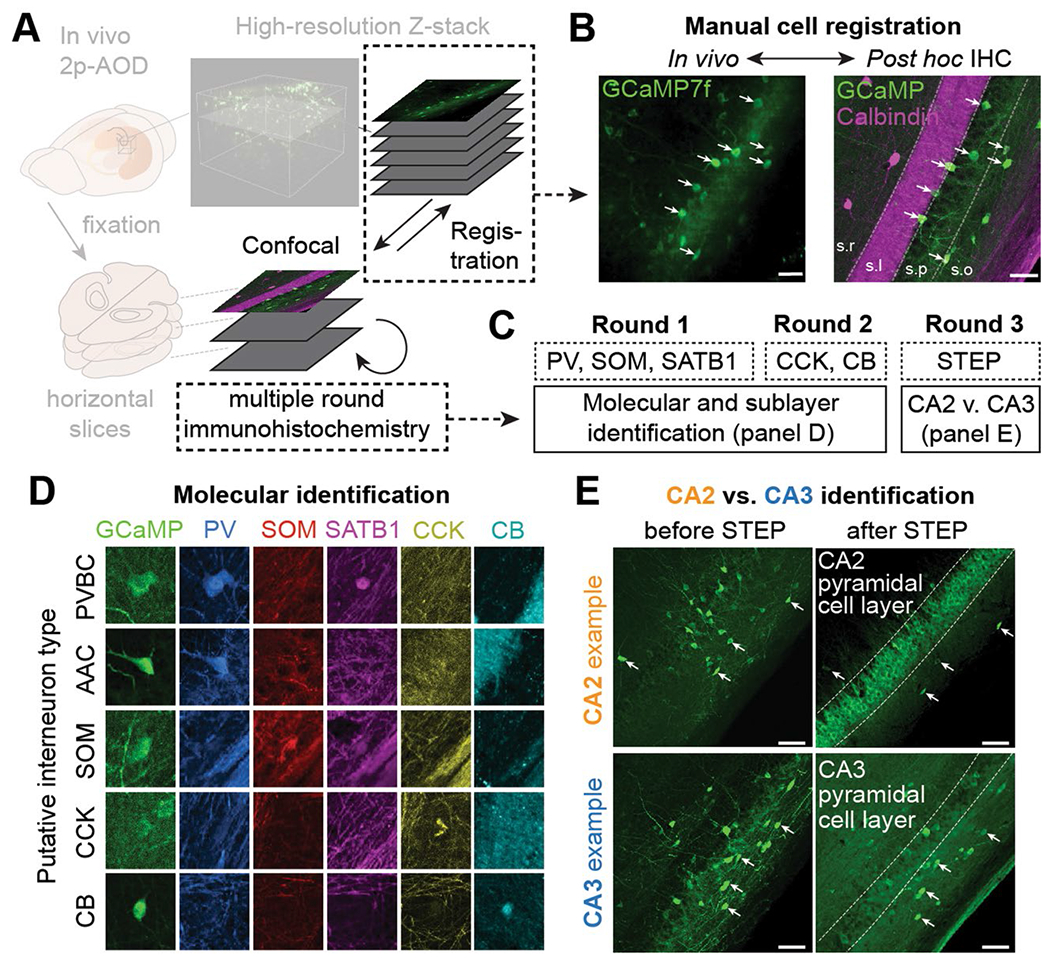
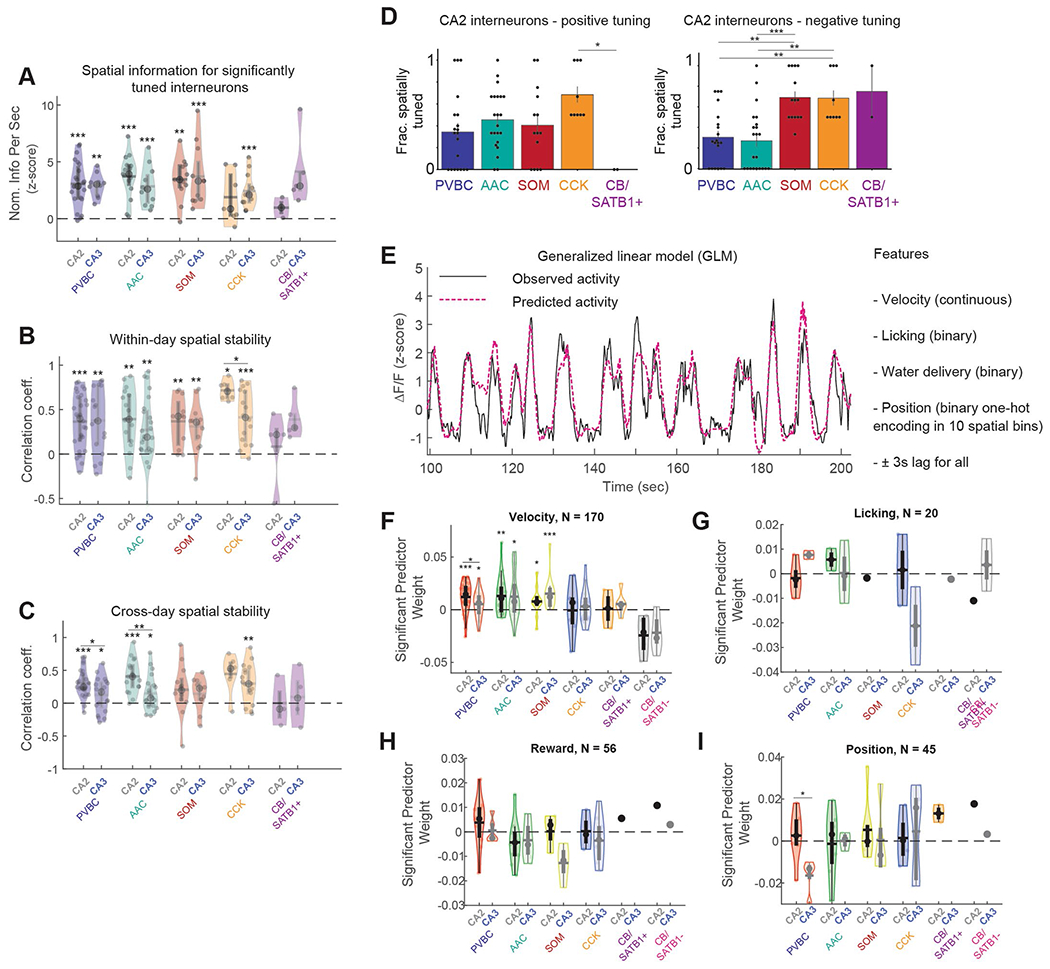
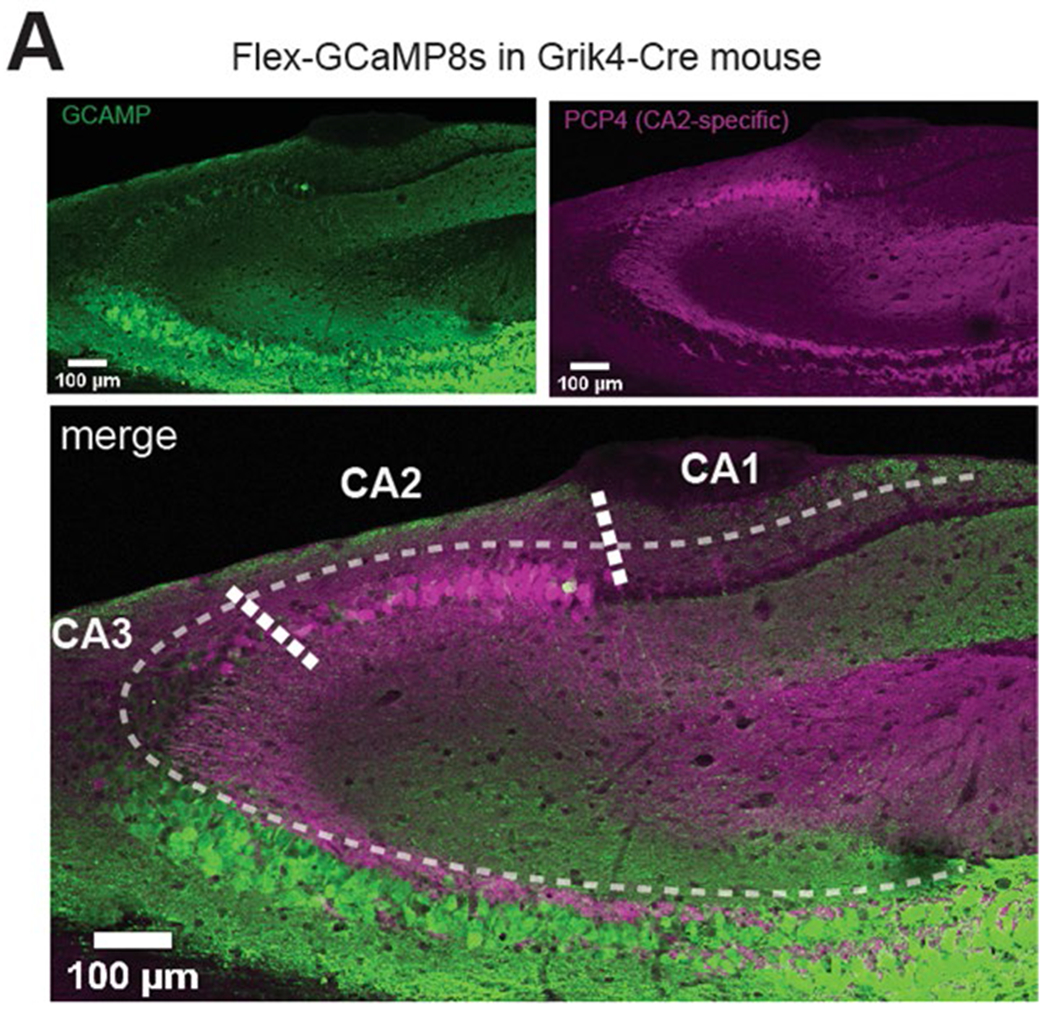
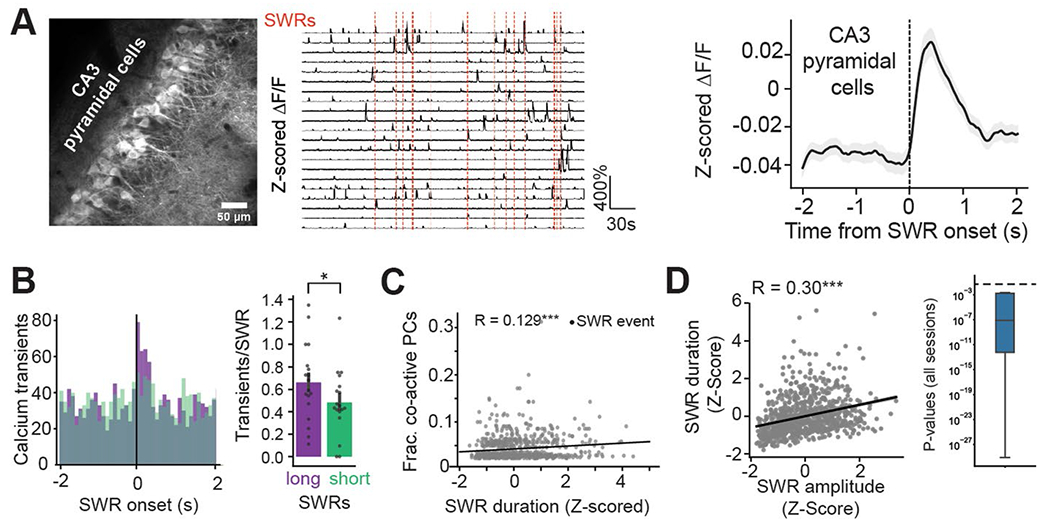
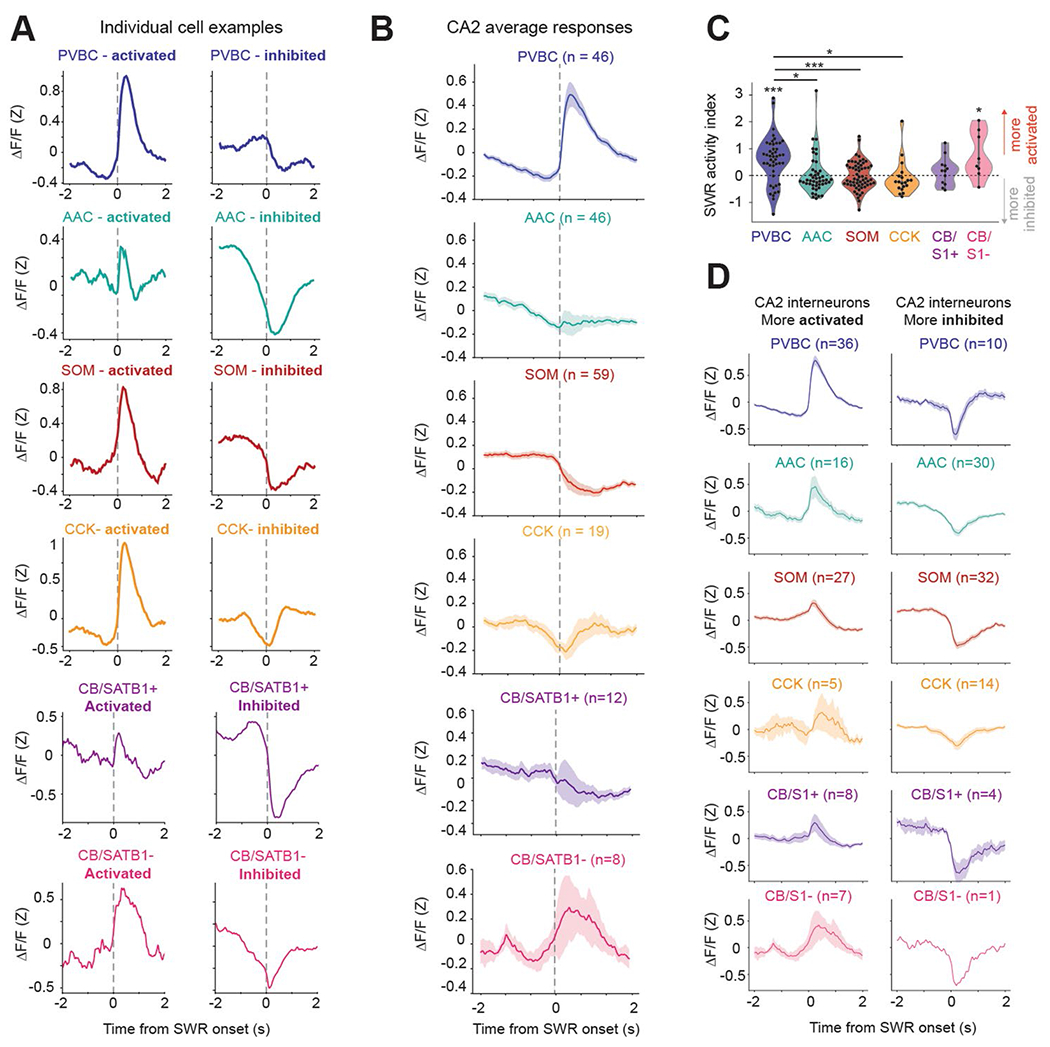
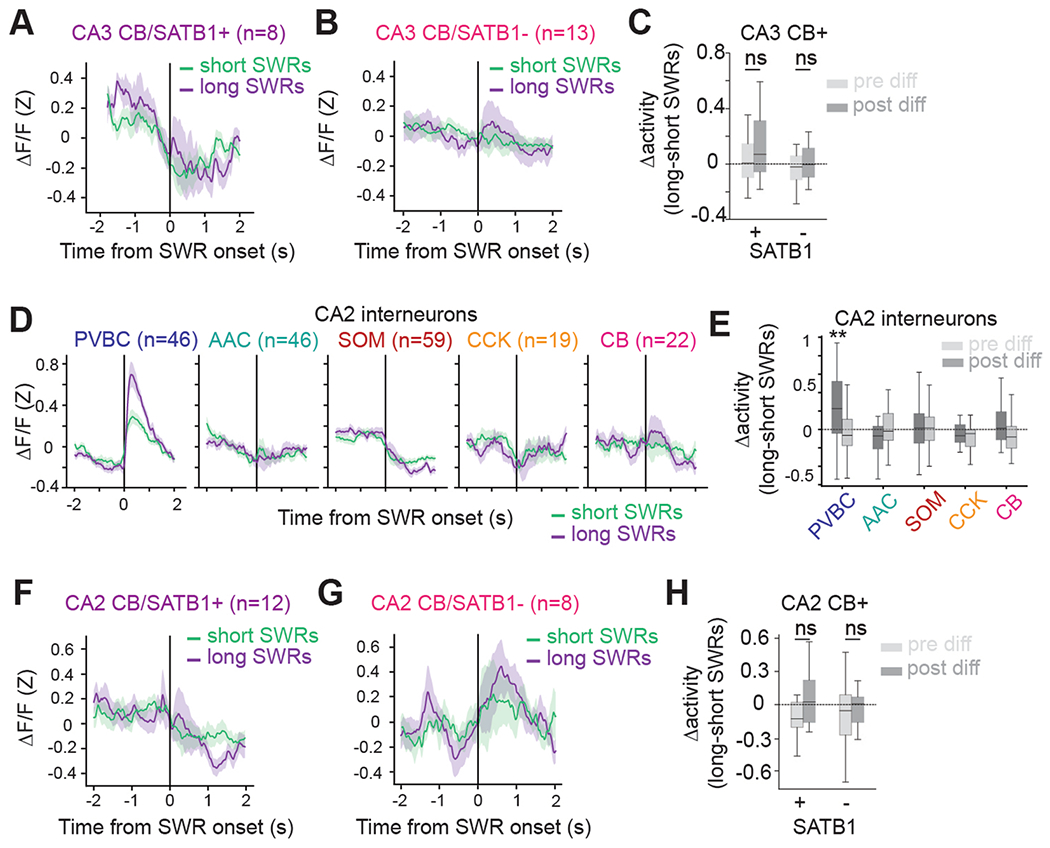
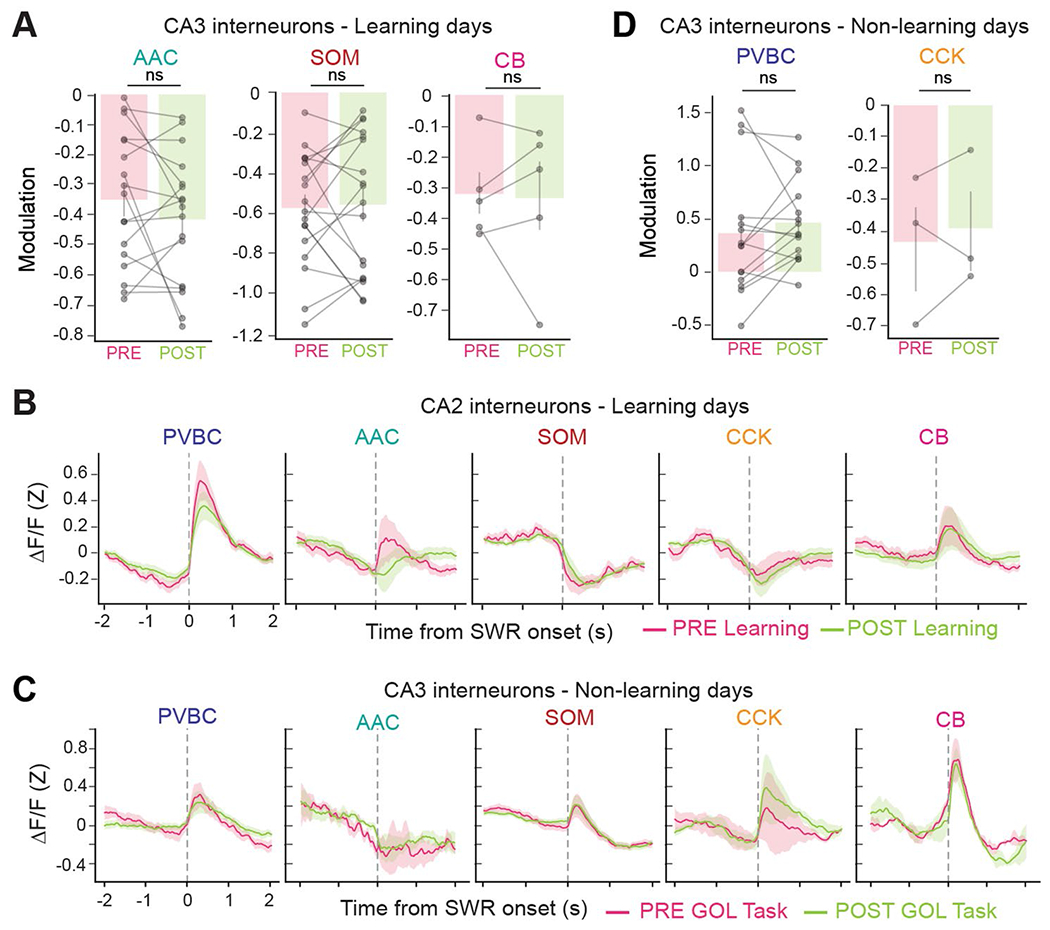
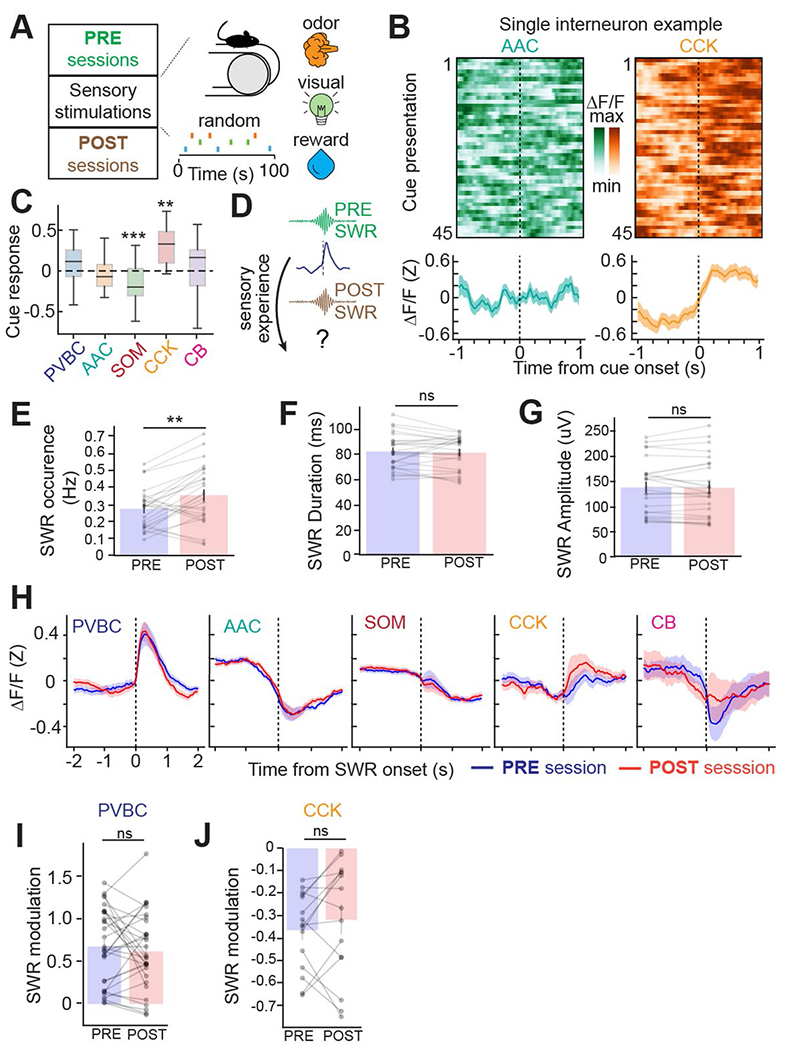
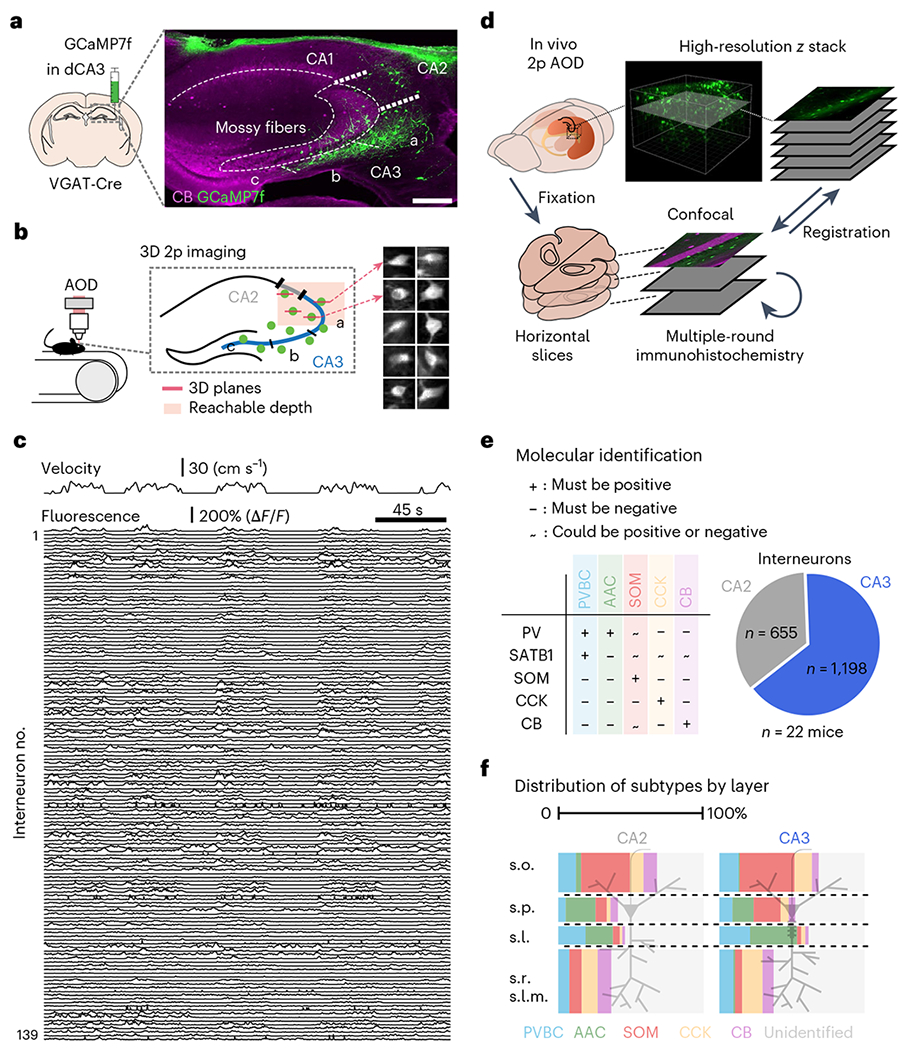
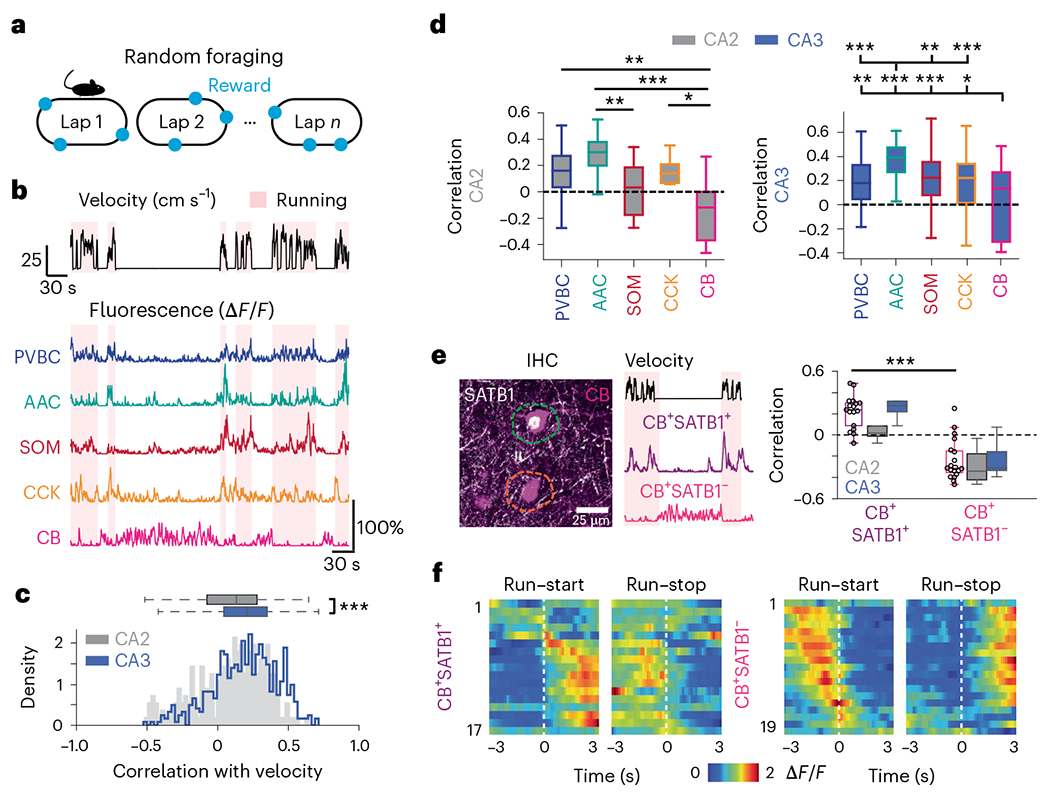
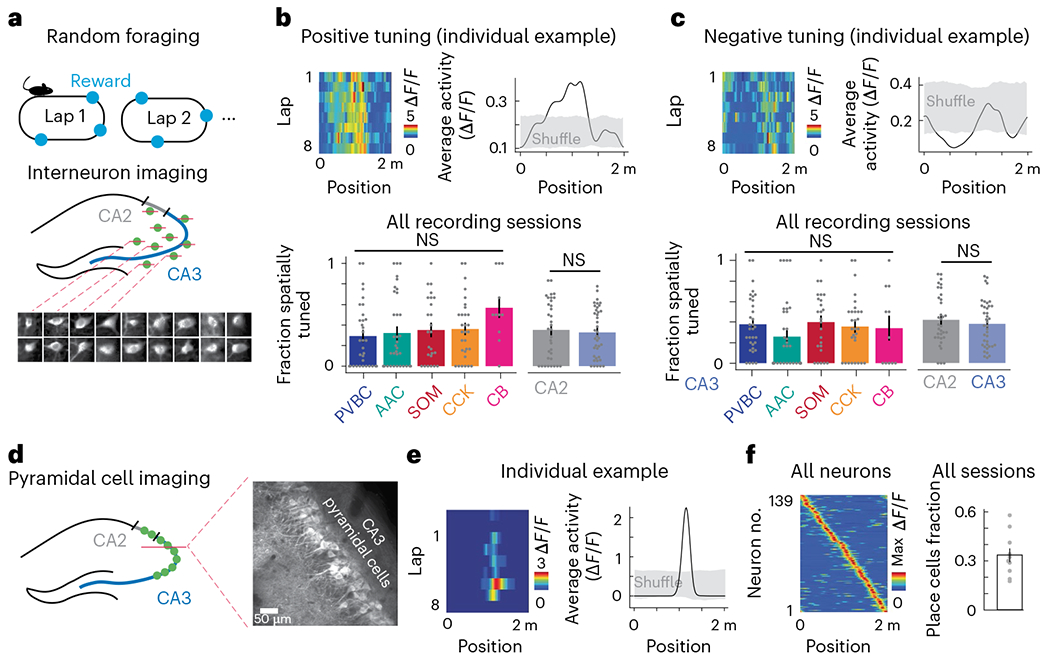
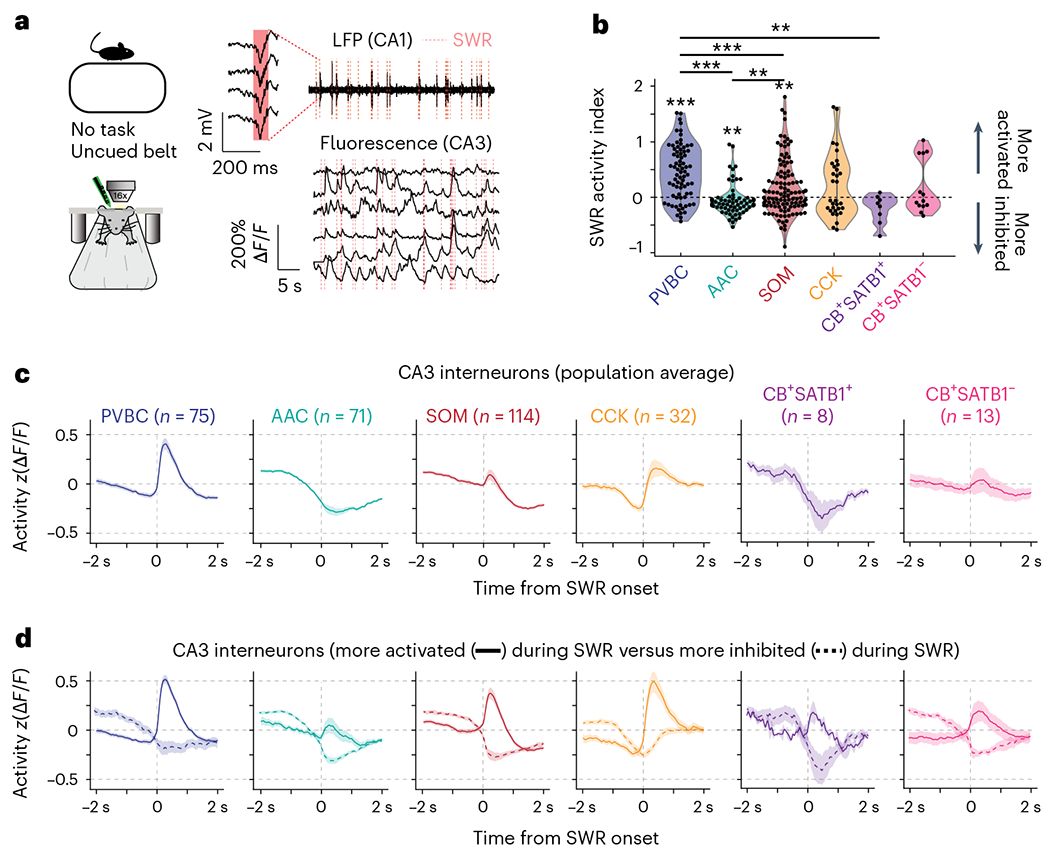
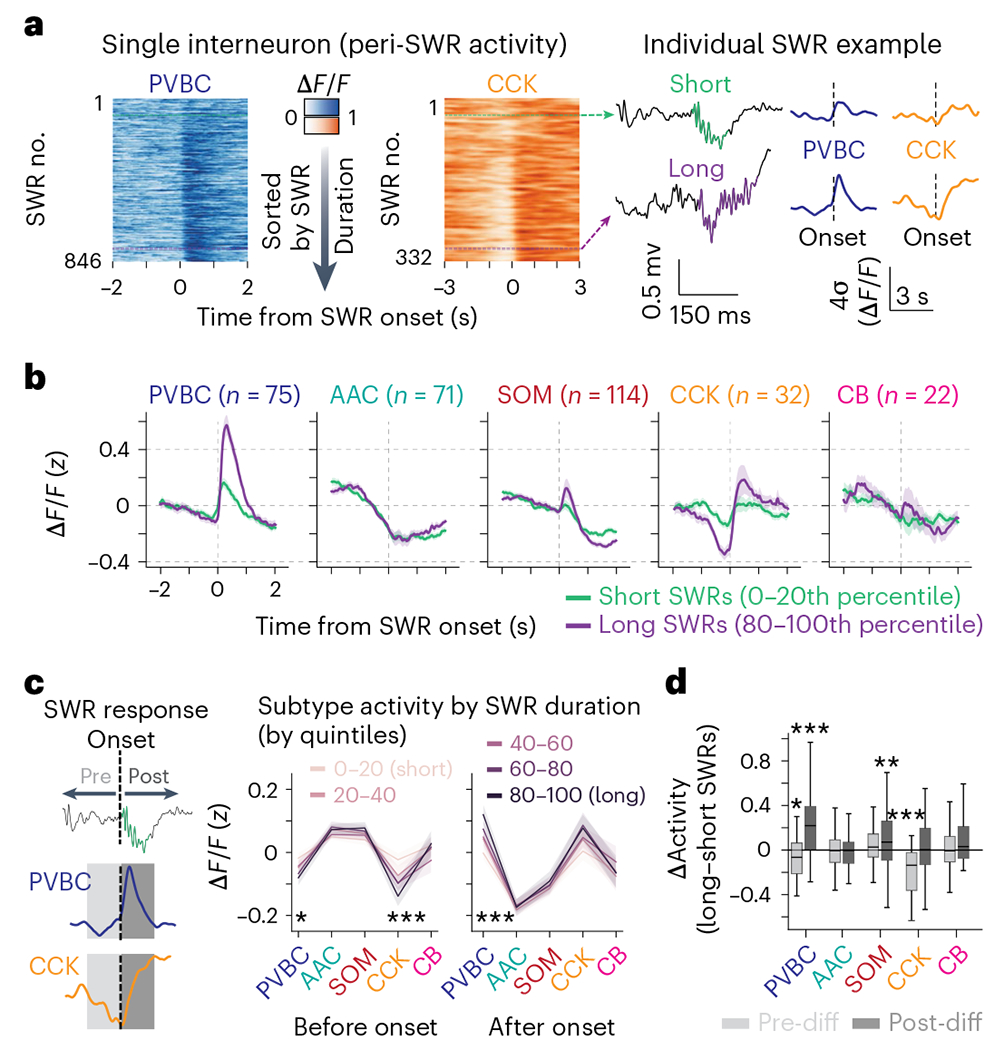
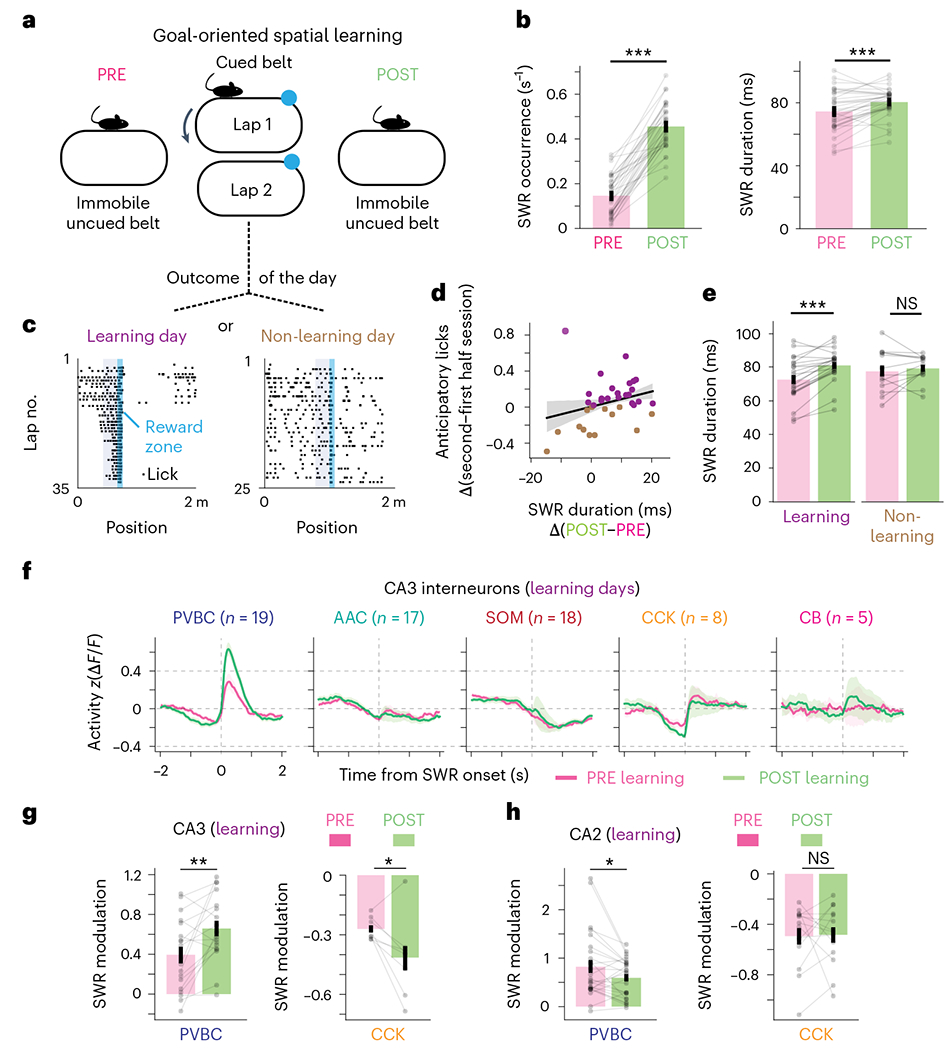
Recurrent excitatory connections in hippocampal regions CA3 and CA2 are thought to play a key role in the generation of sharp-wave ripples (SWRs), electrophysiological oscillations tightly linked with learning and memory consolidation. However, it remains unknown how defined populations of inhibitory interneurons regulate these events during behavior. Here, we use large-scale, three-dimensional calcium imaging and retrospective molecular identification in the mouse hippocampus to characterize molecularly identified CA3 and CA2 interneuron activity during SWR-associated memory consolidation and spatial navigation. We describe subtype- and region-specific responses during behaviorally distinct brain states and find that SWRs are preceded by decreased cholecystokinin-expressing interneuron activity and followed by increased parvalbumin-expressing basket cell activity. The magnitude of these dynamics correlates with both SWR duration and behavior during hippocampal-dependent learning. Together these results assign subtype- and region-specific roles for inhibitory circuits in coordinating operations and learning-related plasticity in hippocampal recurrent circuits.


Conflict of interest statement

Competing interests

The authors declare no competing interests.

Figures

Extended Data Fig. 1 |
Extended Data Fig. 1 |. Immunohistochemical identification of interneuron subtypes and separation of CA2 and CA3 interneurons with anti-STEP immunohistochemistry.
(a) Schematic of the experimental pipeline used to determine the molecular identity of imaged cells. Multiple rounds of immunohistochemistry were performed on fixed, horizontal slices that were registered to high-resolution in vivo Z-stacks. (b) Example in vivo 2p-AOD image (left) and confocal image (right) of the registered FOV. White arrows indicate the registered cells. Calbindin immunohistochemistry was used to label the mossy fibers of stratum lucidum of CA3/CA2. This procedure was repeated in n = 22 imaged mice. Scale bars on the left and right images represent 50 and 100 μm, respectively. (c) Example labeling strategy used to determine the subtype and region identity of imaged cells. Immunohistochemical labels were not removed between the different rounds (see Methods). (d) Example immunohistochemical labeling and combinatorial expression patterns of the 5 markers (PV, SOM, SATB1, CCK, CB) used to separate imaged cells into subtypes. This procedure was repeated in n = 22 imaged mice. All images are approximately 60 × 60 μm. (e) CA2 interneurons were identified by their proximity to STEP-expressing CA2 pyramidal cells (top row). In comparison, CA3 interneurons occupied slices where Calbindin-positive mossy fibers were present but where the majority of pyramidal cells were not STEP-expressing (bottom row). This procedure was repeated in n = 22 imaged mice. Scale bars on all four images represent approximately 100 μm.
Extended Data Fig. 2 |
Extended Data Fig. 2 |. Molecular profiling of calbindin-positive SATB1-negative immobility-active interneurons.
(a) Confocal micrograph of CB-expressing interneurons, negative for SATB1 but positive for COUP-TFII (top) and M2R (bottom). This staining was repeated in n = 2 mice. Scale bars represent 20 μm. (b) Quantification of the overlap of CB-expressing interneurons split by immunoreactivity to SATB1 with other markers.
Extended Data Fig. 3 |
Extended Data Fig. 3 |. Additional data on interneuron spatial selectivity and generalized-linear model of interneuron activity during spatial navigation.
(a) Spatial information for significantly tuned Interneurons, broken down by both region and subtype. Immobility-active CB/SATB1− neurons were silenced during locomotion and were thus not considered in this analysis. Data from 188 cells in n = 9 mice. Significance values over individual violin plots show the results of (one-way) signed-rank tests. (b) Within-day spatial stability of all interneurons, broken down by both region and subtype. Plotted as in A. Significance values over individual violin plots show the results of (one-way) signed-rank tests. Significance values over pairs of violin plots show results from (two-way) ranked-sum tests (only significant differences are shown). Data from 152 cells in n = 9 mice. (c) Across-day spatial stability of all interneurons, broken down by both region and subtype. Plotted as in A. Significance values over individual violin plots show the results of (one-way) signed-rank tests. Significance values over pairs of violin plots show results from (two-way) ranked-sum tests (only significant differences are shown). Data from 142 cells in n = 9 mice. (d) Left: Summary of the fraction of positively tuned CA2 interneurons, broken down by subtype (PVBC: 0.343 ± 0.341, AAC: 0.455 ± 0.267, SOM: 0.405 ± 0.339, CCK: 0.685 ± 0.228, CB/SATB1 + : 0.0 ± 0.0). CA2 CCK cells were more likely to be positively spatially tuned cells than CA2 CB/SATB1+ cells (one-way ANOVA with post-hoc multiple testing correction, p = 0.048). Immobility-active CB/SATB1− neurons were silenced during locomotion and were thus not considered in this analysis. Each data point represents an imaging session. PVBC data from 20 imaging sessions, AAC data from 22 sessions, SOM data from 14 sessions, CCK data from 9 sessions, and CB/SATB1 + data from 2 sessions; data from n = 9 mice. Data reported as mean ± s.d. Right: Same data as on the left, but for negatively tuned CA2 interneurons (PVBC: 0.304 ± 0.261, AAC: 0.270 ± 0.293, SOM: 0.690 ± 0.226, CCK: 0.685 ± 0.228, CB/SATB1 + : 0.75 ± 0.25). Significant differences in the fraction of negatively tuned CA2 interneurons by subtype are indicated (one-way ANOVA with post-hoc multiple testing correction: p(CCK-PVBC) = 0.0075, p(CCK-AAC) = 0.0024, p(SOM-PVBC) = 0.0012, p(SOM-AAC) = 0.001). Immobility-active CB/SATB1− neurons were silenced during locomotion and were thus not considered in this analysis. Each data point represents an imaging session. PVBC data from 20 imaging sessions, AAC data from 22 sessions, SOM data from 14 sessions, CCK data from 9 sessions, and CB/SATB1 + data from 2 sessions; data from n = 9 mice. Data reported as mean ± s.d. (e) Example of 100 seconds of real interneuron activity during locomotion and the predicted activity from a GLM. The predicted activity for each cell was calculated based on 4 predictor behavioral variables: velocity, position, licking, and water delivery (see Methods). (f) Comparison of the GLM weights for each cell for the velocity predictor, separated by both subtype and region. Only cells for which the velocity predictor in the model was a significant predictor are shown. Significance values over individual violin plots show the results of (oneway) signed-rank tests. Significance values over pairs of violin plots show results from (two-way) ranked-sum tests. Only significant differences are shown. Data from 170 cells from n = 9 mice. (g) Same data as shown in F, but now for the licking predictor. Only cells for which the licking predictor in the model was significant are shown. No significance at the subtype or region level was found. Data from 20 cells in n = 9 mice. (h) Same data as shown in F, but now for the reward predictor. Only cells for which the reward predictor in the model was significant are shown. No significance at the subtype or region level was found. Data from 56 cells from n = 9 mice. (i) Same data as shown in F, now for the position predictor. Only cells for which the position predictor in the model was significant are shown. Significance values over pairs of violin plots show results from (two-way) ranked-sum tests. Only significant differences are shown. Data from 45 cells from n = 9 mice.
Extended Data Fig. 4 |
Extended Data Fig. 4 |. Immunohistochemical verification of Grik4-Cre transgenic line.
(a) Top left: Confocal image of FLEX-GCaMP8s expression when injected into CA3/CA2 of the Grik4-Cre transgenic line. Top right: CA2 pyramidal cells identified by their PCP4 immunosignal. Bottom: Merge of the above images. Note that GCaMP expression is largely confined to CA3 in the Grik4-Cre line, although some GCaMP8s-positive pyramidal cells in CA2 can be seen as well. This staining was repeated in n = 3 mice.
Extended Data Fig. 5 |
Extended Data Fig. 5 |. CA3 pyramidal cell dynamics around SWRs and correlations between SWR properties.
(a) Left: Representative in vivo two-photon time-average image of a CA3PC FOV. Center: Example CA3PC ΔF/F traces with detected SWRs depicted as vertical red lines. Right: Peri-SWR fluorescence for the entire CA3PC population, averaged over all SWR events. Data from n = 3 mice. Trace represents mean ± s.e.m. (b) Left: Distribution of peri-SWR CA3PC calcium transients for SWRs with short duration (green, taken as SWRs with duration falling between 0–20th percentile of all SWRs for a given mouse) and long duration (purple, for SWRs falling between the 80–100th duration percentile). Right: Quantification of the population transient rate for long- and short-duration SWRs. CA3PCs emitted significantly more transients during long-duration SWRs than during short-duration SWRs (Short duration SWRs: 0.483 ± 0.285 transients/SWR, Long duration SWRs: 0.661 ± 0.331 transients/SWR, two-sided Wilcoxon signed-rank test: p = 0.011). Data from 18 sessions from n = 3 mice. Data reported as mean ± s.d. (c) Correlation between SWR duration and the number of co-active pyramidal cells around the SWR. Each dot represents a SWR event. Long-duration SWRs were associated with greater fractions of co-active CA3PCs around the SWR event (linear regression, r = 0.129, p = 2.50 × 10⁻⁴). Only SWRs associated with at least 1 transient in the CA3PC FOV are considered. Data from n = 3 mice. (d) Correlation between amplitude and duration for individual SWRs. Left: Example scatter plot and linear regression line depicting the relationship between amplitude and duration for all SWRs recorded during the imaging of one example interneuron. Right: Distribution of p-values for the two-sided regression between amplitude and duration, calculated over all imaging sessions. The horizontal dashed line corresponds to a p-value of 0.05. A strong relationship between SWR amplitude and duration was present in all imaging sessions. Data from n = 13 mice. * p < 0.05, ** p <0.01, *** p < 0.001.
Extended Data Fig. 6 |
Extended Data Fig. 6 |. Additional data on CA3 and CA2 interneuron dynamics around SWRs.
(a) Example Z-scored peri-SWR traces for both activated and inhibited cells of each subtype. (b) Average peri-SWR traces for all CA2 interneuron subtypes (n = 46 PVBCs, 46 AACs, 59 SOMs, 19 CCKs, 12 CB/SATB1 + neurons, and 8 CB/SATB1− neurons from n = 13 mice). Traces for each subtype represent mean ± s.e.m. (c) Average SWR activity index for all CA2 interneurons, grouped by subtype. Wilcoxon signed-rank tests against a median of 0 were performed for each subtype (PVBC: 0.56 ± 0.83, p = 1 × 10⁻⁵, AAC:0.03 ± 0.65, p = 0.18; SOM: −0.002 ± 0.5, p = 0.96; CCK: −0.08 ± 0.61, p = 0.12; CB/SATB1 + : 0.17 ± 0.5, p = 0.43; CB/SATB1−: 0.77 ± 0.82, p = 0.04). Between-subtype statistical comparisons were performed using the Kruskal-Wallis test (p = 9 × 10⁻⁵) with post-hoc Wilcoxon rank sum tests with p-values adjusted using the Bonferroni correction (significant adjusted p-values: PVBC-AAC = 0.038, PVBC-CCK = 0.016, PVBC-SOM = 0.0004). Data from n = 46 PVBCs, 46 AACs, 59 SOMs, 19 CCKs, 12 CB/SATB1 +, and 8 CB/SATB1− from n = 13 mice. Data reported as mean ± s.d. (d) Left: Average peri-SWR traces for all activated CA2 interneurons, grouped by subtype. Right: Same traces for all inhibited CA2 interneurons, grouped by subtype. Cell numbers for each subtype and condition indicated on the figure, data from n = 13 mice. Traces for each subtype represent mean ± s.e.m. * p < 0.05, ** p < 0.01, *** p < 0.001.
Extended Data Fig. 7 |
Extended Data Fig. 7 |. Dynamics of CA3 CB subtypes and all CA2 interneuron subtypes around short- and long-duration SWRs.
(a) Average Z-scored peri-SWR traces for both short- (0–20th percentile) and long- (80–100th percentile) duration SWRs for CA3 CB/SATB1 + interneurons (n = 8 CB/SATB1+ cells from n = 13 mice). Traces for each condition represent mean ± s.e.m. (b) Average Z-scored peri-SWR traces for both short- (0–20th percentile) and long- (80–100th percentile) duration SWRs for CA3 CB/SATB1− interneurons (n = 13 CB/SATB1− cells from n = 13 mice). Traces for each condition represent mean ± s.e.m. (c) Average value of the difference in activity between long- and short-duration SWRs for CA3 CB+/SATB1+ and CB+/SATB1− subtypes, considered separately for the pre-SWR and post-SWR activity. Neither CB+/SATB1+ nor CB+/SATB1− interneurons responded differently during long-duration compared to short-duration SWRs (two-way, one-sample t-tests against 0 for each subtype and condition: CB+/SATB1+ PRE: 0.028 ± 0.176, p = 0.69; CB+/SATB1+ POST: 0.124 ± 0.251, p = 0.23; CB+/SATB1−PRE: −0.047 ± 0.150, p = 0.30; CB+/SATB1−POST: 0.056 ± 0.239, p = 0.43). Data from 8 CB+/SATB1+ and 13 CB+/SATB1− cells from n = 13 mice. Data reported as mean ± s.d. (d) Average Z-scored peri-SWR traces for both short- (0–20th percentile) and long- (80–100th percentile) duration SWRs for CA2 interneurons of each subtype (n = 46 PVBCs, 46 AACs, 59 SOMs, 19 CCKs, and 22 CBs from n = 13 mice). CB+/SATB1+ and CB+/SATB1− neurons are considered together in the CB subtype. Traces for each subtype and condition represent mean ± s.e.m. (e) Average value of the difference in activity between long- and short-duration SWRs for each CA2 interneuron, considered separately for the pre-SWR and post-SWR activity, and grouped by subtype. PVBCs were significantly more activated after long-duration SWRs, while the other subtypes did not show different dynamics during short-compared to long-duration SWRs. Only significant differences are indicated (two-way, one-sample t-tests against 0 for each subtype with Bonferroni correction for multiple testing: PVBC PRE: −0.044 ± 0.264, p = 1.0; PVBC POST: 0.267 ± 0.464, p = 0.0037; AAC PRE: 0.024 ± 0.250, p = 1.0; AAC POST: −0.053 ± 0.322, p = 1.0; SOM PRE: 0.054 ± 0.389, p = 1.0; SOM POST: 0.042 ± 0.340, p = 1.0; CCK PRE: −0.116 ± 0.252, p = 0.70; CCK POST: −0.036 ± 0.360, p = 1.0; CB PRE: −0.050 ± 0.351, p = 1.0; CB POST: 0.103 ± 0.328, p = 1.0). Data from n = 46 PVBCs, 46 AACs, 59 SOMs, 19 CCKs, and 22 CBs from n = 13 mice. CB+/SATB1+ and CB+/SATB1− neurons are considered together in the CB subtype. Data reported as mean ± s.d. (f) Average Z-scored peri-SWR traces for both short- (0–20th percentile) and long- (80–100th percentile) duration SWRs for CA2 CB+/SATB1+ interneurons (n = 12 CB+/SATB1+ cells from n = 13 mice). Traces for each condition represent mean ± s.e.m. (g) Average Z-scored peri-SWR traces for both short- (0–20th percentile) and long- (80–100th percentile) duration SWRs for CA2 CB/SATB1− interneurons (n = 8 CB+/SATB1− cells from n = 13 mice). Traces for each condition represent mean ± s.e.m. (h) Average value of the difference in activity between long- and short-duration SWRs for CA2 CB+/SATB1+ and CB+/SATB1− subtypes, considered separately for the pre-SWR and post-SWR activity. Neither CB+/SATB1+ nor CB+/SATB1− interneurons responded differently during long-duration compared to short-duration SWRs (two-way, one-sample t-tests against 0 for each subtype and condition: CB+/SATB1+ PRE: −0.034 ± 0.373, p = 0.77; CB+/SATB1+ POST: 0.068 ± 0.263, p = 0.41; CB+/SATB1− PRE: −0.078 ± 0.333, p = 0.56; CB+/SATB1− POST: 0.058 ± 0.374, p = 0.69). Data from 12 CB+/SATB1+ and 8 CB+/SATB1− cells from n = 13 mice. Data reported as mean ± s.d. * p < 0.05, ** p < 0.01, *** p < 0.001.
Extended Data Fig. 8 |
Extended Data Fig. 8 |. Additional data on learning-related CA3/CA2 interneuron dynamics during the GOL task.
(a) Quantification of the peri-SWR modulation for CA3 AACs, SOMs, and CBs during PRE and POST sessions on Learning Days. None of these three subtypes significantly changed their activity around SWRs after learning (AAC PRE: −0.350 ± 0.217, AAC POST: −0.416 ± 0.211, two-sided Wilcoxon signed-rank test: p = 0.33; SOM PRE: −0.571 ± 0.275, SOM POST: −0.555 ± 0.334, two-sided Wilcoxon signed-rank test: p = 0.68; CB PRE: −0.322 ± 0.135, CB POST: −0.335 ± 0.227, two-sided Wilcoxon signed-rank test: p = 0.69). Data from n = 17 AACs, 18 SOMs, and 5 CBs from n = 8 mice. CB+/SATB1+ and CB/SATB1− neurons are considered together in the CB subtype. Data reported as mean ± s.d. (b) Average Z-scored peri-SWR traces for both PRE and POST sessions for all CA2 subtypes on Learning Days. Data from 27 PRE and 26 POST PVBCs, 21 PRE and 19 POST AACs, 27 PRE and 27 POST SOMs, 14 PRE and 14 POST CCKs, and 18 PRE and 16 POST CBs from n = 8 mice. CB/SATB1+ and CB/SATB1− neurons are considered together in the CB subtype. Traces for each subtype and condition represent mean ± s.e.m. (c) Average Z-scored peri-SWR traces for both PRE and POST sessions for all CA3 subtypes on Non-Learning Days. Data from 15 PRE and 16 POST PVBCs, 4 PRE and 4 POST AACs, 26 PRE and 25 POST SOMs, 4 PRE and 4 POST CCKs, and 2 PRE and 2 POST CBs from n = 8 mice. CB/SATB1+ and CB/SATB1− neurons are considered together in the CB subtype. Traces for each subtype and condition represent mean ± s.e.m. (d) Quantification of the change in peri-SWR modulation for CA3 PVBCs and CCKs between PRE and POST sessions on Non-Learning Days. Neither subtype changed its activity significantly after the GOL task (PVBC PRE: 0.360 ± 0.581, PVBC POST: 0.460 ± 0.370, two-sided Wilcoxon signed-rank test: p = 0.39; CCK PRE: −0.433 ± 0.195, CCK POST: −0.390 ± 0.177, two-sided Wilcoxon signed-rank test: p = 0.59; data from n = 15 PVBCs and 3 CCKs from n = 8 mice). Data reported as mean ± s.d. * p < 0.05, ** p <0.01, *** p < 0.001.
Extended Data Fig. 9 |
Extended Data Fig. 9 |. CA3 interneuron dynamics during the random cue task.
(a) Sensory stimulation paradigm. Water, light, and odor stimuli were presented pseudorandomly while the mouse remained head-fixed on a cue-less, burlap belt. Interneurons were imaged during SWRs in both the PRE and POST sessions as well as during stimulus presentations. (b) Representative example of an individual AAC (green) and CCK (orange) interneuron. Heatmaps represent the activity during all sensory stimulus presentations (45 in total) with the corresponding average response (bottom). The CCK neuron is consistently and significantly activated by cue presentations. The traces are plotted as the mean ± s.e.m. (c) Average sensory cue response for each cell, grouped by subtype (PVBC response: 0.078 ± 0.231, AAC: −0.032 ± 0.208, SOM: −0.145 ± 0.215, CCK: 0.328 ± 0.252, CB: 0.038 ± 0.349). CCK cells were significantly activated by cue presentation, while SOM cells were significantly inhibited (two-way, one-sample t-tests against 0 for each subtype: PVBC: p = 0.12; AAC: p = 0.41; SOM: p = 4.17 × 10⁻⁴; CCK: p = 0.0021; CB: p = 0.73). Data from n = 24 PVBCs, 31 AACs, 35 SOMs, 11 CCKs, and 12 CBs from n = 3 mice. CB+/SATB1+ and CB+/SATB1− neurons are considered together in the CB subtype. All reported cells are from CA3; CA2 data not reported. Data reported as mean ± s.d. (d) Sessions PRE and POST cue presentations are split to examine whether sensory cue presentations induced a change in interneuron dynamics around SWRs. (e) Quantification of the average SWR occurrence rate for PRE and POST sessions. The occurrence rate increased significantly from PRE to POST (occurrence PRE: 0.273 ± 0.115 s-1, occurrence POST: 0.354 ± 0.169 s-1, two-sided Wilcoxon signed-rank test: p = 0.0024). Data from n = 26 PRE sessions and 26 POST sessions from n = 5 mice. Data reported as mean ± s.d. (f) Quantification of the average SWR duration for PRE and POST sessions. The SWR duration did not change between PRE and POST sessions (duration PRE: 82.7 ± 13.6 ms, POST: 81.8 ± 13.0 ms, two-sided Wilcoxon signed-rank test: p = 0.28). Data from n = 26 PRE sessions and 26 POST sessions from n = 5 mice. Data reported as mean ± s.d. (g) Quantification of the average SWR maximum amplitude for PRE and POST sessions. The amplitude did not change between PRE and POST sessions (amplitude PRE: 137.3 ± 52.3 μV, POST: 136.6 ± 57.3 μV, two-sided Wilcoxon signed-rank test: p = 0.66). Data from n = 26 PRE sessions and 26 POST sessions from n = 5 mice. Data reported as mean ± s.d. (h) Average Z-scored peri-SWR traces for both PRE and POST sessions for all subtypes. Data from 31 PRE and 32 POST PVBCs, 37 PRE and 34 POST AACs, 49 PRE and 51 POST SOMs, 14 PRE and 15 POST CCKs, and 7 PRE and 7 POST CBs from n = 5 mice. CB+/SATB1+ and CB+/SATB1− neurons are considered together in the CB subtype. All reported cells are from CA3; CA2 data are not reported. Traces for each subtype and condition represent mean ± s.e.m. (i) Quantification of the change in SWR modulation for CA3 PVBCs between PRE and POST sessions. PVBCs did not become more activated around SWRs in response to the sensory stimulation task (PVBC PRE: 0.67 ± 0.44, PVBC POST: 0.62 ± 0.44, two-sided Wilcoxon signed-rank test: p = 0.64; data from n = 31 PVBCs from n = 5 mice). Data reported as mean ± s.d. (j) Quantification of the change in SWR modulation for CA3 CCKs between PRE and POST sessions. CCKs did not become more inhibited around SWRs in response to the sensory stimulation task (CCK PRE: −0.36 ± 0.17, CCK POST: −0.32 ± 0.25, two-sided Wilcoxon signed-rank test: p = 0.23). Data from n = 15 CCKs from n = 5 mice. Data reported as mean ± s.d. * p < 0.05, ** p <0.01, ***p < 0.001.
Fig. 1 |
Fig. 1 |. Large-scale imaging of molecularly identified GABAergic interneurons in CA3 and CA2.
a, Experimental design. VGAT-Cre mice were Injected in CA2/CA3 with a Cre-dependent GCaMP7f virus to record all inhibitory interneurons with 2p imaging (n = 22 mice); scale bar, 250 μm; dCA3, dorsal CA3. b, Hundreds of interneurons can be recorded simultaneously at 5–10 Hz in three dimensions during behavior. Right, time average examples of ten interneurons. The images are 50 × 50 μm. c, Example fluorescence traces from 139 simultaneously recorded interneurons during several minutes of behavior (animal velocity is plotted above). d, Schematic of the experimental pipeline used to determine the molecular identity of imaged cells. Multiple rounds of immunohistochemistry were performed on fixed, horizontal slices that were registered to high-resolution in vivo Z-stacks. e, Left, combinatorial expression patterns of the five markers (PV, SOM, SATB1, CCK and CB) used to separate imaged cells into subtypes. Right, pie chart summary of the dataset. f, Layer distributions of all imaged and post hoc identified interneurons split by both region and subtype. s.o., stratum oriens; s.p., stratum pyramidale; s.l., stratum lucidum; s.r., stratum radiatum; s.l.m., stratum lacunosum-moleculare.
Fig. 2 |
Fig. 2 |. Locomotion-related dynamics during spatial navigation.
a, Mice were trained to run for randomly delivered water rewards on each lap. b, Representative fluorescence traces from different interneuron subtypes during running (red-shaded area) and immobility (non-shaded) bouts. c, Distribution of Pearson correlation coefficients between fluorescence and velocity for all recorded interneurons broken down by CA3 and CA2 regions. The activity of CA3 cells was significantly more correlated with velocity than the activity of CA2 cells (CA2 correlation: 0.092 ± 0.247; CA3 correlation: 0.191 ± 0.228; two-sided Mann–Whitney U-test, P = 9.73 × 10⁻⁷). Data are from n = 242 CA2 interneurons and 491 CA3 interneurons from n = 9 mice and are reported as mean ± s.d. d, Left, same velocity–activity correlation as in c but broken down by subtype for all CA2 cells (PVBC correlation: 0.141 ± 0.220; AAC correlation: 0.271 ± 0.175; SOM correlation: 0.026 ± 0.194; CCK correlation: 0.111 ± 0.282; CB correlation: −0.155 ± 0.225). Significant differences between CA2 subtypes are indicated. Data were analyzed by one-way ANOVA with post hoc multiple-testing correction: PPVBC–CB = 0.0019, PAAC–CB = 0.001, PAAC–SOM = 0.006 and PCCK–CB = 0.043. Data are from n = 45 PVBCs, 26 AACs, 16 SOMs, 12 CCKs and 10 CBs from n = 9 mice and are reported as mean ± s.d. Right, same velocity–activity correlation as in c but broken down by subtype for all CA3 cells (PVBC correlation: 0.196 ± 0.187; AAC: 0.359 ± 0.139; SOM: 0.229 ± 0.212; CCK: 0.179 ± 0.236; CB: 0.032 ± 0.289). Significant differences between CA3 subtypes are indicated. Data were analyzed by one-way ANOVA with post hoc multiple-testing correction: PAAC–CB = 0.001, PAAC–CCK = 0.001, PAAC–PVBC = 0.001, PAAC–SOM = 0.0031, PCB–CCK = 0.0259, PCB–PVBC = 0.0051 and PCB–SOM = 0.001. Data are from n = 76 PVBCs, 63 AACs, 70 SOMs, 55 CCKs and 26 CBs from n = 9 mice and are reported as mean ± s.d. e, Left, confocal image of a CB+SATB1+ cell (magenta/white) and a CB+SATB1 cell (magenta only). Example fluorescence traces from these cells during locomotion and immobility are shown. Right, same correlation as in d but for CB+SATB1+ and CB+SATB1 subtypes split by region. CB+SATB1+ cells were significantly more correlated with velocity than CB+SATB1 cells (CA2 and CA3 were considered together; CB+SATB1+ correlation: 0.219 ± 0.151; CB+SATB1: −0.237 ± 0.186; two-sided Mann–Whitney U-test, P = 2.17 × 10⁻⁶). Data are from n = 17 CB+SATB1+ neurons and 19 CB+SATB1 neurons from n = 9 mice and are reported as mean ± s.d. f, Heat maps of average activity around run–start (left) and run–stop (right) events for all CB+SATB1+ (top) and CB+SATB1 (bottom) interneurons sorted by the location of their peak activity around run–start events (the same row on the left and right heat maps represents the same cell). Data are from n = 17 CB+SATB1+ neurons and 19 CB+SATB1 neurons from n = 9 mice; CA2 and CA3 data were considered together; *P < 0.05, **P <0.01, ***P <0.001.
Fig. 3 |
Fig. 3 |. Spatial tuning of CA3 and CA2 circuit elements during spatial navigation.
a, Schematic of the experimental paradigm. Top, mice were trained to run for water rewards that were randomly delivered on each lap. Bottom, CA3/CA2 interneurons were simultaneously recorded with 3D 2p imaging. b, Top left, representative example heat map of the lap-by-lap activity for an interneuron with positive spatial tuning. Top right, the same interneuron’s average tuning curve over all laps compared to a shuffle distribution (Methods). Bottom, summary of the fraction of positively tuned interneurons broken down by both region and CA3 subtypes (PVBC: 0.294 ± 0.304; AAC: 0.323 ± 0.348; SOM: 0.352 ± 0.309; CCK: 0.362 ± 0.291; CB: 0.568 ± 0.311; CA2 average: 0 353 ± 0.283; CA3 average: 0.328 ± 0.237). No significant differences in the fraction of spatially tuned cells were found between CA3 subtypes (one-way ANOVA, P = 0.18) or between the CA2 and CA3 regions (two-sided Mann–Whitney U-test, P = 0.37). The CB subtype represents only CB+SATB1+ neurons; immobility-active CB+SATB1 neurons were silenced during locomotion and were thus not considered in this analysis. Each data point represents an imaging session. PVBC data from 33 imaging sessions, AAC data from 35 sessions, SOM data from 25 sessions, CCK data from 30 sessions and CB+SATB1+ data from 11 sessions were included. CA2 data are from 34 sessions, and CA3 data are from 39 sessions (n = 9 mice). Data are reported as mean ± s.d.; NS, not significant. C, Top left, representative example heat map of the lap-by-lap activity for an interneuron with negative spatial tuning. Top right, the same interneuron’s average tuning curve over all laps compared to a shuffle distribution (Methods). Bottom, summary of the fraction of negatively tuned interneurons broken down by both region and CA3 subtypes (PVBC: 0.379 ± 0.273; AAC: 0.258 ± 0.331; SOM: 0.400 ± 0.290; CCK: 0.357 ± 0.286; CB: 0.341 ± 0.358; CA2 average: 0.423 ± 0.249; CA3 average: 0.384 ± 0.226). No significant differences in the fraction of spatially tuned cells were found between CA3 subtypes (one-way ANOVA, P = 0.41) or between the CA2 and CA3 regions (two-sided Mann–Whitney U-test, P = 0.24). The CB subtype represents only CB+SATB1+ neurons; immobility-active CB+SATB1 neurons were silenced during locomotion and were thus not considered in this analysis. Each data point represents an imaging session. Data are from the same number of sessions and the same number of mice as described earlier and are reported as mean ± s.d. d, Schematic of the imaging paradigm for CA3 pyramidal cells (left) and representative in vivo time average of the CA3 pyramidal cell field of view (right) using the Grik4-Cre transgenic line. CA3 pyramidal cells were imaged during the same random foraging paradigm. e, Left, representative example heat map of the lap-by-lap activity of a spatially tuned CA3 pyramidal cell (from a total of 139 cells from n = 5 mice). Right, the same pyramidal cell’s average spatial tuning curve over all laps compared to a shuffle distribution (Methods). f, Summary data of CA3PC spatial tuning. Left, heat map of the spatial tuning curves of all cells sorted by the location of each cell’s maximum activity (139 cells from n = 5 mice). Right, the fraction of spatially tuned cells during each imaging session; 33.7% ± 12.5% neurons were spatially selective during each imaging session (data are from ten sessions over n = 5 mice, with two sessions per mouse). Each dot represents an imaging session. Data are reported as mean ± s.e.m.; *P < 0.05, **P < 0.01, ***P < 0.001.
Fig. 4 |
Fig. 4 |. Subtype-specific offline dynamics during SWR events.
a, Experimental setup for simultaneous 2p AOD imaging and LFP recordings. SWRs were recorded on a four-channel silicon probe implanted in the contralateral CA1. Calcium traces are shown on the same timescale as the recorded LFP, with identified SWRs denoted with dashed red lines. b, Average SWR activity index for all CA3 interneurons grouped by subtype. Two-sided Wilcoxon signed-rank tests against a median of 0 were performed for each subtype (PVBC: 0.45 ± 0.48, P = 1.1 × 10⁻⁹; AAC: −0.037 ± 0.27, P = 0.004; SOM: 0.17 ± 0.47, P = 0.006; CCK: 0.20 ± 0.56, P = 0.11; CB+SATB1+: −0.19 ± 0.24, P = 0.07; CB+SATB1: 0.24 ± 0.45, P = 0.31). Between-subtype statistical comparisons were performed using the Kruskal–Wallis test (P < 10−8) with post hoc Wilcoxon rank-sum tests with P values adjusted using the Bonferroni correction (significant adjusted P values: PVBC–AAC: <10−5; PVBC–SOM: 0.0006; PVBC–CB+SATB1+: 0.0047; AAC–SOM: 0.005). Data are from n = 75 PVBCs, 71 AACs, 114 SOMs, 32 CCKs, 8 CB+SATB1+ cells and 13 CB+SATB1 cells from n = 13 mice. Data are reported as mean ± s.d. c, Average peri-SWR traces for all CA3 interneuron subtypes. Cell numbers for each subtype are indicated; data are from n = 13 mice. Traces for each subtype represent mean ± s.e.m. The scale of the y axis is shared across all subtypes. d, Same as c, but the data are split by activated (solid lines) and inhibited (dashed lines) neurons. CA3 activated neurons: PVBCs = 59; AACs = 21; SOMs = 65; CCKs = 16; CB+SATB1+ cells = 2; CB+SATB1 cells = 7. Inhibited neurons: PVBCs = 16; AACs = 50; SOMs = 49; CCKs = 16; CB+SATB1+ cells = 6; CB+SATB1 cells = 6. Traces for each subtype represent mean ± s.e.m. The scale of the y axis is shared across all subtypes; *P <0.05, **P <0.01, ***P <0.001.
Fig. 5 |
Fig. 5 |. Peri-SWR dynamics are both predictive and reflective of SWR duration in a subtype-specific manner.
a, Example responses of a CA3 PVBC and a CA3 CCK cell to long- and short-duration SWRs. Left, heat maps illustrating each cell’s responses around SWR events ordered by their duration. Right, both activated and inhibited responses were strongly modulated by SWR duration. b, Average z-scored peri-SWR traces for both short-duration (0–20th percentile) and long-duration (80–100th percentile) SWRs for CA3 interneurons of each subtype (n = 75 PVBCs, 71 AACs, 114 SOMs, 32 CCKs and 22 CBs from n = 13 mice). CB+SATB1+ and CB+SATB1 neurons are considered together in the CB subtype for this analysis (see Extended Data Fig. 7a–c for the separated data). Traces for each subtype and condition represent mean ± s.e.m. The scale of the y axis is shared across all subtypes. c, Left, schematic illustrating the activity before and after each SWR that was considered for analysis. A 500-ms window before and after each SWR event was used. Right, average value of the activity of CA3 interneurons of each subtype before and after SWRs considered separately for SWRs falling into five groups based on their duration (0–20th, 20–40th, 40–60th, 60–80th and 80–100th percentiles). Statistics indicate the two-sided Spearman correlation between each subtype’s average activity in pre- and post-SWR epochs with SWR durations falling into different quantiles. Only PVBCs and CCKs have their activity significantly correlated with SWR duration (PVBC pre-SWR, P = 0.012; PVBC post-SWR, P = 0.0002; CCK pre-SWR, P = 0.001). Data are from n = 75 PVBCs, 71 AACs, 114 SOMs, 32 CCKs and 22 CBs from n = 13 mice and are presented as mean ± s.e.m. d, Average value of the difference (Δ or diff) in activity between long-duration (80–100th percentile) and short-duration (0–20th percentile) SWRs for each CA3 interneuron considered separately for pre-SWR and post-SWR activity and grouped by subtype. PVBCs were slightly more inhibited before long-duration SWRs and significantly more activated after long-duration SWRs, while CCKs were significantly more inhibited before long-duration SWRs. SOMs were more activated after long-duration SWRs. Only significant differences are indicated; the remaining subtypes did not show considerably different activity before or after long- duration SWRs compared to short-duration SWRs. Data were analyzed by two-way, one-sample t-tests against 0 for each subtype with a Bonferroni correction for multiple testing: PVBC pre: −0.067 ± 0.180, P = 0.020; PVBC post: 0.242 ± 0.347, P = 7.22 × 10⁻⁷; AAC pre: −0.0069 ± 0.155, P = 1.0; AAC post: −0.0025 ± 0.208, P = 1.0; SOM pre: 0.040 ± 0.198, P = 0.34; SOM post: 0.112 ± 0.310, P = 0.0020; CCK pre: −0.195 ± 0.209, P = 1.19 × 10⁻⁴; CCK post: 0.057 ± 0.339, P = 1.0; CB pre: 0.0023 ± 0.19, P = 1.0; CB post: 0.093 ± 0.245, P = 0.97). Data are from n = 75 PVBCs, 71 AACs, 114 SOMs, 32 CCKs and 22 CBs from n = 13 mice. Data are reported as mean ± s.d.; *P < 0.05, **P < 0.01, ***P < 0.001.
Fig. 6 |
Fig. 6 |. Learning-related changes in interneuron dynamics around SWRs are both region and subtype specific.
a, Schematic of the GOL task. CA3/CA2 interneurons were imaged during SWRs when mice rested on a cueless burlap belt during the PRE and POST sessions. During the task, water-restricted mice ran on a cued belt to receive a water reward that remained in the same location from lap to lap. b, Quantification of the average SWR occurrence rate (left) and average SWR duration (right) for PRE and POST sessions. Both the occurrence rate and the average duration increased significantly from PRE to POST (occurrence PRE: 0.146 ± 0.088 s−1; occurrence POST: 0.456 ± 0.100 s−1; two-sided Wilcoxon signed-rank test, P = 2.48 × 10⁻⁷; duration PRE: 74.5 ± 12.7 ms; duration POST: 80.4 ± 8.9 ms; two-sided Wilcoxon signed-rank test, P = 6.19 × 10⁻⁴; data are from n = 35 PRE sessions and 35 POST sessions from n = 8 mice). Data are reported as mean ± s.d. c, Example mouse behavior from both learning and non-learning days. On learning days, the fraction of anticipatory licks during the second half of the session was greater than in the first half. Dividing the dataset in this manner resulted in 22 learning days and 13 non-learning days. The blue shaded area represents the reward zone, and the gray shaded area represents the area where anticipatory licks were considered. d, Relationship between the change in SWR duration and the change in anticipatory licks between the second and first halves of the session on each imaging day. The linear regression fit is shown, with shaded bands representing the 95% confidence interval. Days on which the mouse learned were associated with greater changes in SWR duration from PRE to POST. e, Quantification of the difference in SWR duration from PRE to POST sessions on learning and non-learning days. On learning days, the SWR duration increased significantly from PRE to POST (PRE: 72.7 ± 12.7 ms; POST: 81.1 ± 9.5 ms; two-sided Wilcoxon signed-rank test, P = 2.60 × 10⁻⁴; data are from n = 22 imaging days in n = 8 mice). On non-learning days, the average SWR duration did not change significantly from PRE to POST sessions (PRE: 77.6 ± 12.2 ms; POST: 79.3 ± 7.6 ms; two-sided Wilcoxon signed-rank test, P = 0.600; data are from n = 13 imaging days in n = 8 mice). Data are reported as mean ± s.d. f, Average z-scored peri-SWR traces for each CA3 interneuron subtype during both PRE and POST sessions on learning days. PVBCs became more activated around SWRs after learning, while CCKs became more inhibited around SWRs after learning (n = 19 PVBCs, 17 AACs, 18 SOMs, 8 CCKs and 5 CBs from n = 8 mice). CB+SATB1+ and CB+SATB1 neurons are considered together in the CB subtype. Traces for each subtype and condition represent mean ± s.e.m. The scale of the y axis is shared across all subtypes. g, Quantification of the change in peri-SWR modulation for CA3 PVBCs and CCKs between PRE and POST sessions on learning days. PVBCs became more activated around SWRs after learning, while CCKs became more inhibited around SWRs after learning (PVBC PRE: 0.39 ± 0.36 and PVBC POST: 0.66 ± 0.33, two-sided Wilcoxon signed-rank test, P = 0.0057; CCK PRE: −0.27 ± 0.05 and CCK POST: −0.41 ± 0.18, two-sided Wilcoxon signed-rank test, P = 0.049; data are from n = 18 PVBCs and 8 CCKs from n = 8 mice). Data are reported as mean ± s.d. h, Same quantification as in g but now for CA2 PVBCs and CCKs. PVBCs became slightly less activated around SWRs after learning, while CCKs did not significantly change their activity (PVBC PRE: 0.82 ±0.68 and PVBC POST: 0.59 ± 0.39, two-sided Wilcoxon signed-rank test, P = 0.043; CCK PRE: −0.49 ± 0.24 and CCK POST: −0.48 ± 0.23, two-sided Wilcoxon signed-rank test, P = 0.68; data are from n = 26 PVBCs and 14 CCKs from n = 8 mice). Data are reported as mean ± s.d.; *P < 0.05, **P < 0.01, ***P < 0.001.

References

    1. Tulving E Episodic memory: from mind to brain. Annu. Rev. Psychol 53, 1–25 (2002). - PubMed
    1. Buzsáki G Hippocampal sharp wave-ripple: a cognitive biomarker for episodic memory and planning. Hippocampus 25, 1073–1188 (2015). - PMC - PubMed
    1. Daumas S, Halley H, Francés B & Lassalle J-M Encoding, consolidation, and retrieval of contextual memory: differential involvement of dorsal CA3 and CA1 hippocampal subregions. Learn. Mem 12, 375–382 (2005). - PMC - PubMed
    1. Kesner RP Behavioral functions of the CA3 subregion of the hippocampus. Learn. Mem 14, 771–781 (2007). - PubMed
    1. Nakashiba T, Buhl DL, McHugh TJ & Tonegawa S Hippocampal CA3 output is crucial for ripple-associated reactivation and consolidation of memory. Neuron 62, 781–787 (2009). - PMC - PubMed

Publication types