. 2023 Aug;19(8):1013-1021.
doi: 10.1038/s41589-023-01321-6. Epub 2023 Apr 20.

The relaxin receptor RXFP1 signals through a mechanism of autoinhibition

Affiliations

The relaxin receptor RXFP1 signals through a mechanism of autoinhibition

Sarah C Erlandson et al. Nat Chem Biol. 2023 Aug.

Abstract

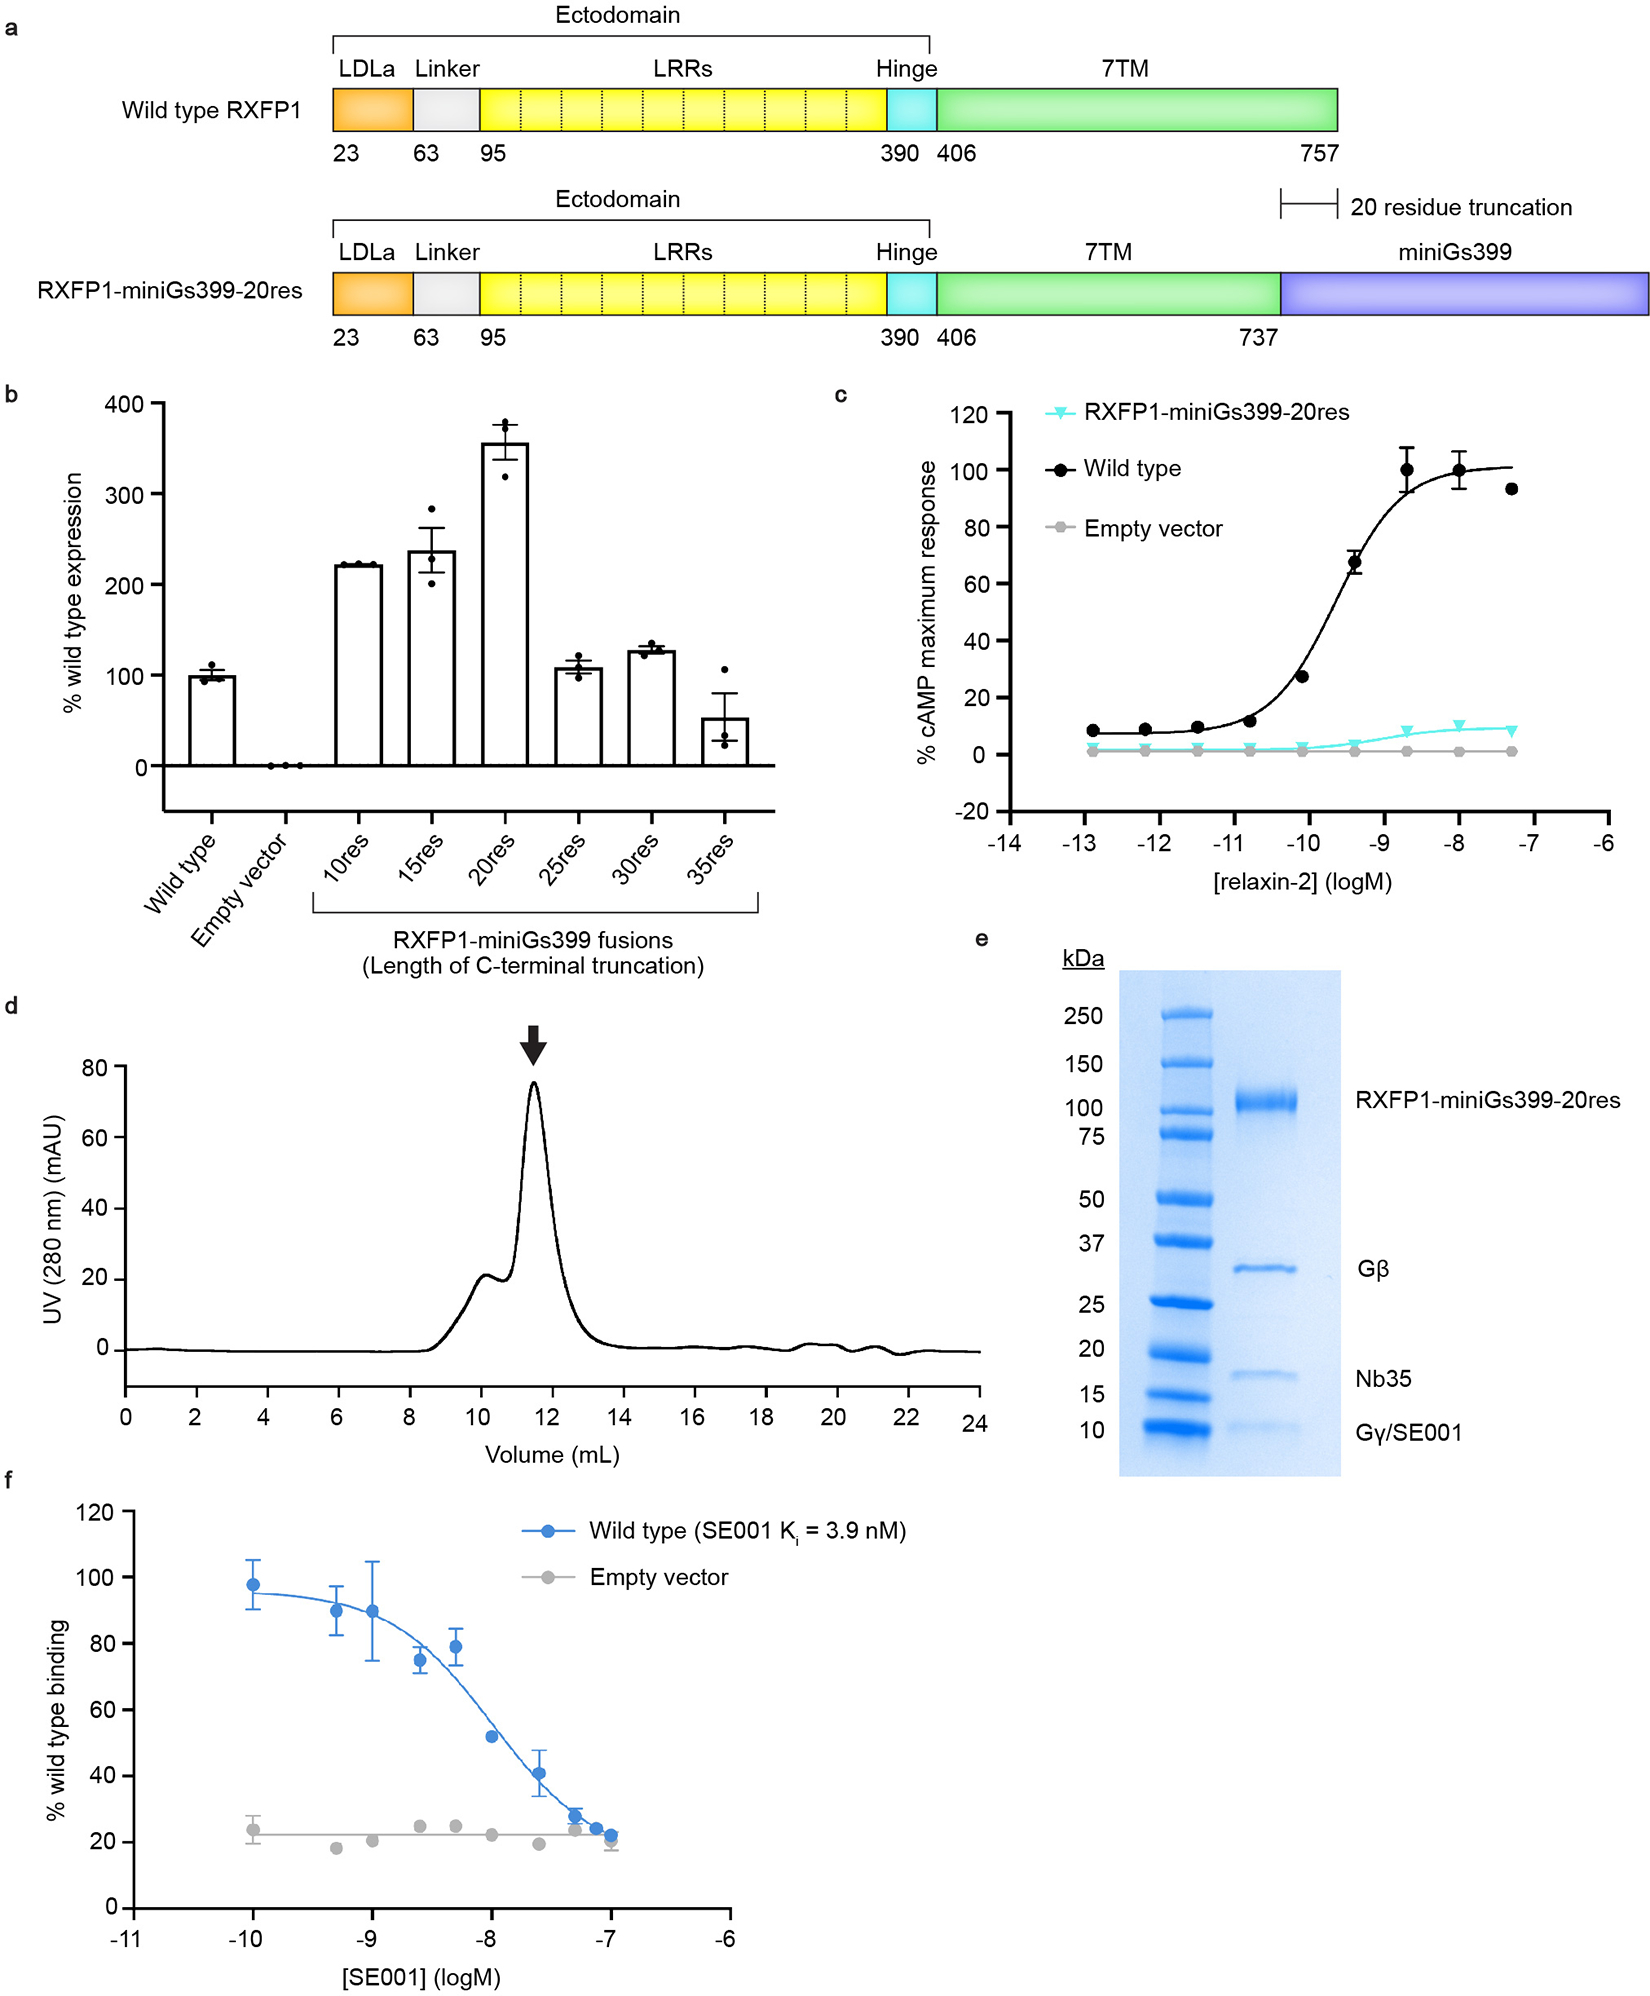
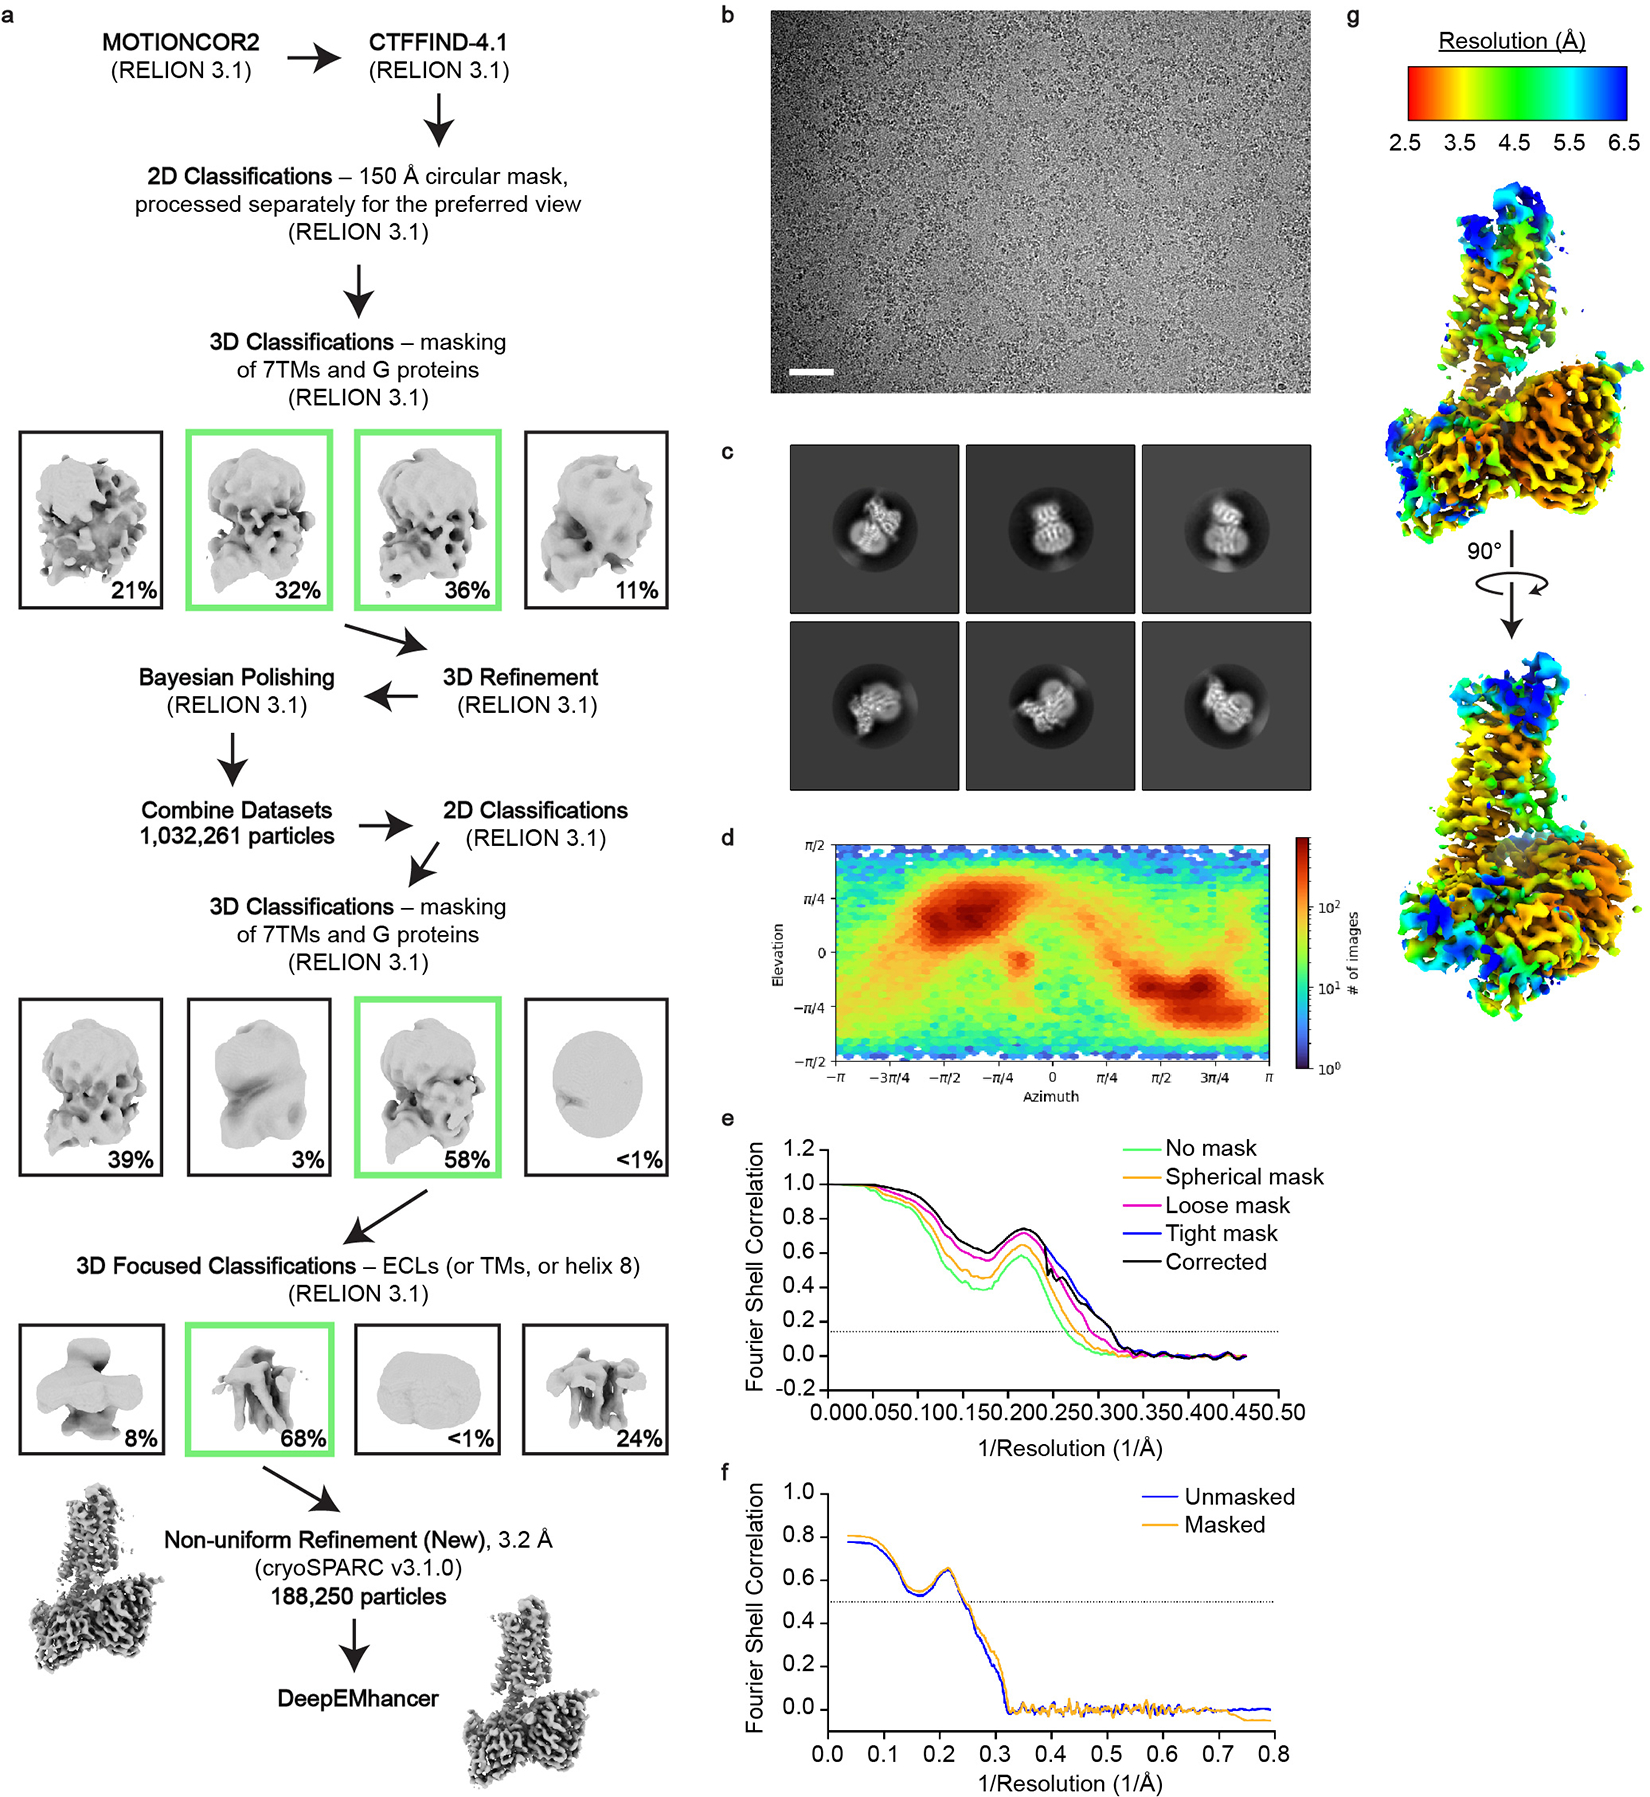
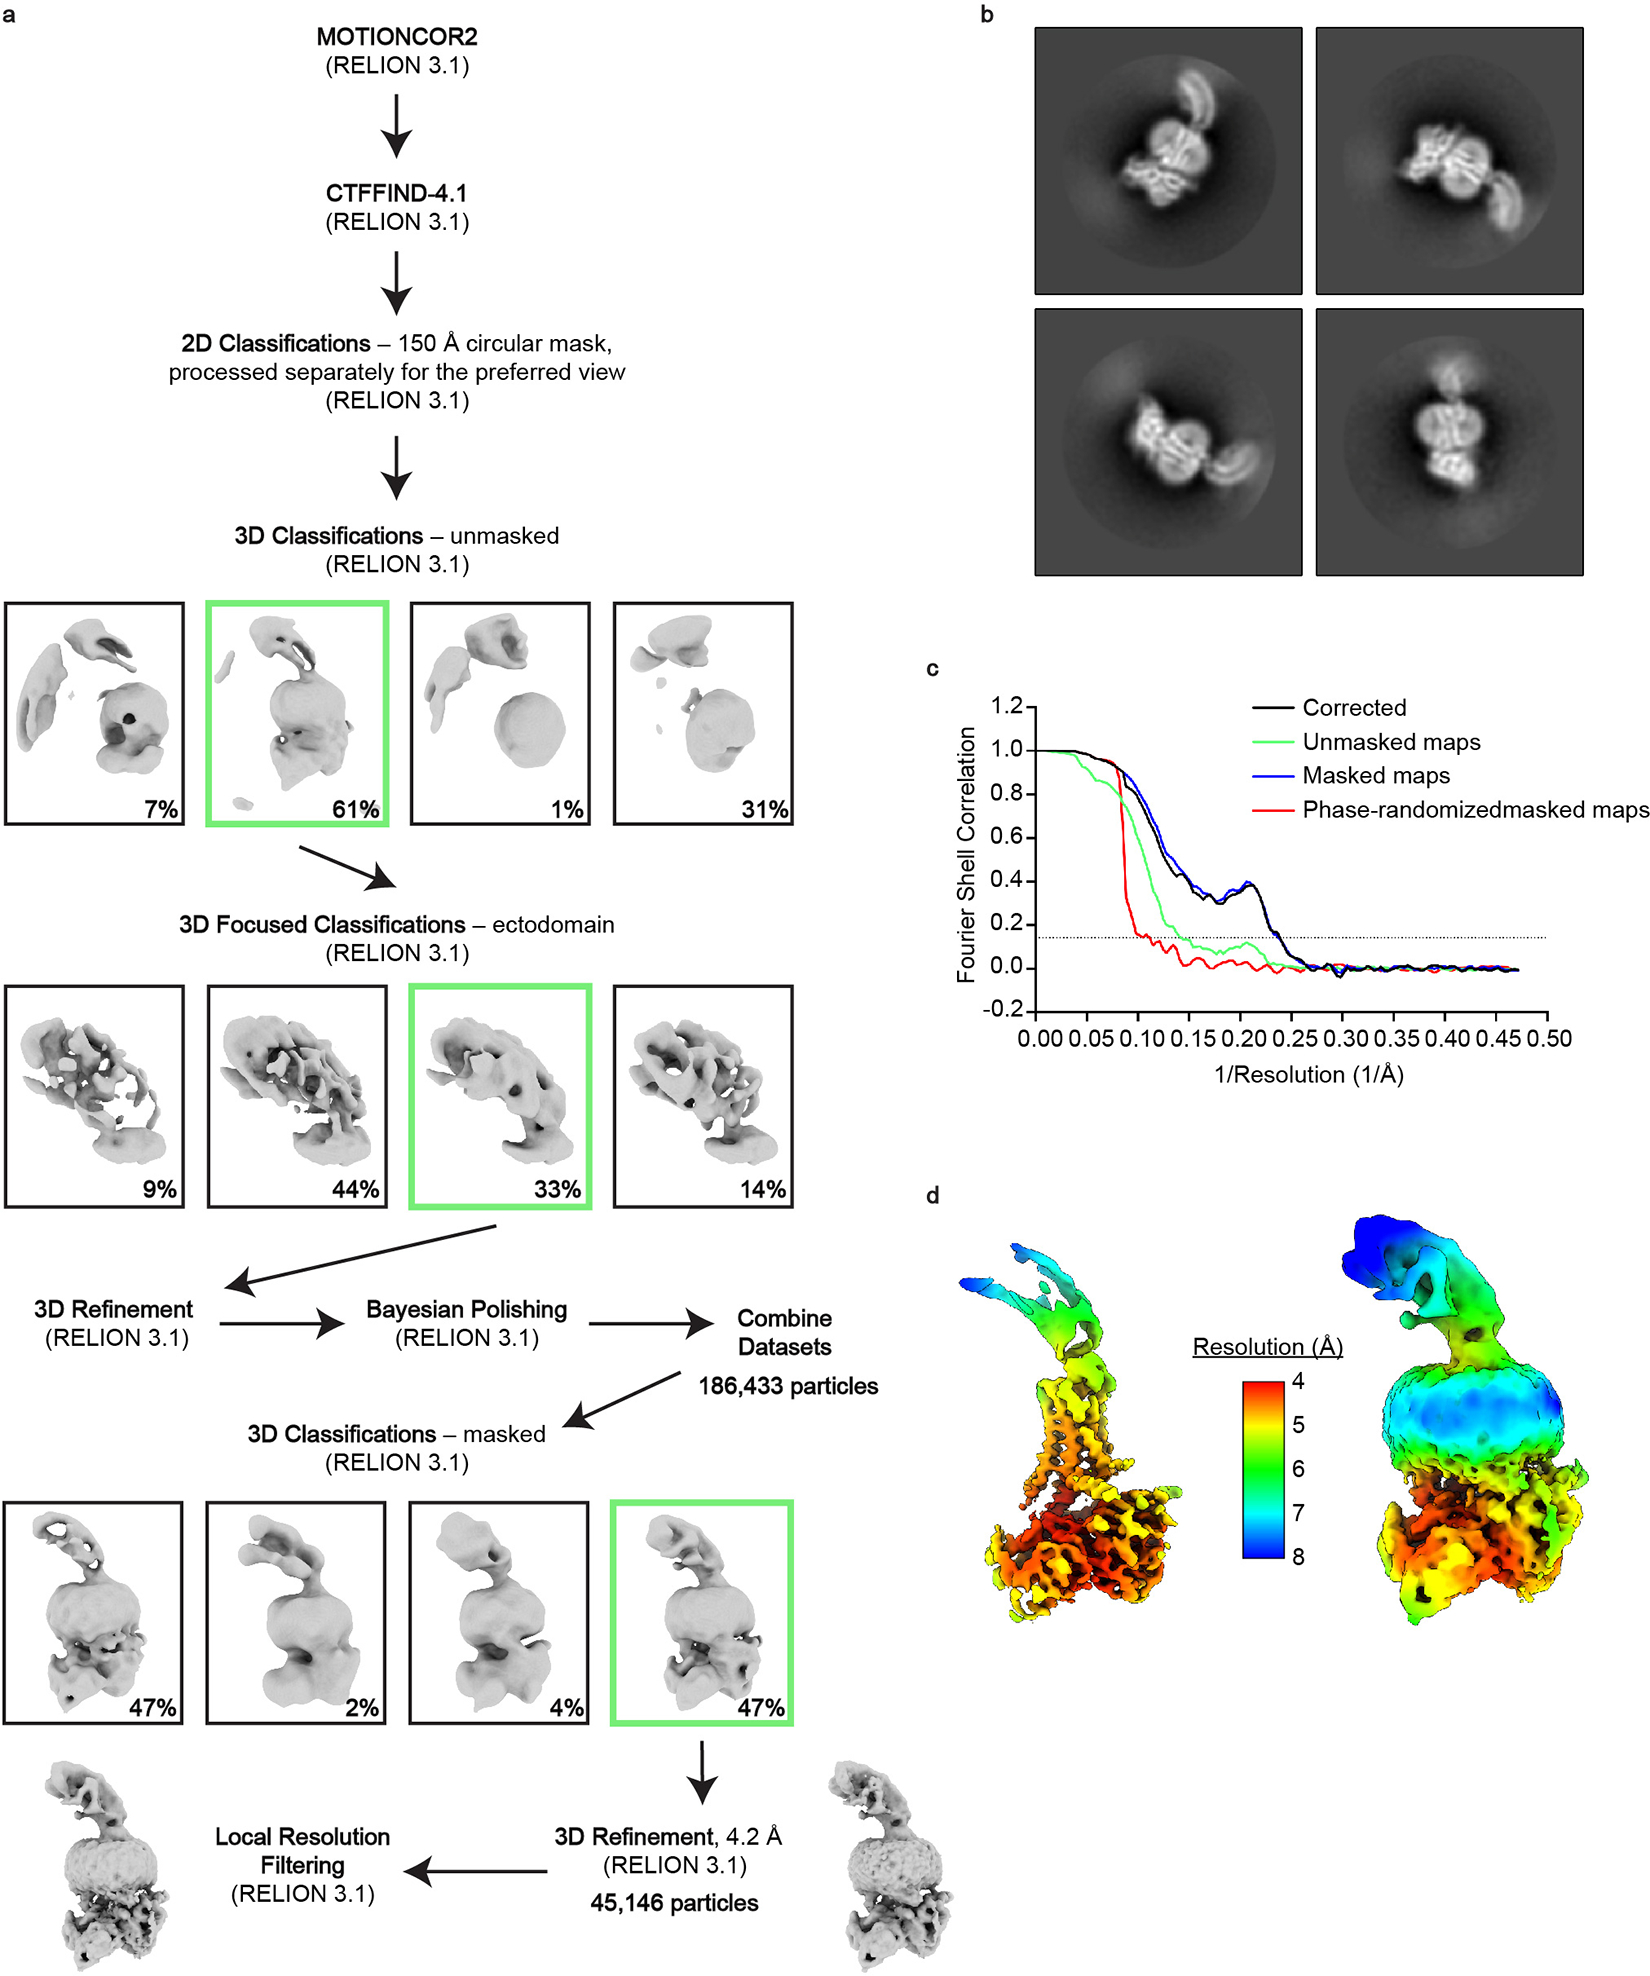
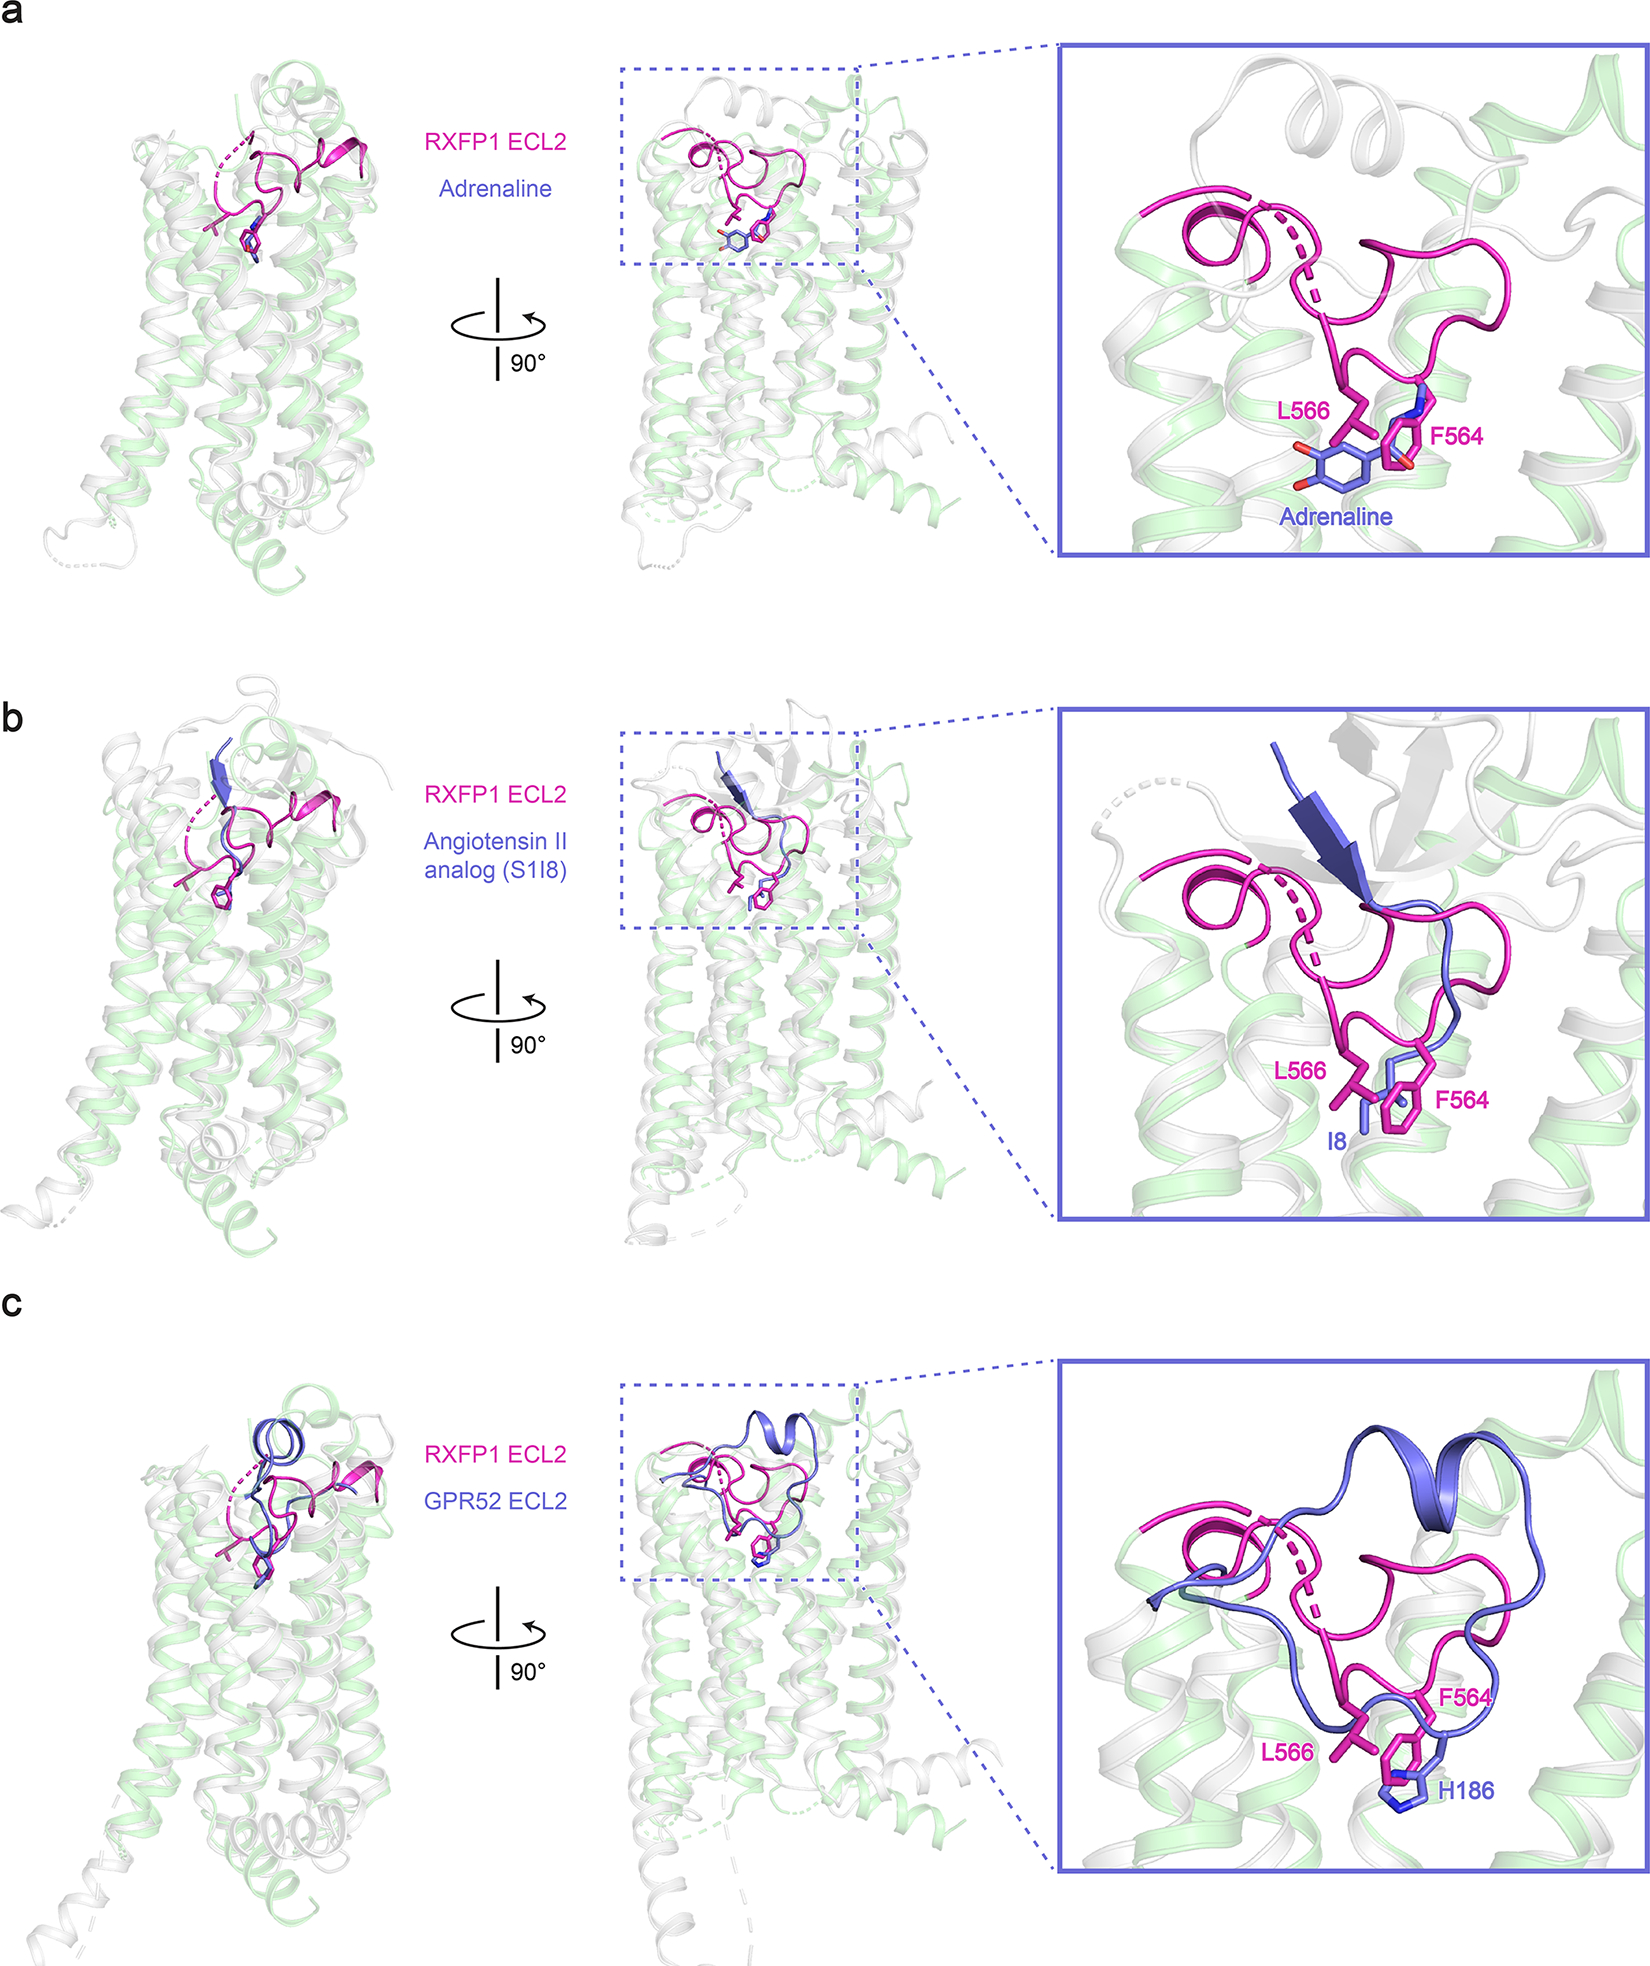
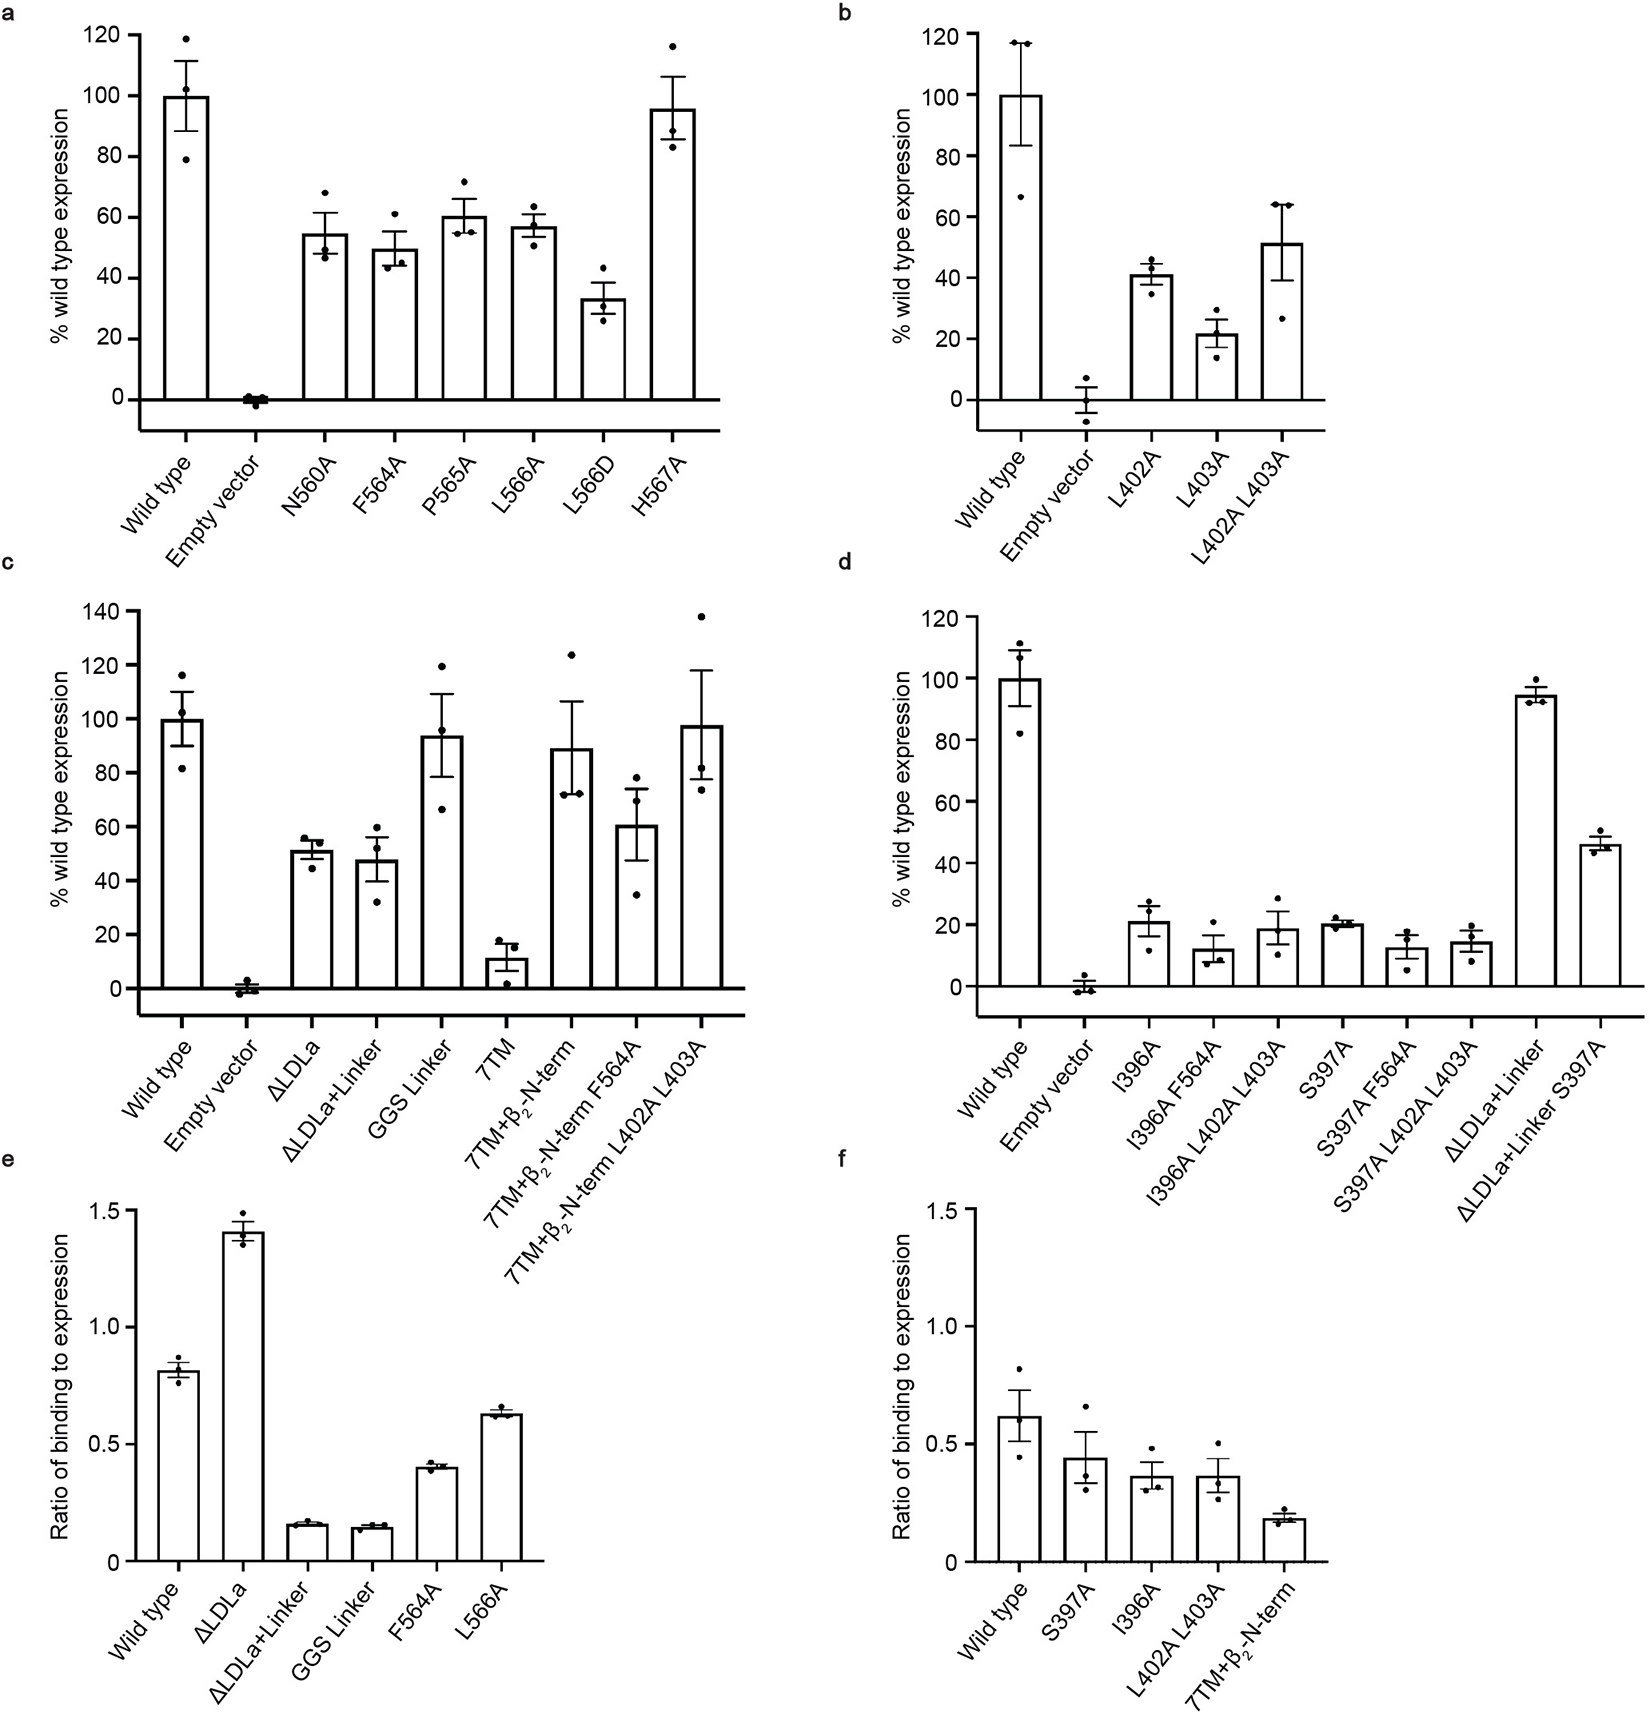
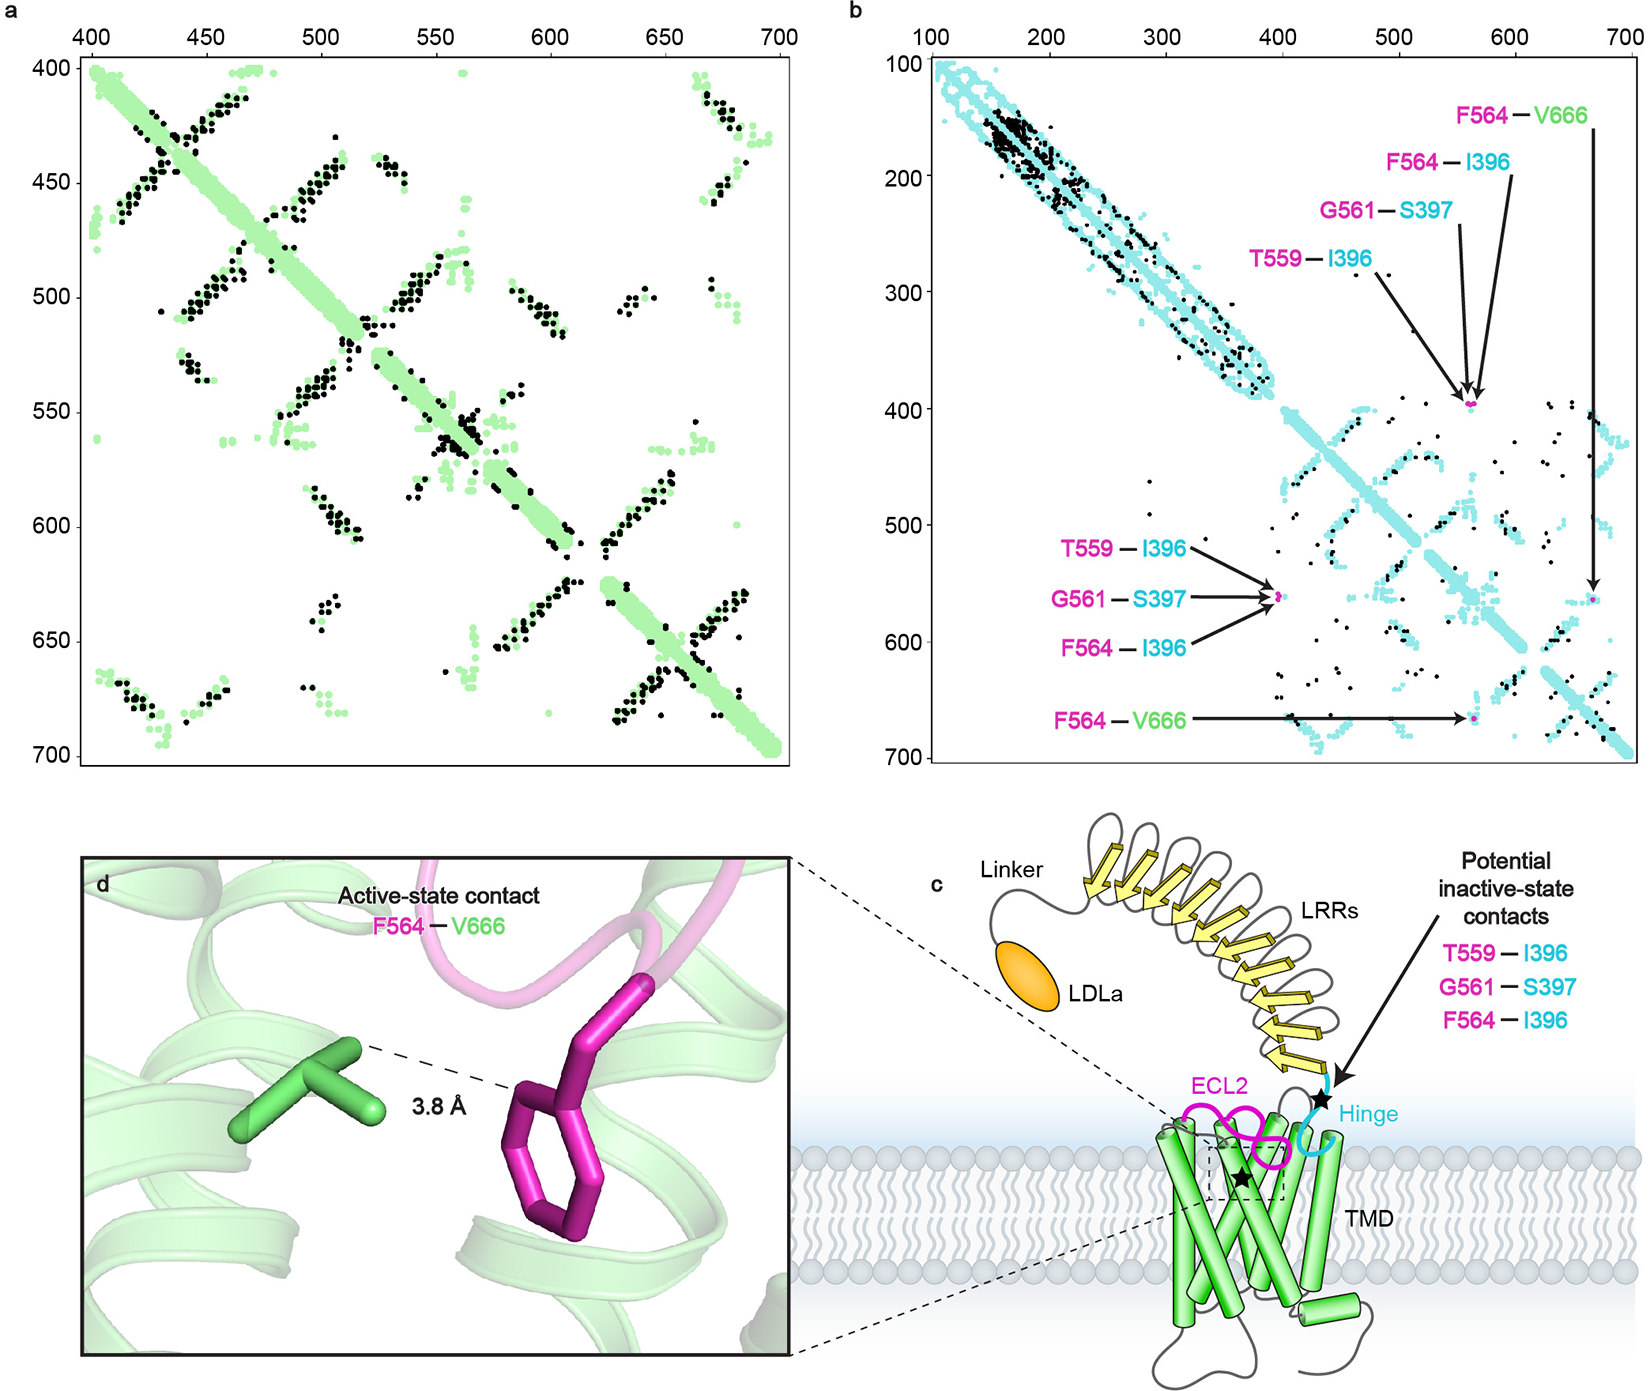
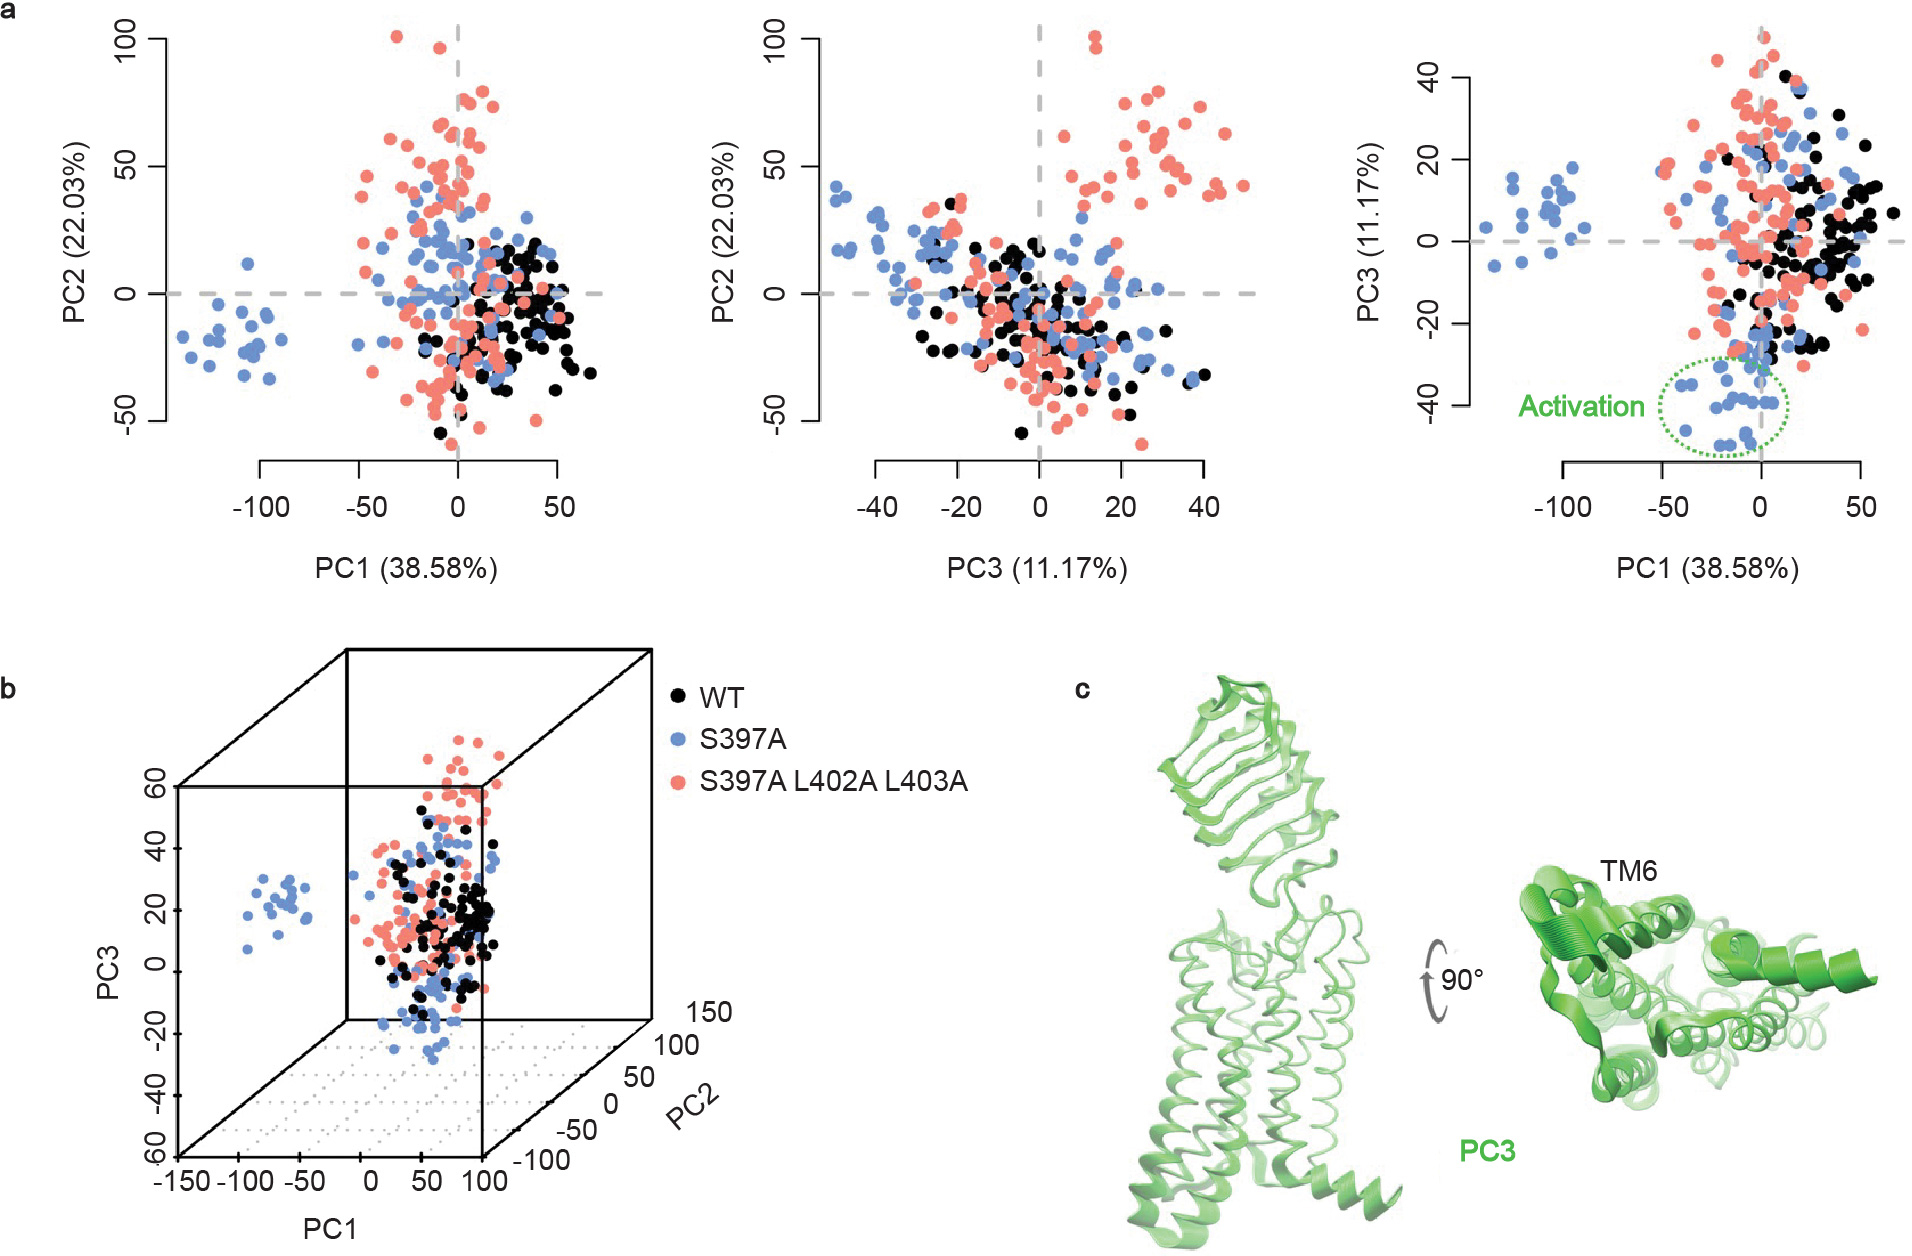
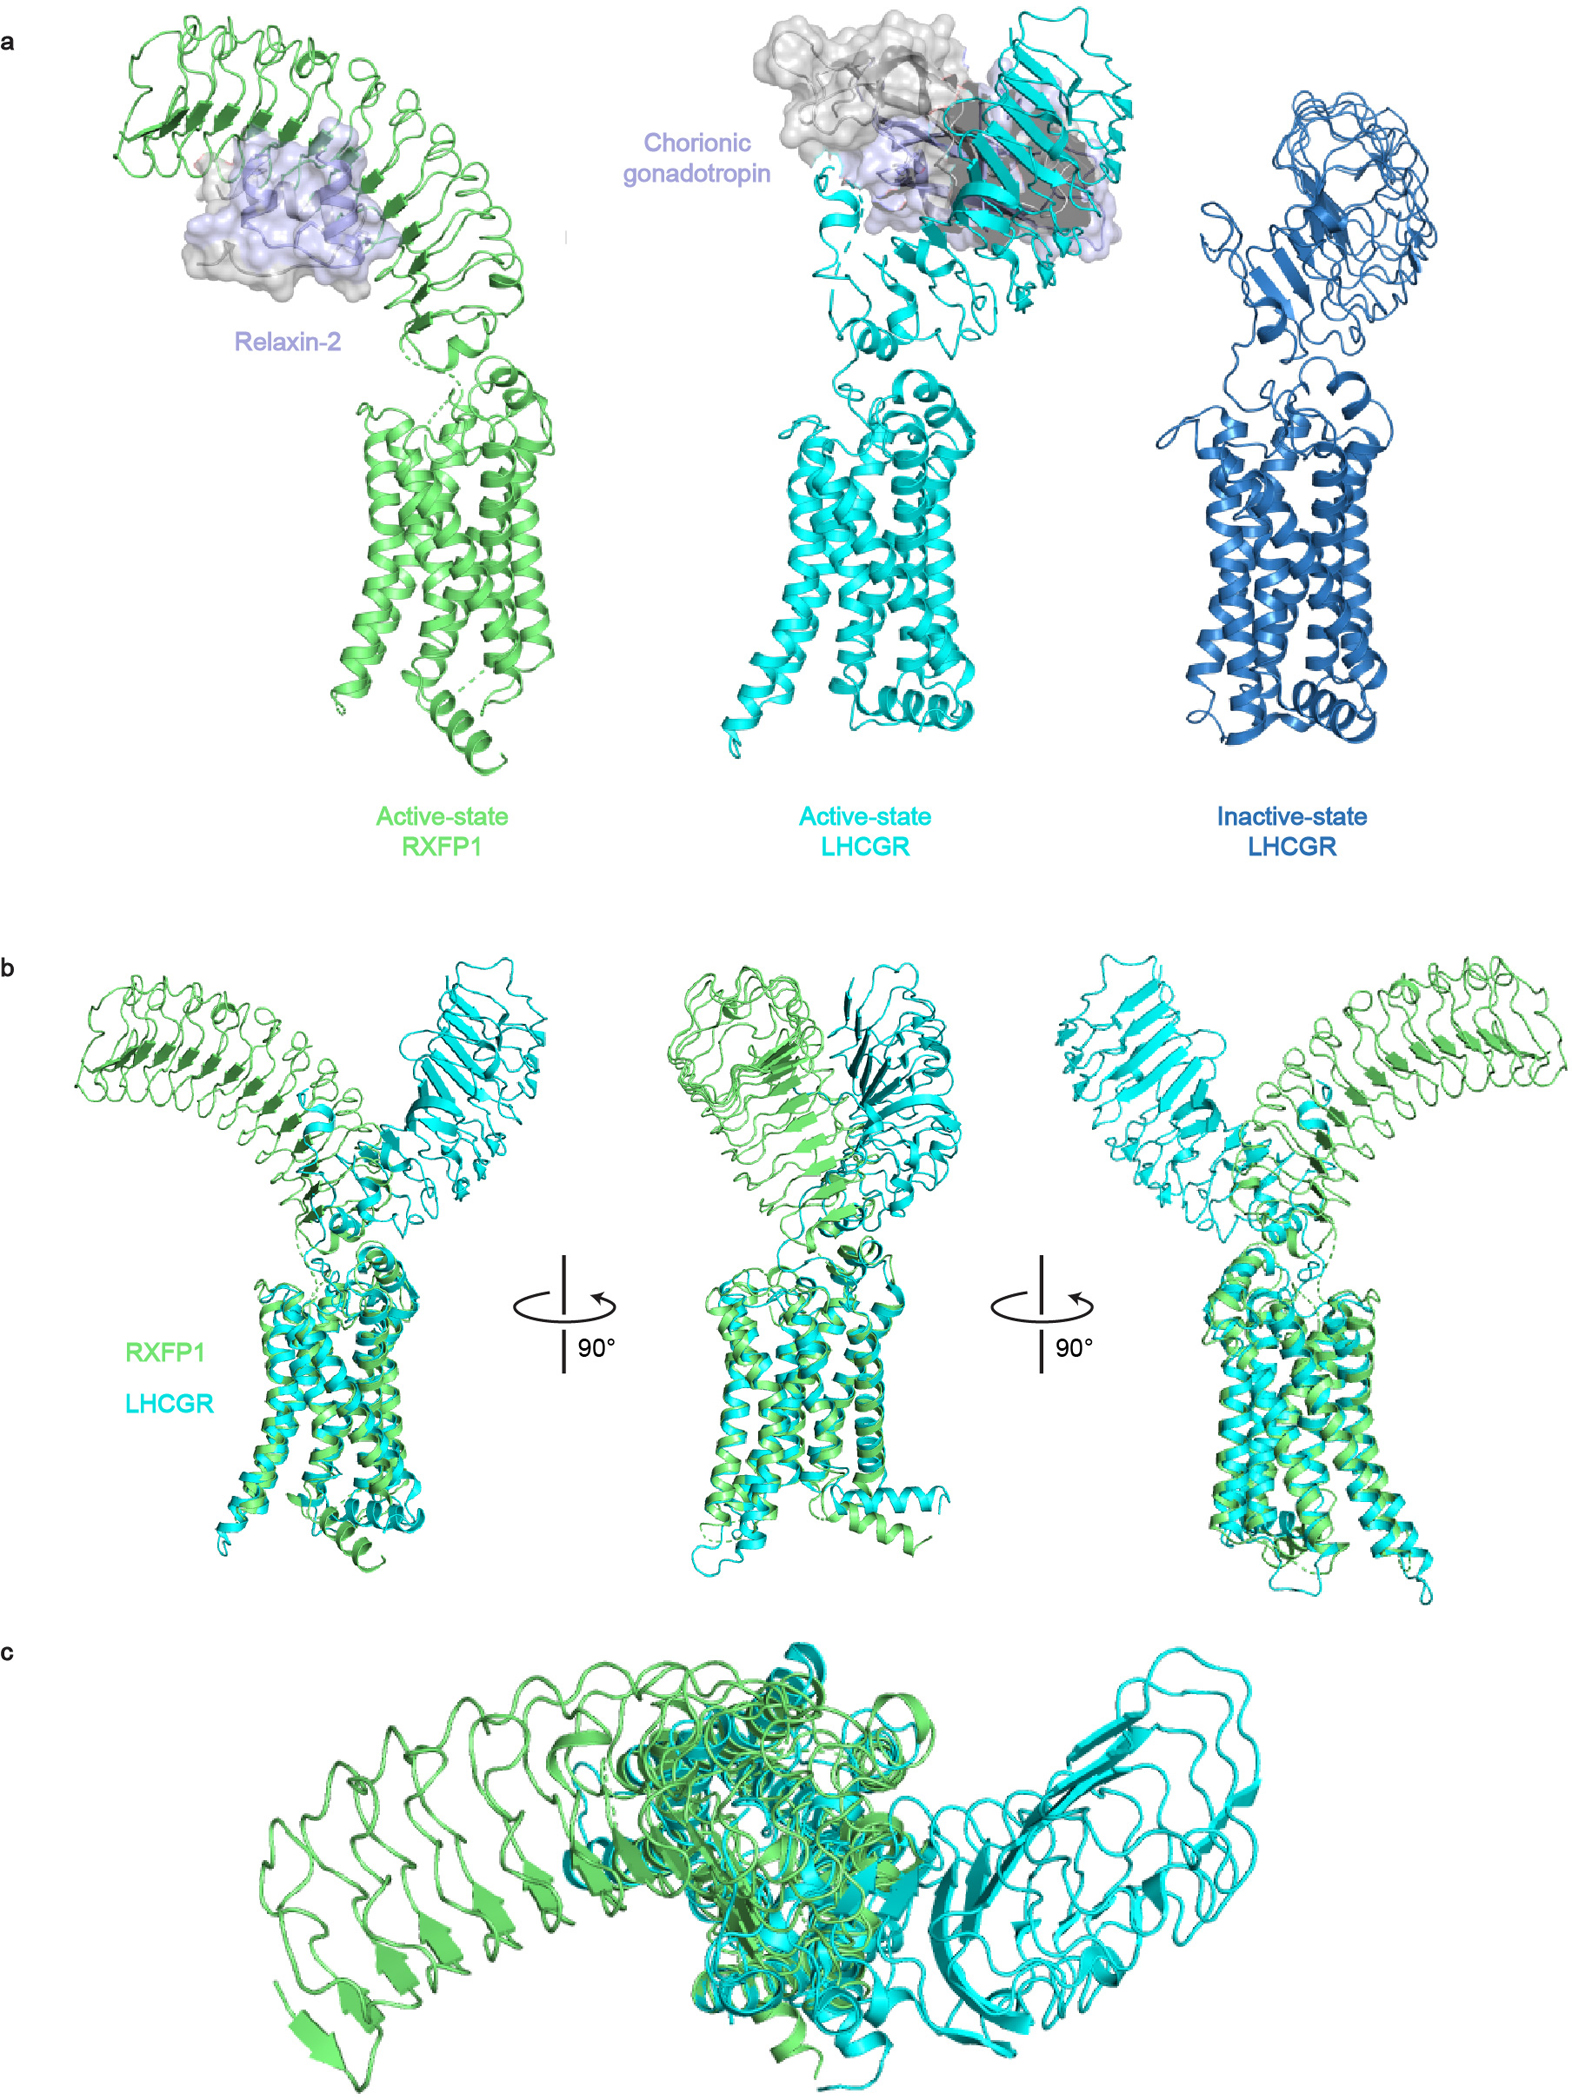
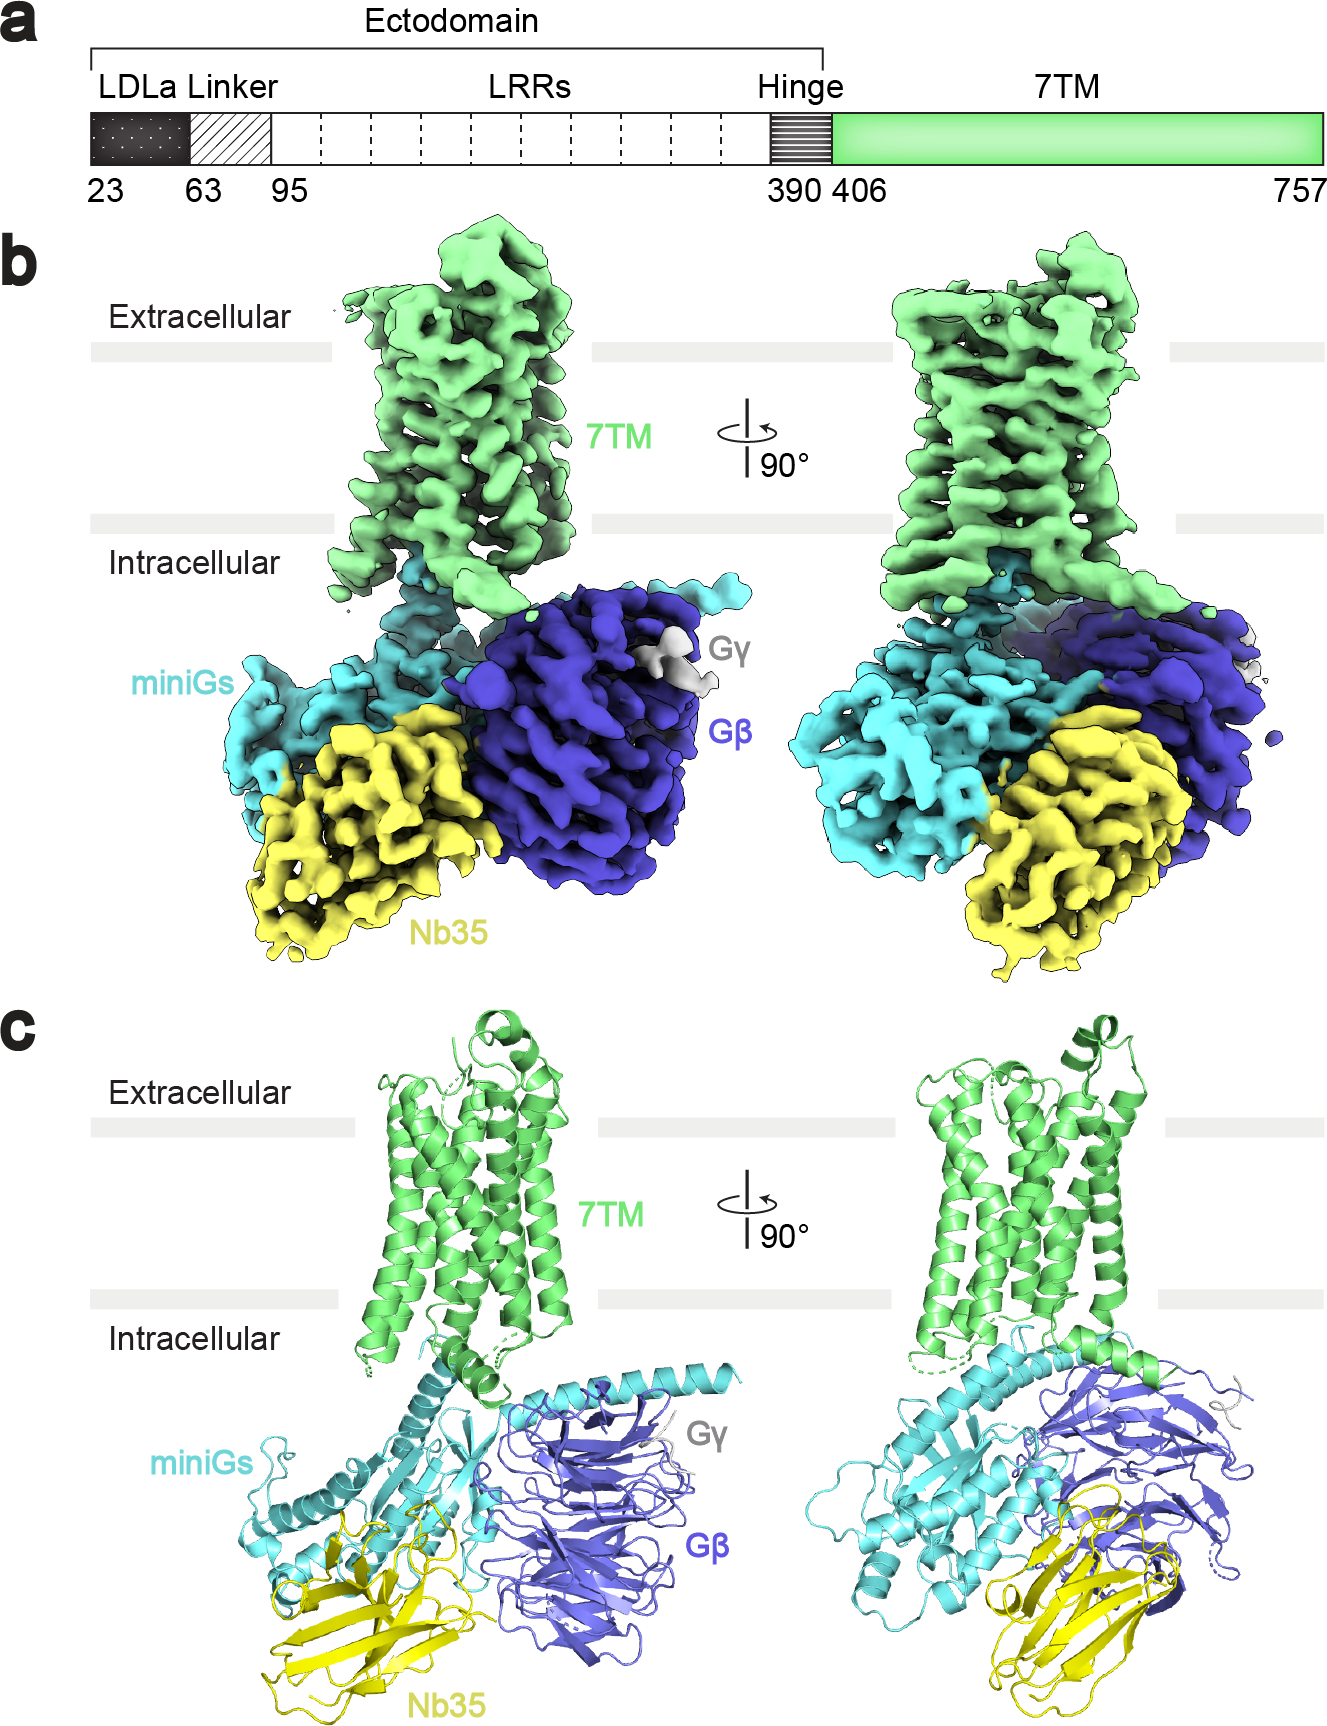
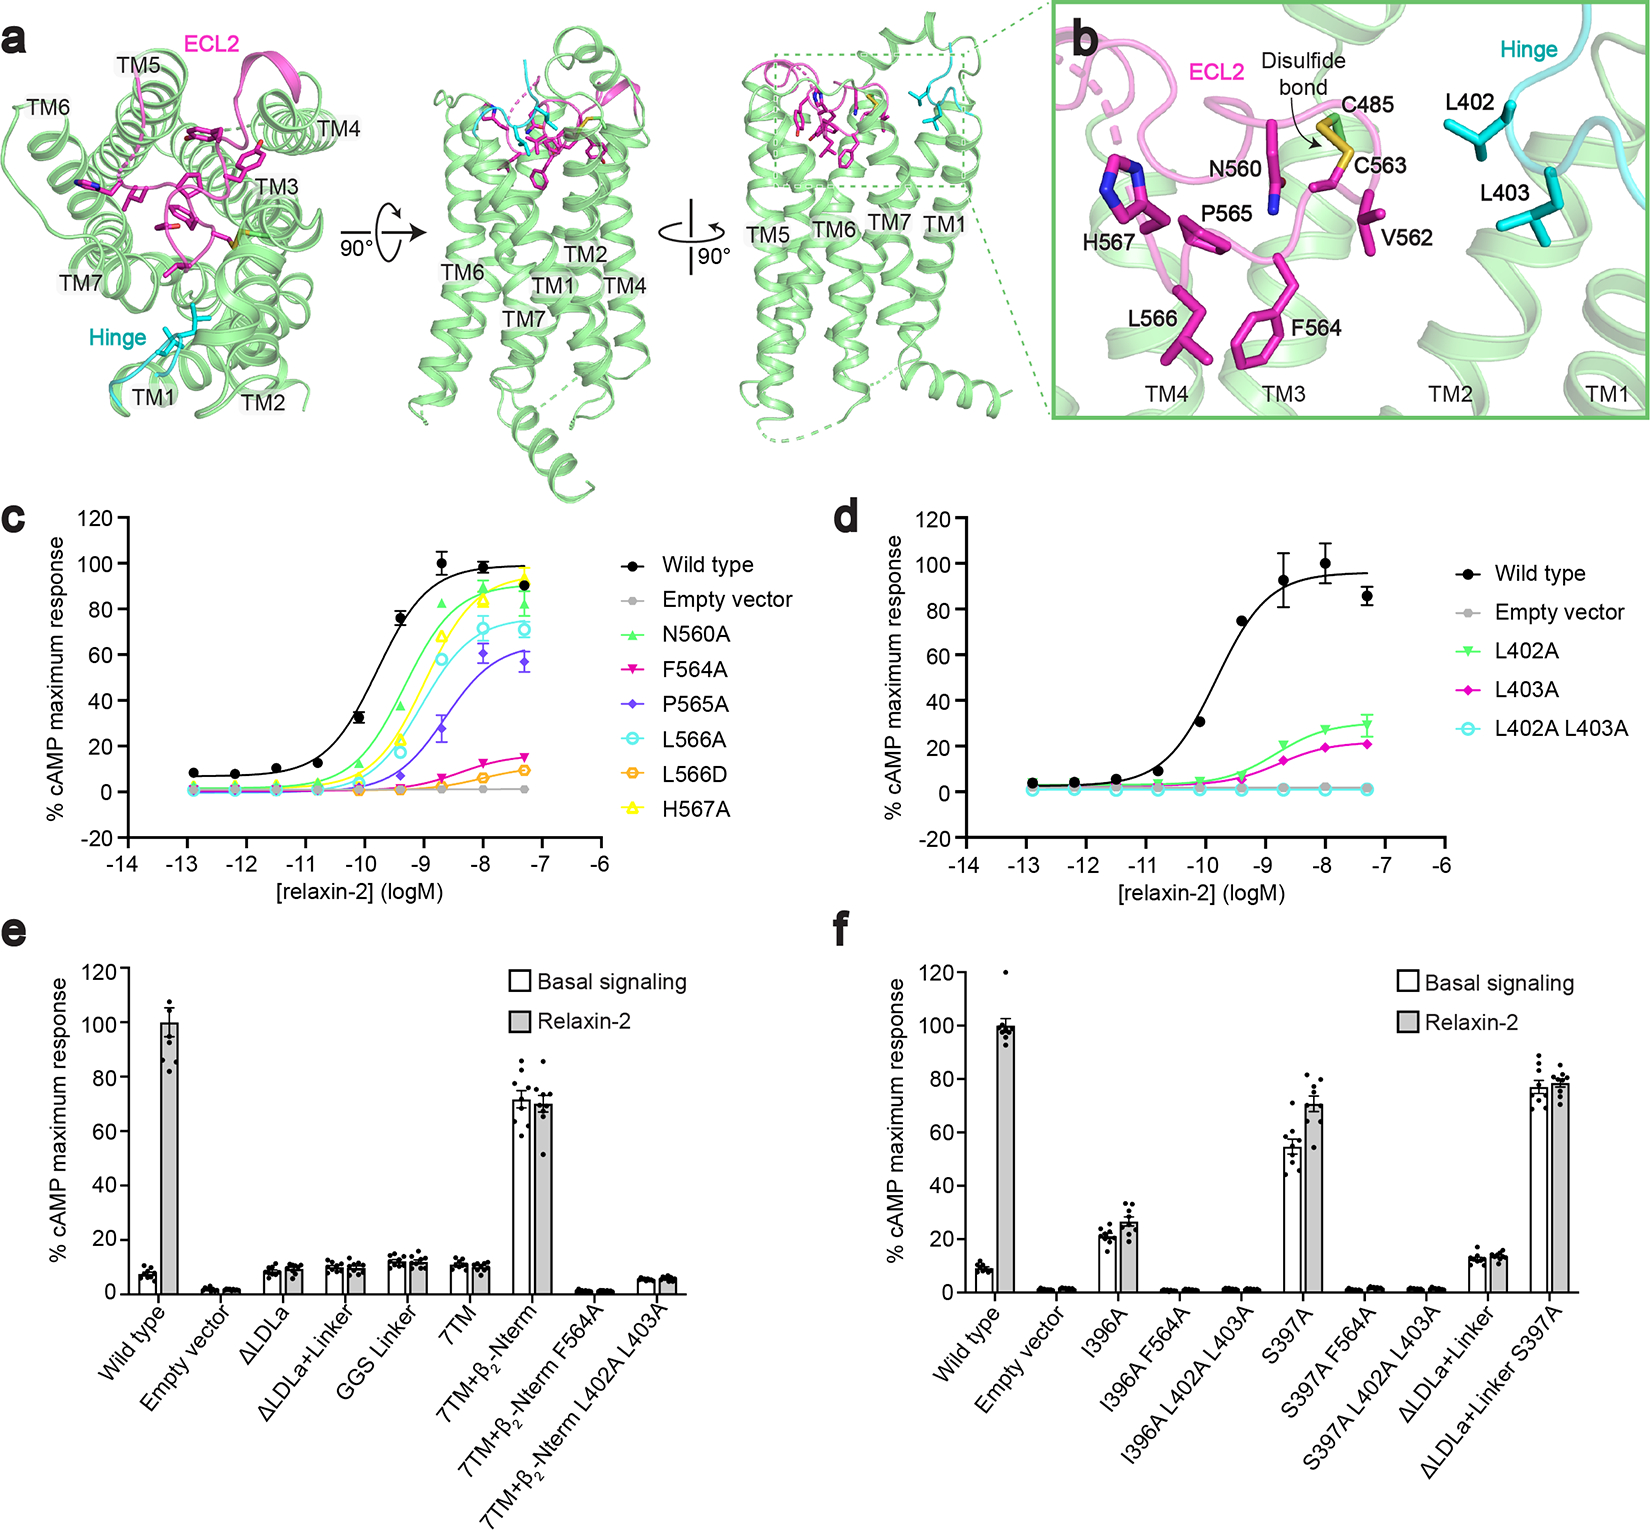
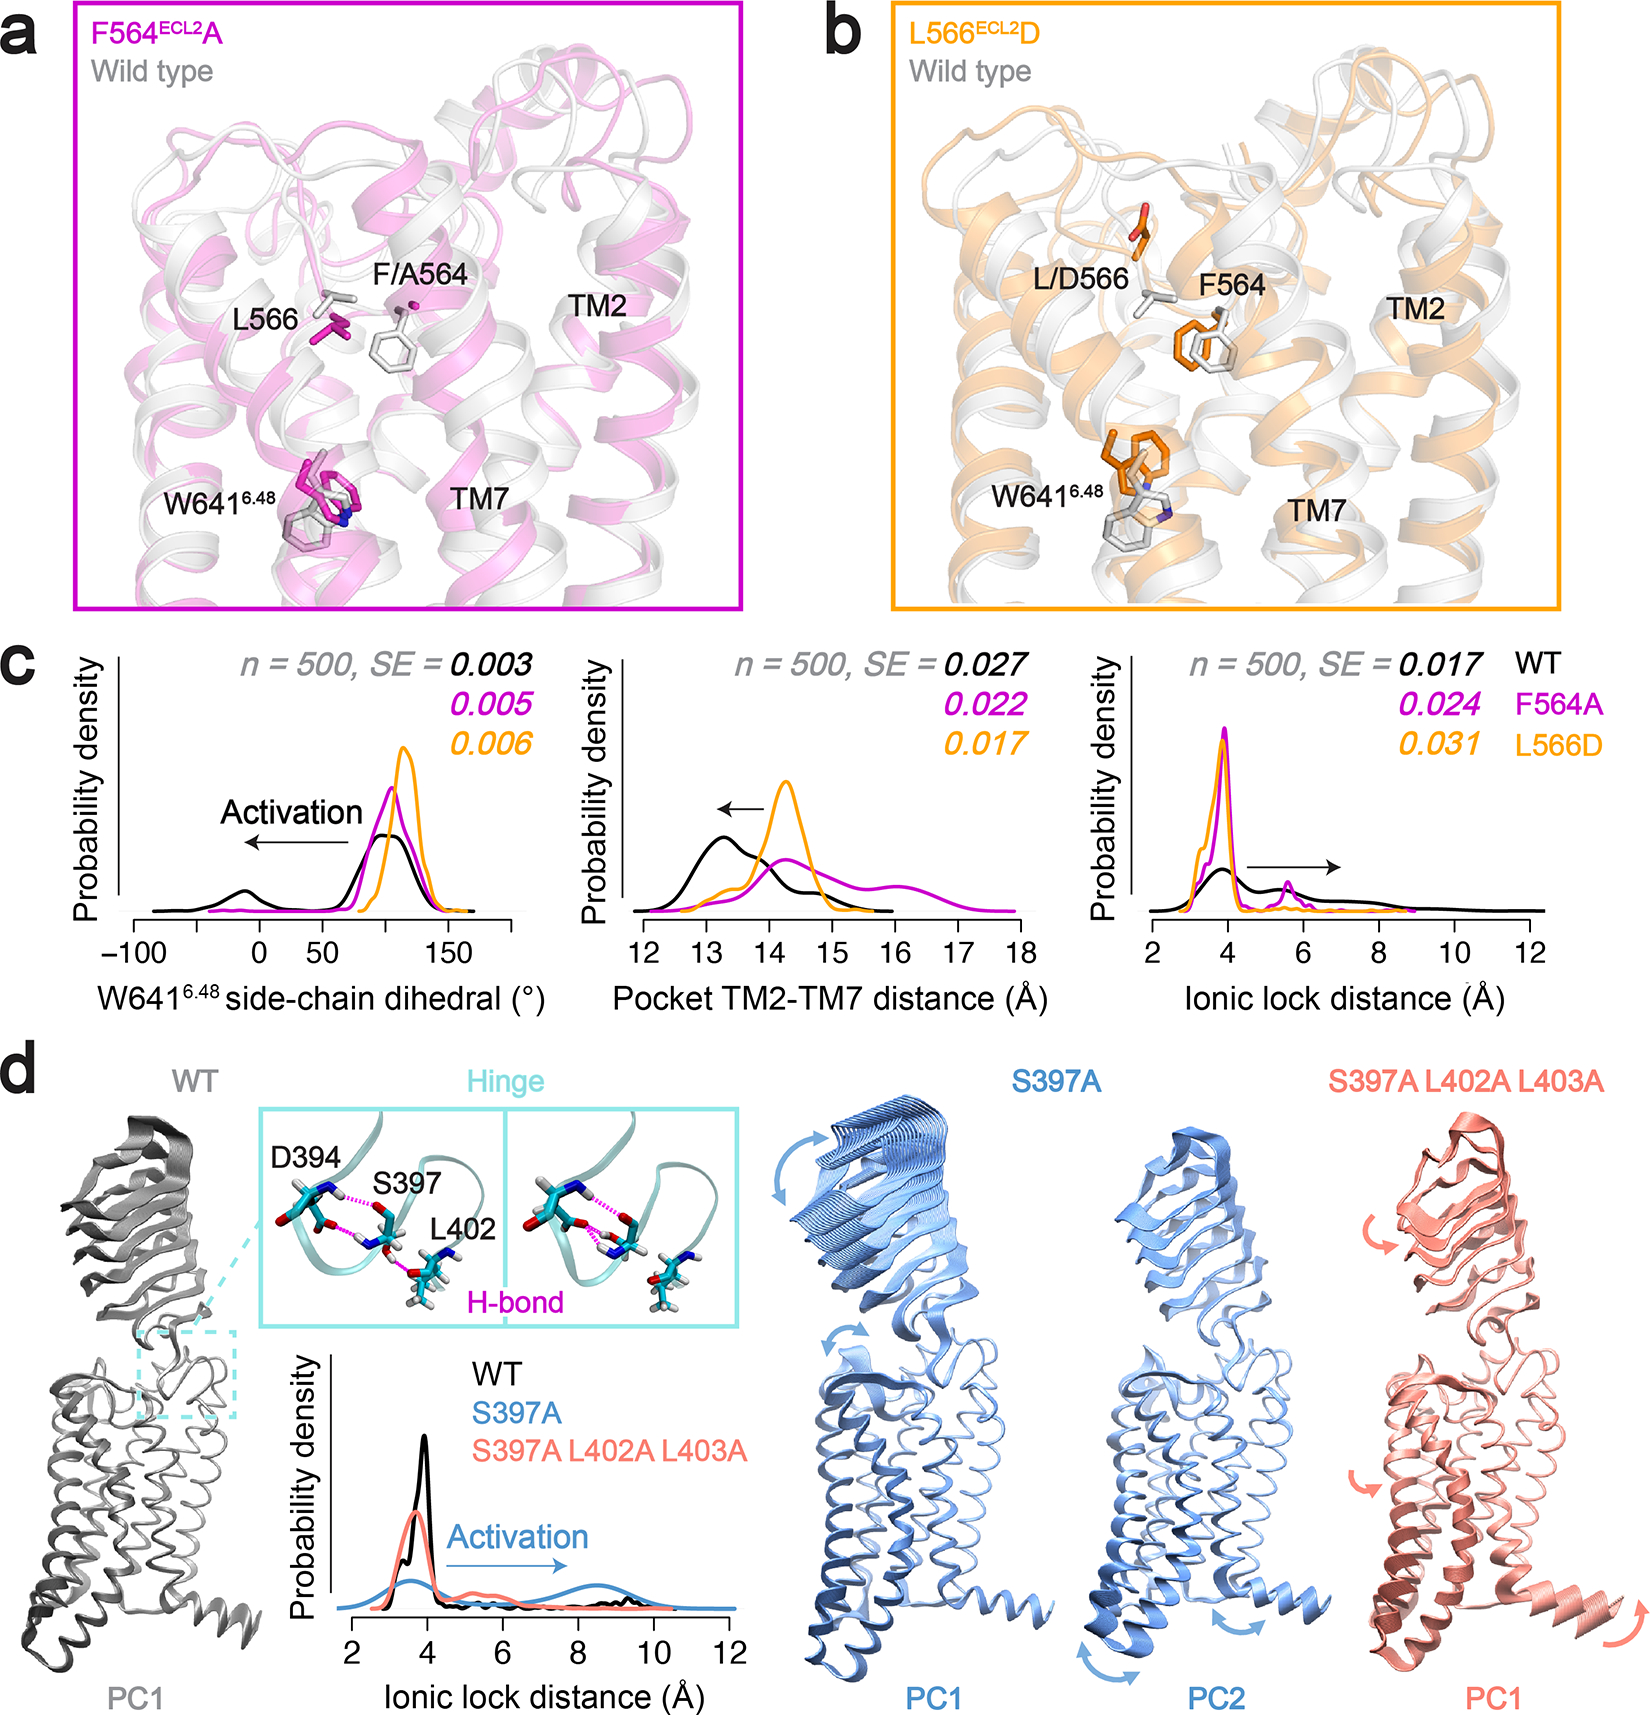
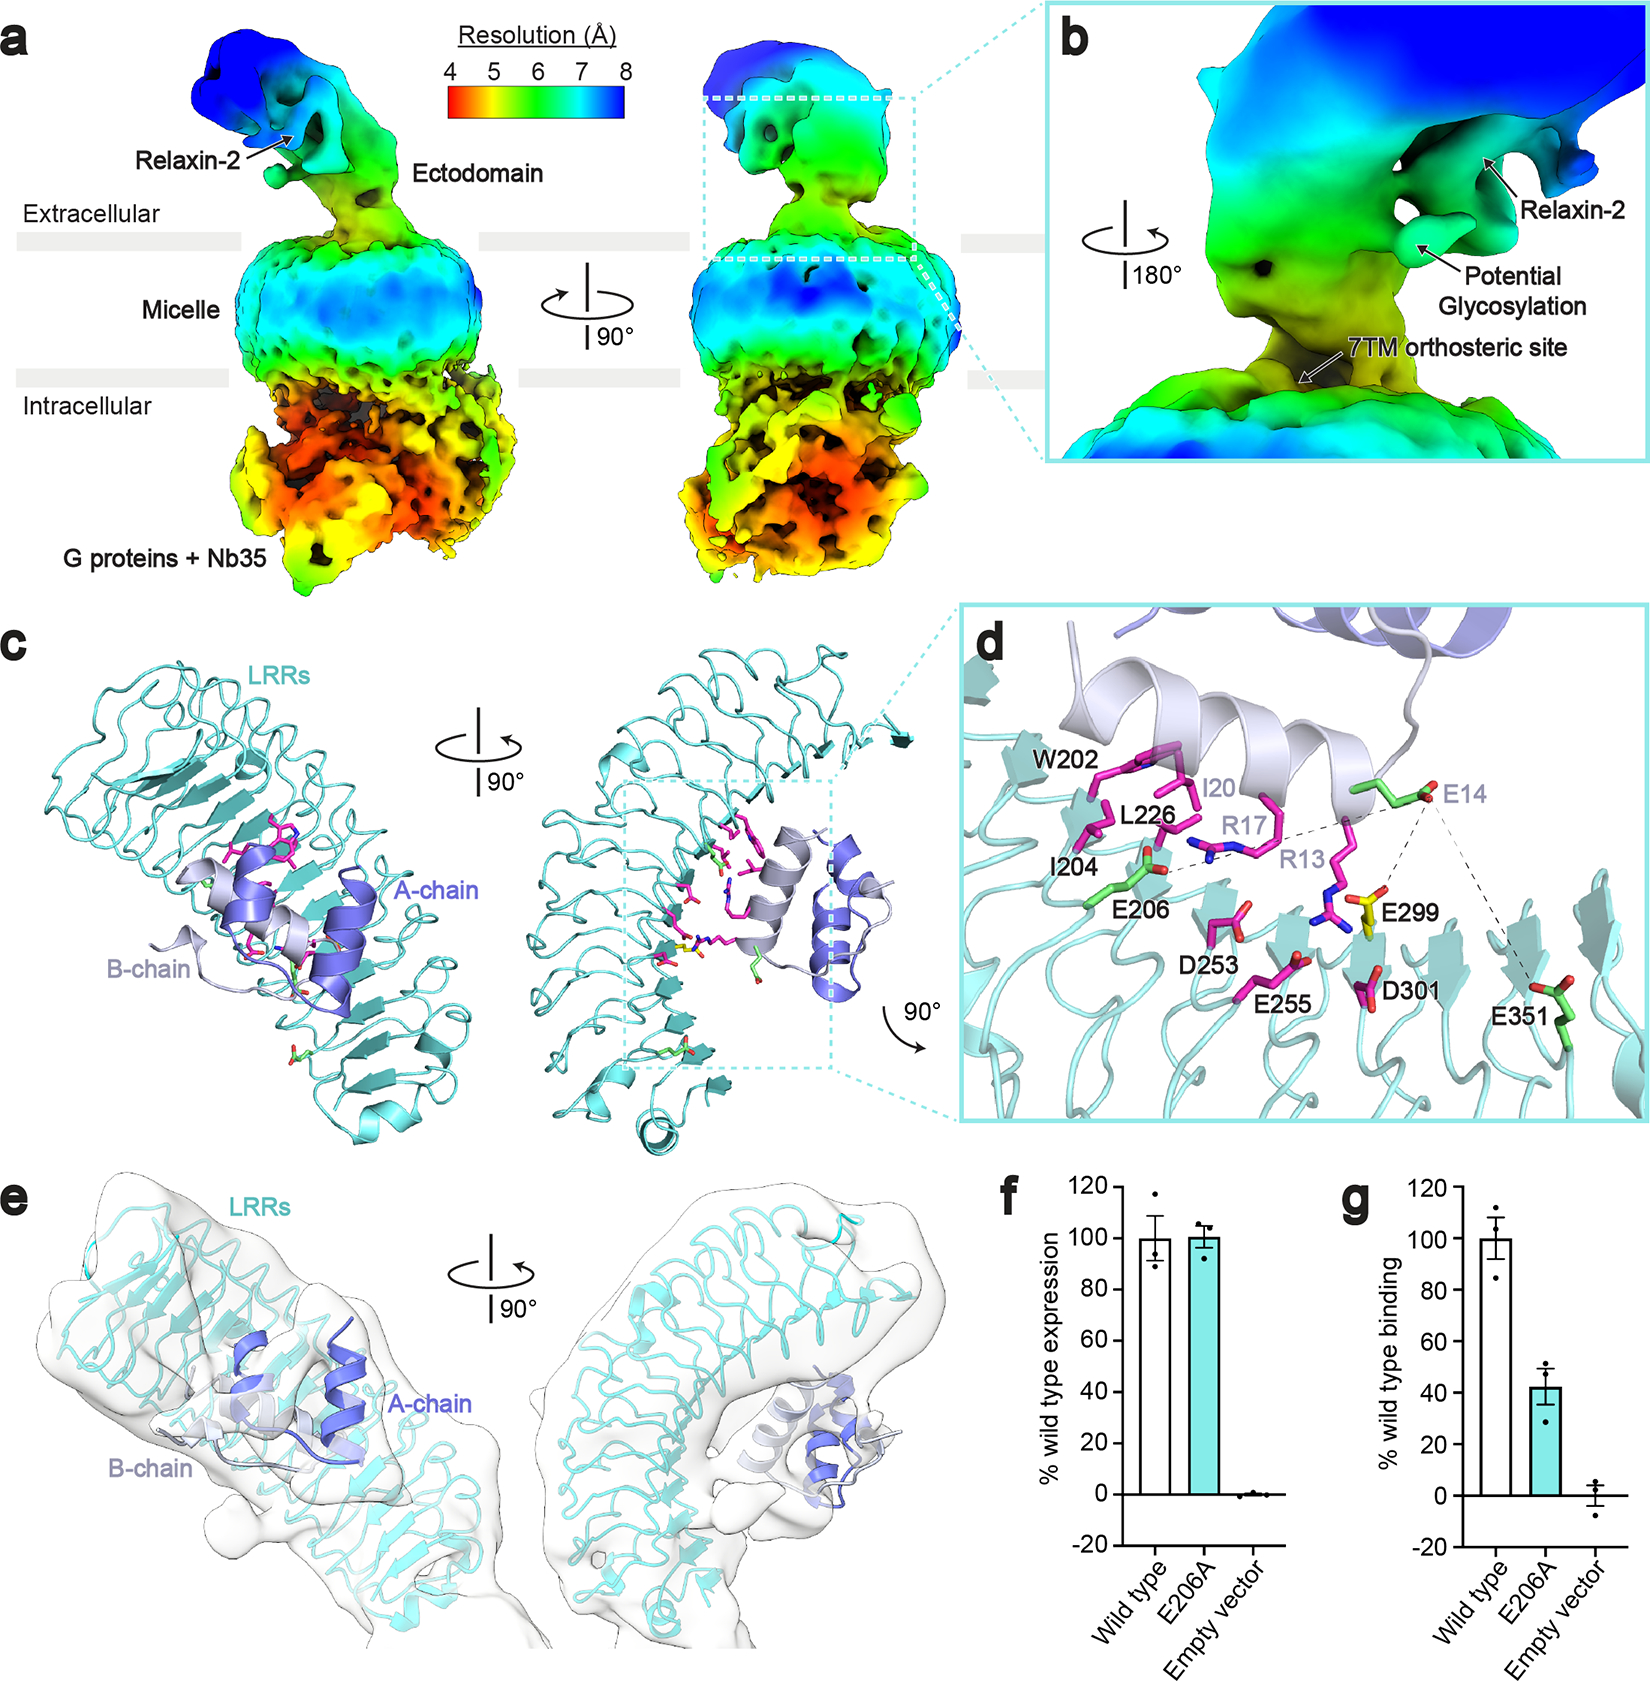
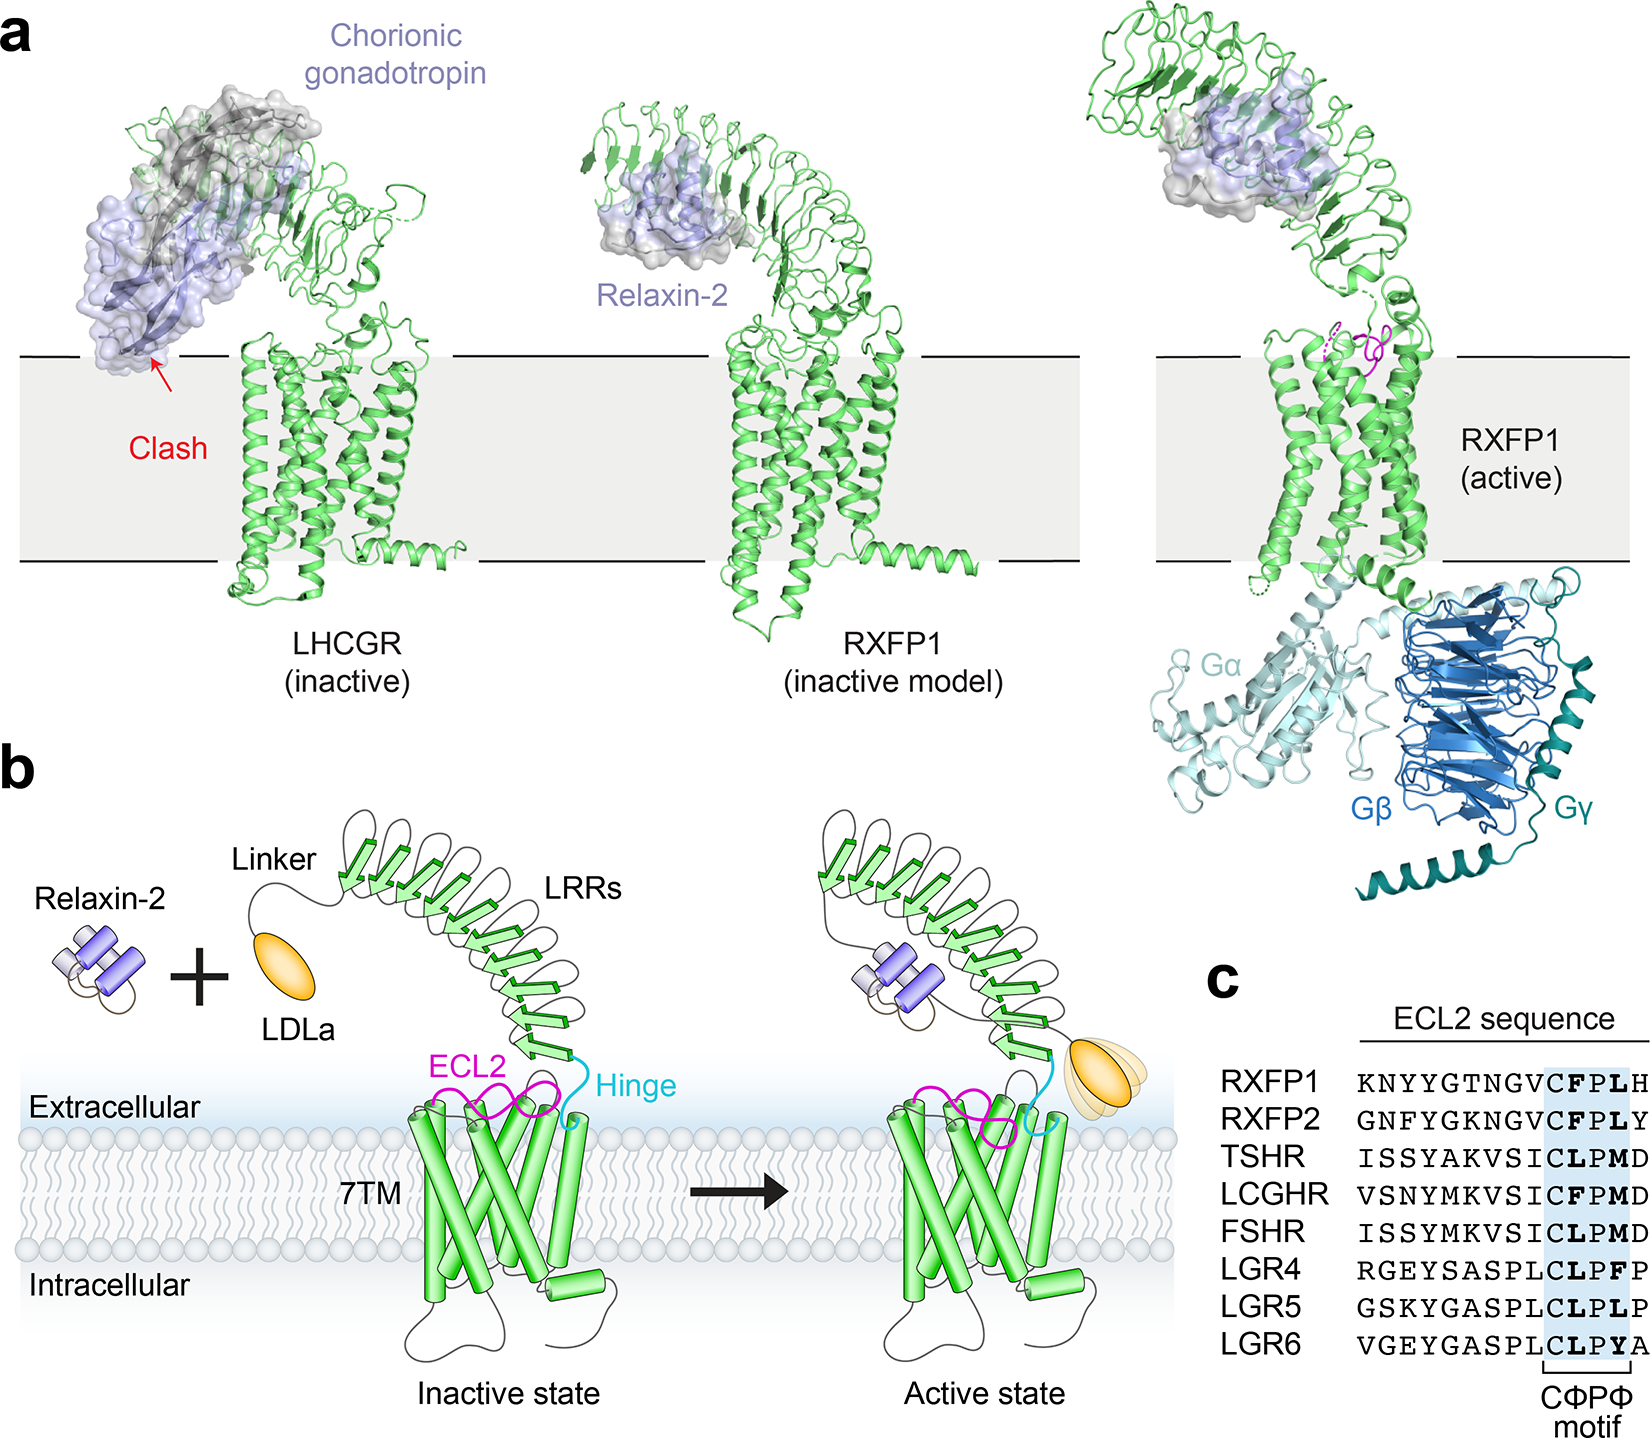
The relaxin family peptide receptor 1 (RXFP1) is the receptor for relaxin-2, an important regulator of reproductive and cardiovascular physiology. RXFP1 is a multi-domain G protein-coupled receptor (GPCR) with an ectodomain consisting of a low-density lipoprotein receptor class A (LDLa) module and leucine-rich repeats. The mechanism of RXFP1 signal transduction is clearly distinct from that of other GPCRs, but remains very poorly understood. In the present study, we determine the cryo-electron microscopy structure of active-state human RXFP1, bound to a single-chain version of the endogenous agonist relaxin-2 and the heterotrimeric Gs protein. Evolutionary coupling analysis and structure-guided functional experiments reveal that RXFP1 signals through a mechanism of autoinhibition. Our results explain how an unusual GPCR family functions, providing a path to rational drug development targeting the relaxin receptors.


Conflict of interest statement

Competing interests statement

A.C.K. and S.C.E. are inventors on a patent application for engineered single-chain relaxin proteins. A.C.K. is a co-founder and consultant for Tectonic Therapeutic and Seismic Therapeutic and for the Institute for Protein Innovation, a non-profit research institute. D.S.M. is a co-founder of Seismic Therapeutic, a consultant for Tectonic Therapeutic, Dyno Therapeutics, Jura Bio, Octant Bio, and a venture partner at Catalio Capital Management. The remaining authors declare no competing interests.

Figures

Extended Data Figure 1 |
Extended Data Figure 1 |. Engineering and purification of the RXFP1–Gs complex.
a, Diagram of the primary structure of RXFP1 domains versus the RXFP1-miniGs399–20res fusion construct. b, Flow cytometry cell surface expression tests in Expi293F tetR cells for RXFP1-miniGs fusion constructs. Data is mean ± s.e.m., n = 3 technical replicates. c, Gs signaling assay comparing the signaling levels of wild type RXFP1 versus RXFP1-miniGs399–20res in response to relaxin-2. Data is mean ± s.e.m., n = 3 technical replicates. d, Size exclusion chromatography profile for the RXFP1–Gs complex. Arrow indicates the peak fractions pooled for RXFP1–Gs. e, Coomassie-stained SDS-PAGE gel for the RXFP1–Gs complex (Representative from 8 purification gels). f, Flow cytometry competition binding assay for SE001. SE001 competes with 200 nM SE301 for binding to wild type RXFP1. The Ki for SE001 was calculated to be 3.9 nM; data is mean ± s.e.m., n = 3 technical replicates.
Extended Data Figure 2 |
Extended Data Figure 2 |. Cryo-EM data processing for the 7TM domain of RXFP1–Gs.
a, Cryo-EM data processing scheme for the 7TM domain of RXFP1 in complex with Gs. Shown are representative processing steps for one of four individual datasets and the steps used for the combined datasets. b, Representative micrograph from the RXFP1–Gs complex datasets (Scale bar = 50 nm; from 13,457 micrographs). c, Two-dimensional class averages for the 7TM domain of RXFP1 and G proteins. d, Angular distribution of particles in the final refinement for the 7TM domain with G proteins. e, Fourier shell correlation (FSC) used to determine the overall map resolution. f, Map to model FSC curve. g, cryoSPARC non-uniform refinement map colored by local resolution.
Extended Data Figure 3 |
Extended Data Figure 3 |. Cryo-EM data processing for the full-length RXFP1–Gs complex.
a, Cryo-EM data processing scheme for full-length RXFP1 in complex with Gs. Shown are representative processing steps for one of four individual datasets and the steps used for the combined datasets. b, Two-dimensional class averages for the full-length RXFP1–Gs complex. c, FSC used to determine the overall resolution of the map. d, RELION map of the full-length RXFP1 complex colored by local resolution at two different contour levels to display both the TM helices and receptor ectodomain.
Extended Data Figure 4 |
Extended Data Figure 4 |. Alignments of RXFP1’s ECL2 with GPR52 and family A orthosteric agonists.
Alignment of active-state RXFP1 (green, with ECL2 in magenta) (a), the β2 adrenergic receptor (gray) bound to adrenaline (purple; PDB ID: 4LDO) (b), and the angiotensin II type I receptor (gray) bound to the angiotensin II analog S1I8 (purple; PDB ID: 6DO1) (c), with GPR52 (gray with ECL2 in purple; PDB ID: 6LI3)
Extended Data Figure 5 |
Extended Data Figure 5 |. Cell surface expression and SE301 binding for RXFP1 constructs.
a-d, Flow cytometry cell surface expression tests with HEK293T cells for RXFP1 ECL2 mutants (a), Leu402 and Leu403 hinge region mutants (b), ectodomain truncation constructs (c), and evolutionary coupling analysis Ile396 and Ser397 hinge mutants (d). Data is mean ± s.e.m., n = 3 technical replicates. Cell surface expression was calculated as a percentage of wild type RXFP1 expression level. e-f, Ratio of SE301 (Fc-tagged relaxin-2) binding to receptor expression for flow cytometry binding assays in Expi293F cells. The ratio is calculated by dividing the mean fluorescence intensity (MFI) of SE301 binding by the MFI of the expression level. Data is mean ± s.e.m., n = 3 technical replicates. Deletion or mutations to the linker region reduce the ratio of binding to expression, while LDLa deletions and ECL2 mutations retain an ability to bind SE301 (e). Ectodomain deletions (7TM + β2N-term) reduce the ratio of binding to expression, while mutations to the hinge region maintain an ability to bind SE301 (f).
Extended Data Figure 6 |
Extended Data Figure 6 |. Evolutionary coupling analysis of RXFP1.
a, Evolutionary couplings for RXFP1 residues 405–689 (black) compared to the active-state structure contacts (green) show close agreement between predicted contacts from ECs and the cryo-EM model. b, Evolutionary couplings for RXFP1 residues 120–757 (black) compared to the active-state 7TM structure and LRR AlphaFold2 model contacts (blue), highlighting ECL2 evolutionary couplings that provide insight into two potential loop conformations in magenta (T559ECL2–Ile396, Gly561ECL2–Ser397, Phe564ECL2–Ile396, Phe564ECL2–Val6667.38). c, Diagram of RXFP1 domains. Stars indicate regions of RXFP1 containing residues with the highest scoring ECs with ECL2, TM7 and the hinge region. d, The Phe564ECL2 and Val6667.38 residues from evolutionary coupling analysis are in close contact in the RXFP1 active-state structure.
Extended Data Figure 7 |
Extended Data Figure 7 |. Molecular dynamics of RXFP1 7TM deactivation.
a, The truncated 7TM domain is deactivated by adding a sodium in the conserved sodium-binding site. This leads to an inactive state during the simulations that closely resembles the AlphaFold2 model. b-c, Ionic lock distance and Cα RMSD of the TM region with respect to the AlphaFold2 model. Shown here are probability density distributions during 50 ns of REST2-MD simulations (10 frames/ns, n = 500). SE, integrated squared error between the density estimate and a standard normal density function. Vertical dashed lines indicated the values in the AlphaFold2 model and in the initial model based on cryo-EM.
Extended Data Figure 8 |
Extended Data Figure 8 |. Principal component analysis.
Principal component analysis of halfLRRs-7TM WT, S397A, and S397A/L402A/L403A are presented together. a-b, Projection of the simulation frames onto the 2D and 3D spaces defined by the 3 largest global PCs, covering 38.58%, 22.03% and 11.17% of the total variance, respectively. Dashed circle indicates (roughly) the active-like conformations of halfLRRs-7TM S397A. c, Conformational variance associated with PC3, reflecting TM6 opening of the S397A mutant upon activation. The same PC was found in the analysis of the S397A mutant alone (PC2 in Fig. 3d). For clarity, only 50 frames per system (1 frame/ns) are shown here.
Extended Data Figure 9 |
Extended Data Figure 9 |. Comparison of LHCGR and RXFP1 structures.
a-b, The hybrid model of active-state RXFP1 (based on our 7TM domain structure, cryo-EM maps, and AlphaFold2 model of the LRRs with docked relaxin-2 hormone) compared to active-state LHCGR (PDB ID: 7FIG) and inactive-state LHCGR (PDB ID: 7FIJ). The receptors are aligned on the 7TM domain. b-c, Side views (b) and top view (c) of the hybrid model of active-state RXFP1 compared to active-state LHCGR (PDB ID: 7FIG). The receptors are aligned on the 7TM domain and the ligands (relaxin-2 and chorionic gonadotropin) not displayed in order to highlight differences in active-state LRR orientations.
Extended Data Figure 10 |
Extended Data Figure 10 |. Signaling of RXFP1 constructs by the small molecule agonist ML290.
a, Gs signaling at wild type RXFP1 and ECL2 mutants at basal levels and in response to 490 nM ML290. Data is mean ± s.e.m., n = 3 technical replicates. b, Gs signaling at constructs of the RXFP1 7TM domain fused to the β2 adrenergic receptor N-terminus at basal levels and in response to 490 nM ML290. Data is mean ± s.e.m., n = 3 technical replicates.
Fig. 1 |
Fig. 1 |. Cryo-EM map and model of the RXFP1–Gs complex.
a, Diagram of the primary structure of RXFP1 domains. The domains of the receptor ectodomain (black and white) were not built in the RXFP1–Gs atomic model. b-c, Cryo-EM map (b) and model (c) of the RXFP1–Gs complex 7TM domain with heterotrimeric Gs proteins and Nb35.
Fig. 2 |
Fig. 2 |. Regulation of receptor signaling by ECL2 and the ectodomain.
a, The conformation of ECL2 and the hinge region in active-state RXFP1. b, Details of ECL2 in the 7TM orthosteric site and interactions between ECL2 and the hinge region. c-d, The effect of ECL2 (c) and Leu402 and Leu403 hinge region (d) mutations in an assay for Gs signaling by RXFP1. Data are mean ± s.e.m., n = 3 technical replicates. e-f, Basal signaling and signaling in response to 50 nM relaxin-2 for RXFP1 ectodomain truncation constructs (e) and Ile396 and Ser397 hinge region mutations (f) in assay for Gs signaling. Data are mean ± s.e.m., n = 9 technical replicates.
Fig. 3 |
Fig. 3 |. Molecular dynamics of RXFP1 starting from the inactive-state AlphaFold2 model.
a-b, The truncated RXFP1 7TM domain alone shows autoactivation. Autoactivation in these simulations is impaired by the addition of the F564A (a) or the L566D mutations (b). c, Probability density distributions of activation-related conformational differences between WT, F564A, and L566D RXFP1 7TM models, including the distance between TM2 and TM7 in the orthosteric site, side-chain flips of the toggle switch residue W6416.48, and the ionic lock distance. The probability density was estimated with a non-parametric method and Gaussian kernel. SE, integrated squared error between the density estimate and normal density function (n = 500). d, Molecular dynamics of truncated RXFP1 halfLRRs-7TM. Projection of the trajectories on the first and second principal components (PC) illustrates the mechanism of S397A-induced basal activity. The S397A mutation disrupts the H-bonds with L402 (backbone) and D394 (side chain) present in the WT (Supplementary Table 8). The hinge and LRRs become more mobile in the S397A mutant, which triggers activation through ECL2. Addition of the L402A/L403A mutations reduces the steric hindrance of the hinge and leads to an overall twist of the receptor, which attenuates the activation effect of S397A.
Fig. 4 |
Fig. 4 |. Cryo-EM and crosslinking mass spectrometry reveal interactions between relaxin-2 and the leucine-rich repeats.
a, Local resolution cryo-EM map of the full-length RXFP1–Gs complex. b, The relaxin-2 binding site is above and rotated away from the 7TM orthosteric site. c, Model of the relaxin-2–LRR interaction from HADDOCK. d, Details of the relaxin-2–LRR interface with residues identified in published binding studies in magenta, residues from CLMS in green, and Glu299 from both CLMS and published binding studies in yellow. Crosslink distances: Glu14B-chain–Glu206 = 14.6 Å, Glu14B-chain–Glu299 = 10 Å, Glu14B-chain–Glu351 = 11.4 Å e, The relaxin-2–LRR model fit into the low resolution cryo-EM map. f-g, Receptor expression (f) and Fc-tagged relaxin-2 binding data (g) for the Glu206 to Ala mutation. Data are mean ± s.e.m., n = 3 technical replicates.
Fig. 5 |
Fig. 5 |. Model of RXFP1 activation by relaxin-2.
a, Model of LHCGR in the inactive conformation (PDB ID: 7FIJ) bound to the hormone chorionic gonadotropin, showing steric clash with the membrane that induces activation. In contrast, a similar potential conformation of RXFP1 would easily accommodate bound relaxin-2 (generated from alignments of inactive-state AlphaFold2 models of RXFP1’s LRRs and 7TM to PDB 7FIJ). A hybrid model of active-state RXFP1 is also shown for comparison, based on our 7TM domain structure, cryo-EM maps, and AlphaFold2 model of the LRRs with docked relaxin-2 hormone. The hybrid model uses Gγ2 from PDB 3SN6. b, The inactive state of RXFP1 is characterized by inhibitory interactions between ECL2, the hinge region, and the LRRs that prevent receptor activation, although the exact conformation of RXFP1 domains in this state remain undefined. Relaxin-2 binds to the concave side of the LRRs, away from the 7TM domain. Relaxin-2 binding leads to reorganization of the LDLa/hinge/ECL2 interface into the active state, allowing residues in both the hinge region and ECL2 to induce receptor signaling. The LDLa module is potentially mobile in RXFP1’s active state, based on the lack of density for this domain in our cryo-EM map. The temporal sequence of conformational changes remains to be determined. c, Sequence alignment of human LGRs showing the conserved CΦPΦ motif in ECL2.

Similar articles

Cited by

References

    1. Petrie EJ, Lagaida S, Sethi A, Bathgate RAD & Gooley PR In a class of their own - RXFP1 and RXFP2 are unique members of the LGR family. Front Endocrinol (Lausanne) 6, 1–9 (2015). - PMC - PubMed
    1. Sheau YH et al. Activation of orphan receptors by the hormone relaxin. Science (1979) 295, 671–674 (2002). - PubMed
    1. Maclennan AH, Nicolson R & Green RC Serum relaxin in pregnancy. The Lancet 328, 241–243 (1986). - PubMed
    1. Sarwar M, Du XJ, Dschietzig TB & Summers RJ The actions of relaxin on the human cardiovascular system. Br J Pharmacol 174, 933–949 (2017). - PMC - PubMed
    1. Devarakonda T & Salloum FN Heart disease and relaxin: New actions for an old hormone. Trends in Endocrinology and Metabolism 29, 338–348 (2018). - PMC - PubMed

Publication types

LinkOut - more resources