. 2023 May;30(5):703-709.
doi: 10.1038/s41594-023-00969-x. Epub 2023 Apr 20.

The RNA m6A landscape of mouse oocytes and preimplantation embryos

Affiliations

The RNA m6A landscape of mouse oocytes and preimplantation embryos

Yunhao Wang et al. Nat Struct Mol Biol. 2023 May.

Abstract

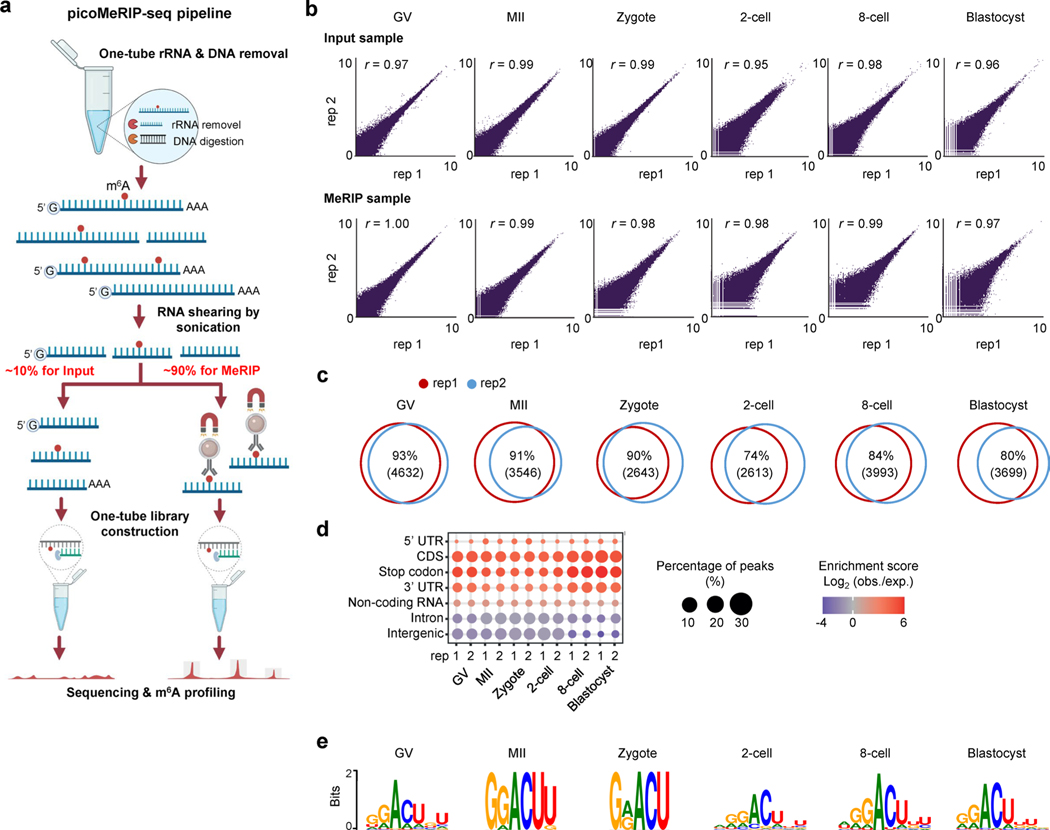
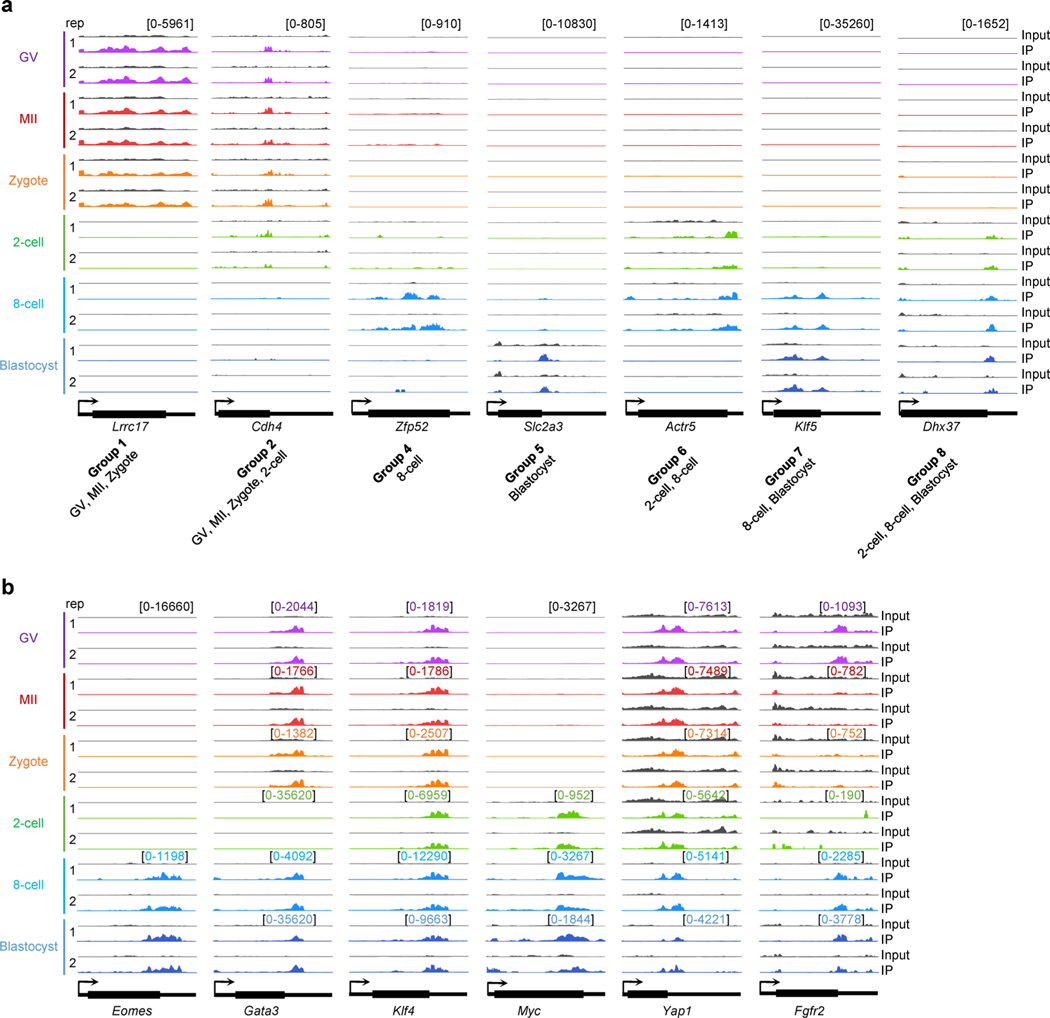
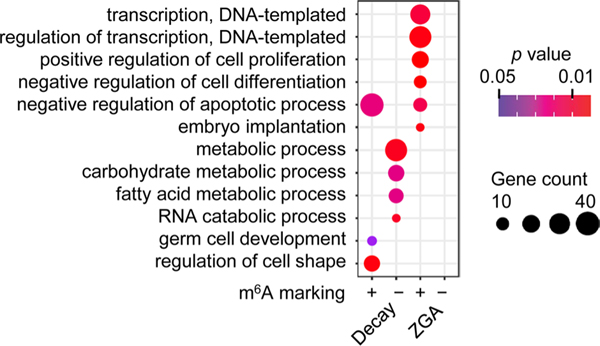
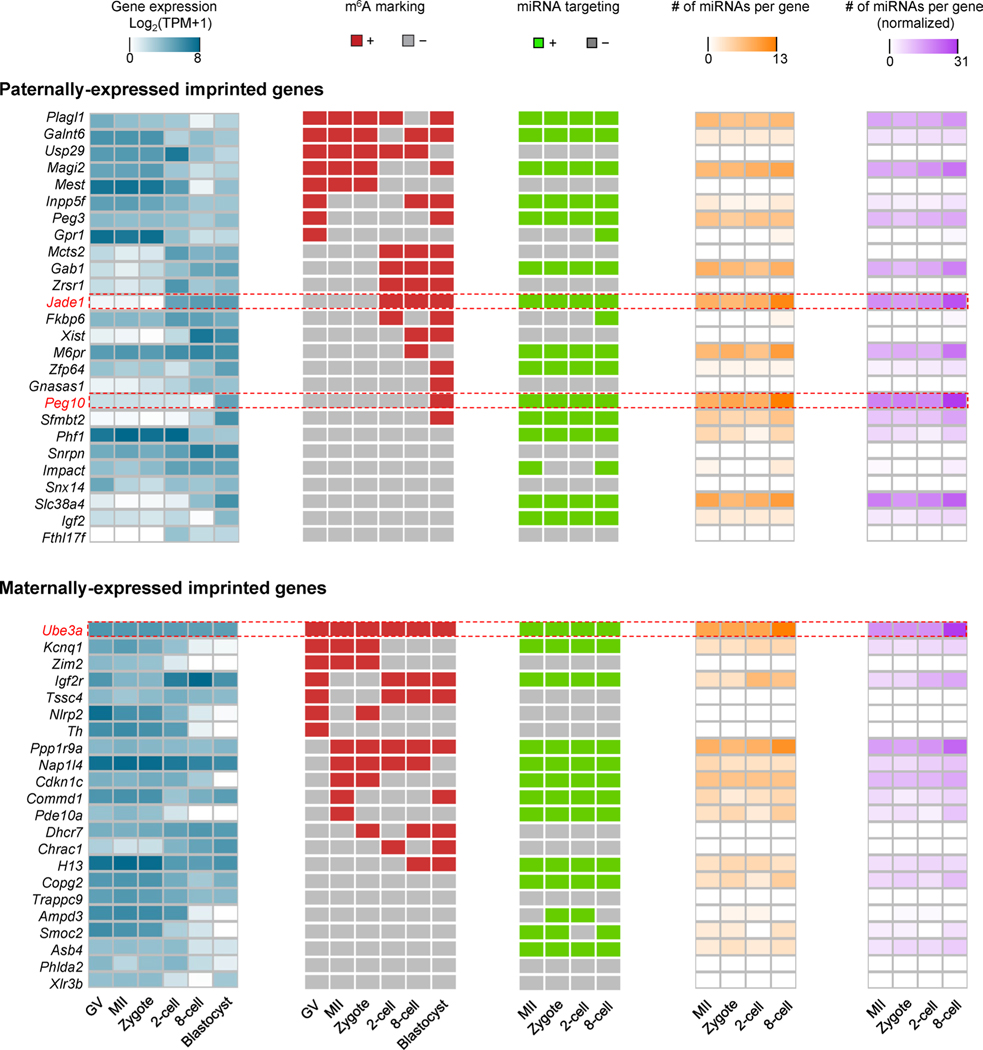
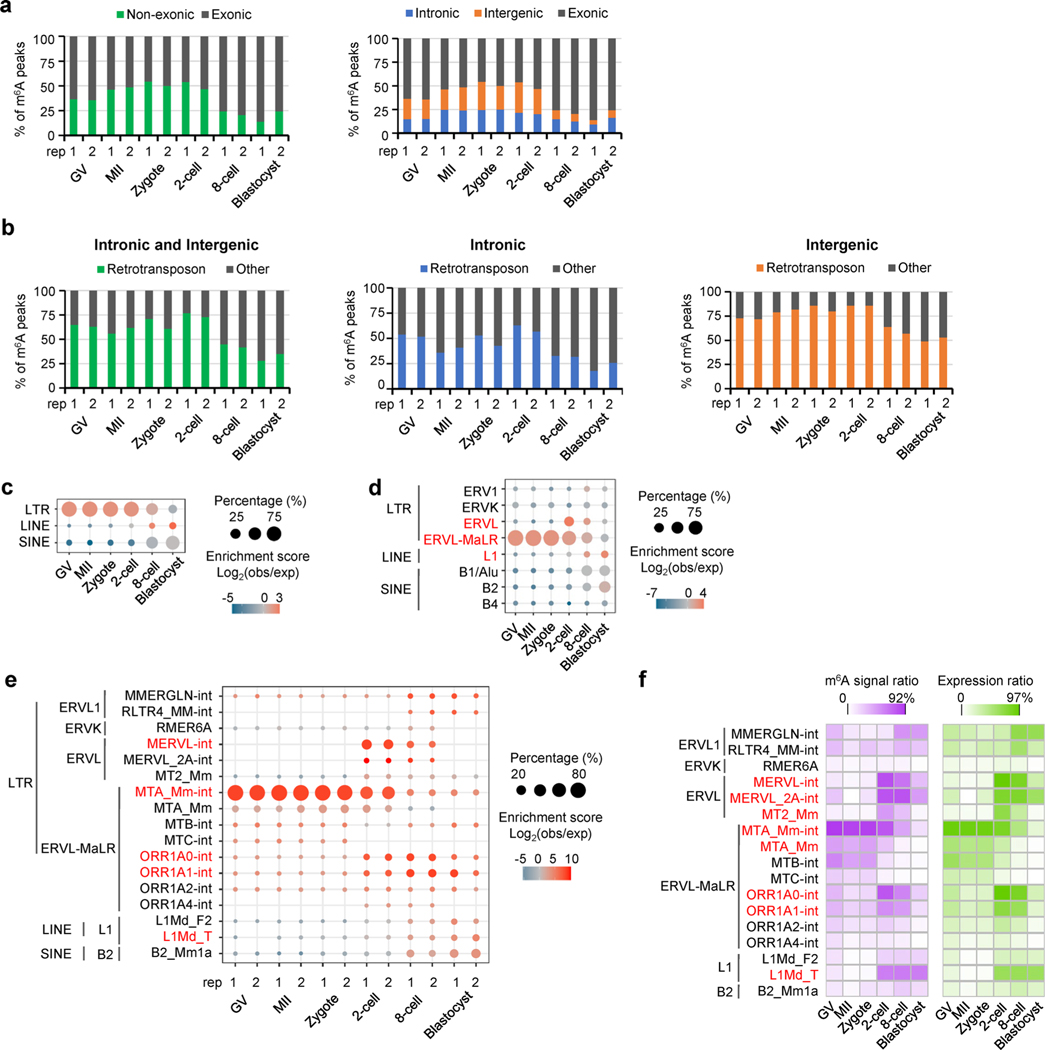
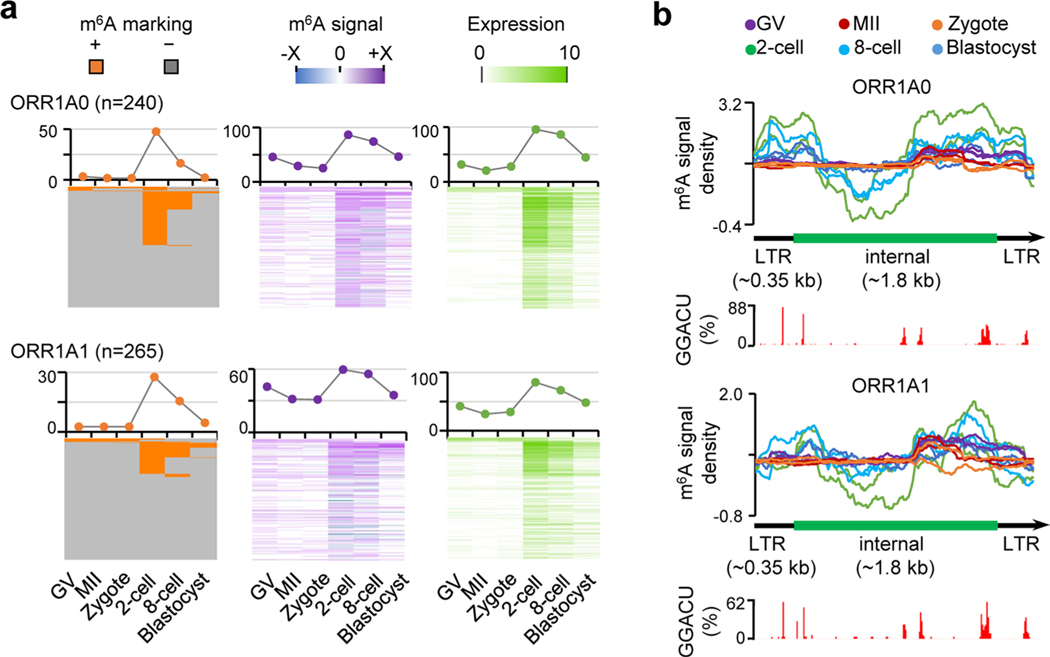
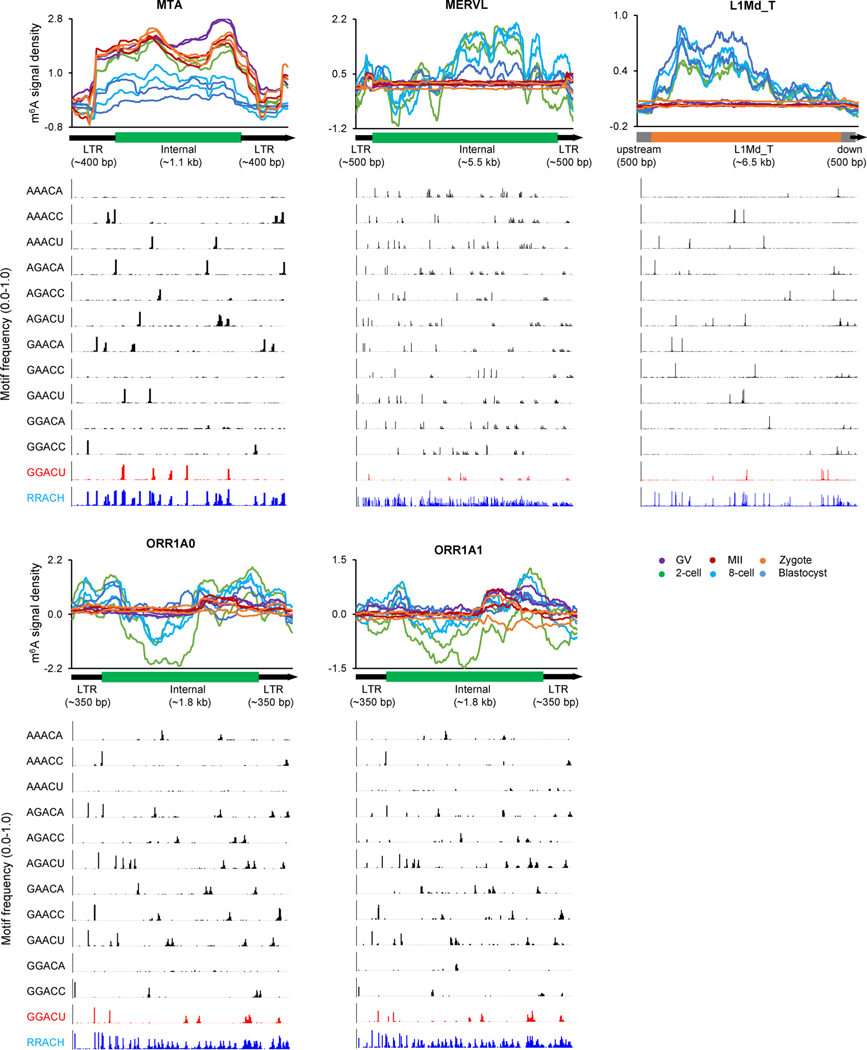
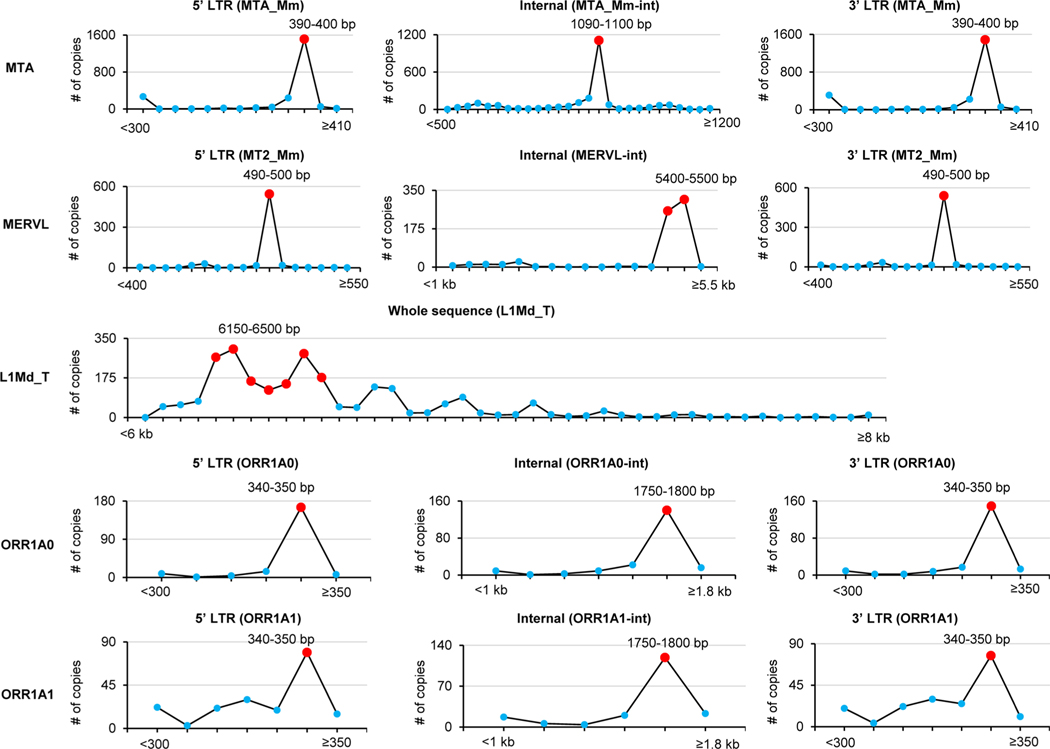
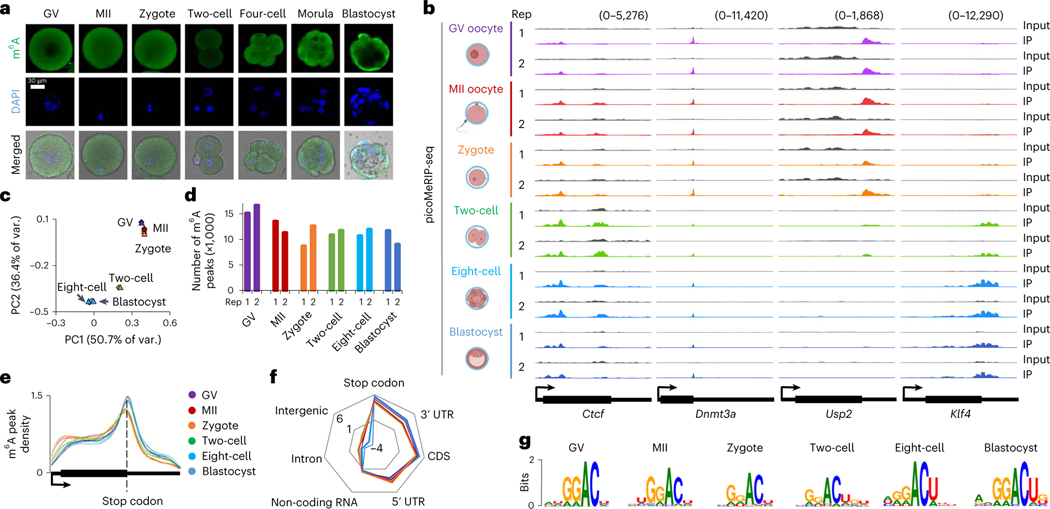
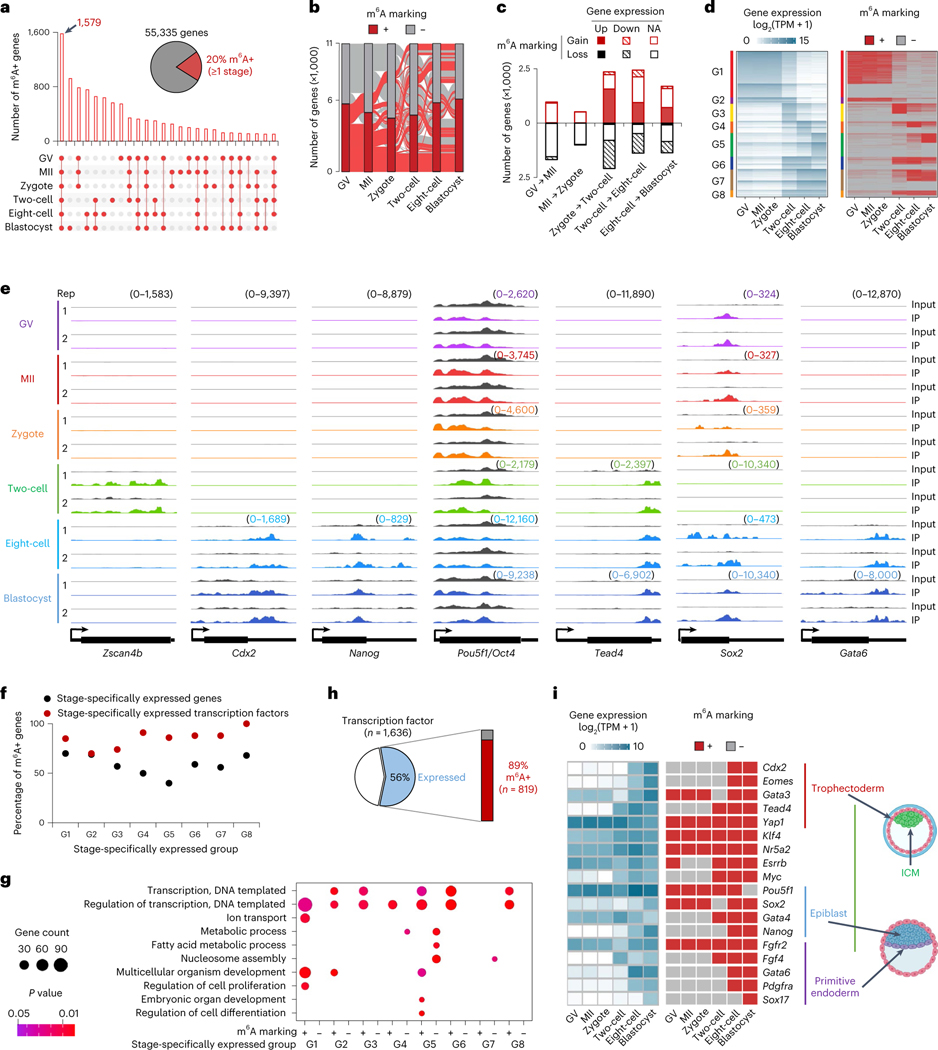
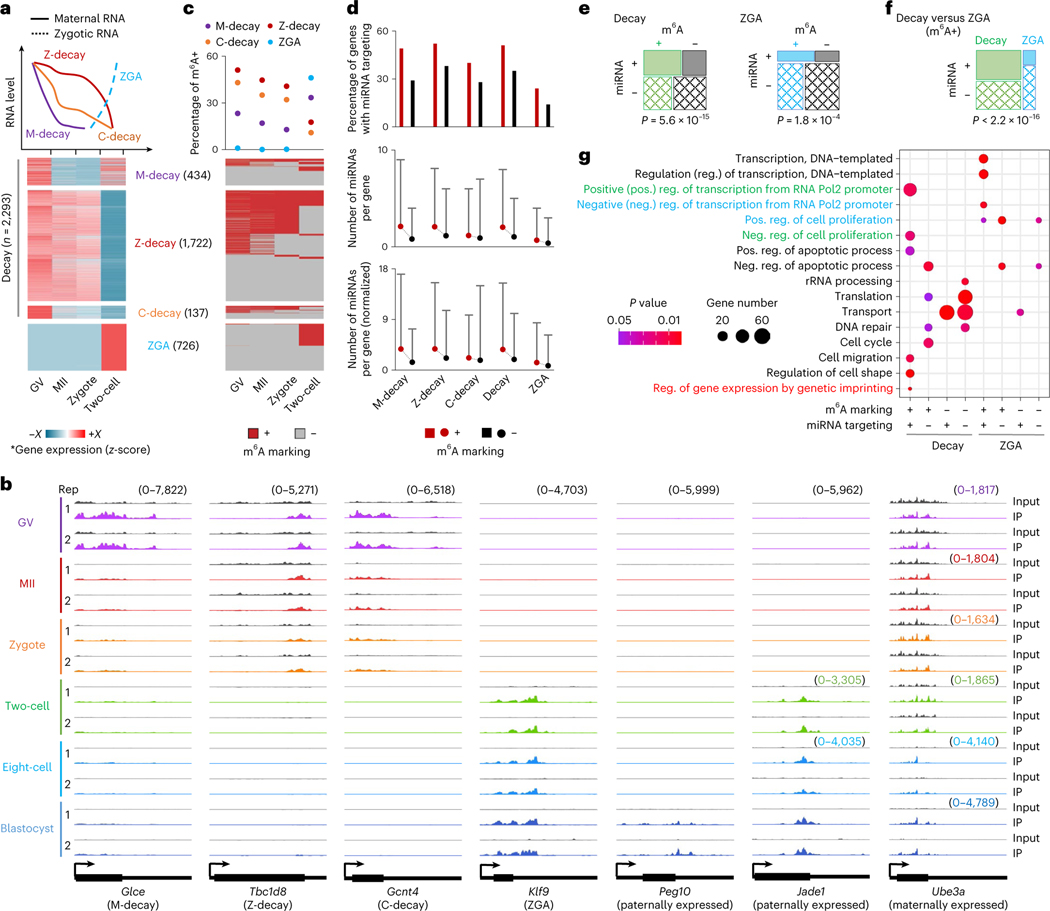
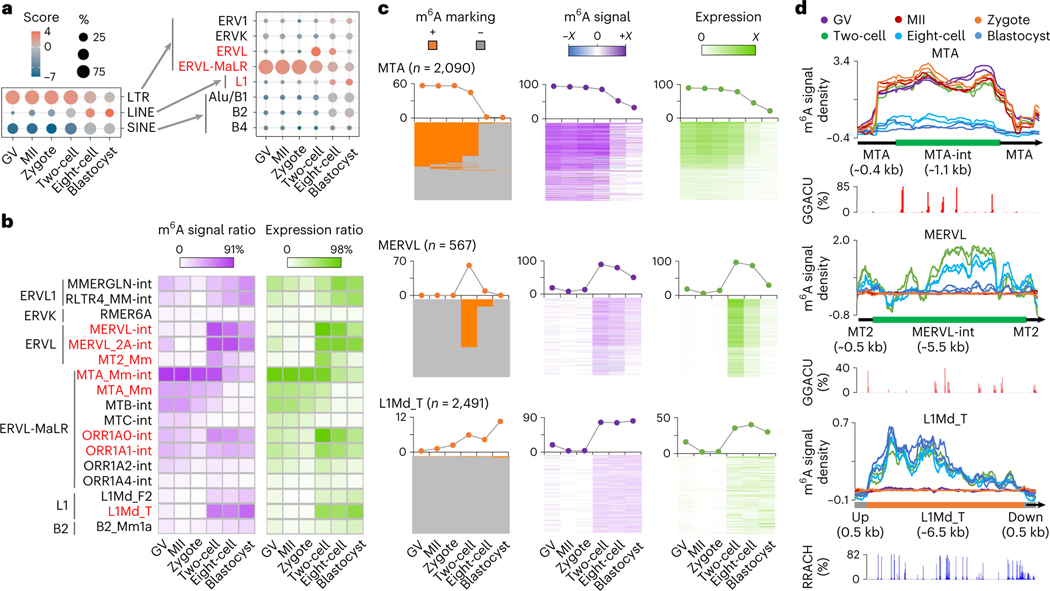
Despite the significance of N6-methyladenosine (m6A) in gene regulation, the requirement for large amounts of RNA has hindered m6A profiling in mammalian early embryos. Here we apply low-input methyl RNA immunoprecipitation and sequencing to map m6A in mouse oocytes and preimplantation embryos. We define the landscape of m6A during the maternal-to-zygotic transition, including stage-specifically expressed transcription factors essential for cell fate determination. Both the maternally inherited transcripts to be degraded post fertilization and the zygotically activated genes during zygotic genome activation are widely marked by m6A. In contrast to m6A-marked zygotic ally-activated genes, m6A-marked maternally inherited transcripts have a higher tendency to be targeted by microRNAs. Moreover, RNAs derived from retrotransposons, such as MTA that is maternally expressed and MERVL that is transcriptionally activated at the two-cell stage, are largely marked by m6A. Our results provide a foundation for future studies exploring the regulatory roles of m6A in mammalian early embryonic development.


Conflict of interest statement

Competing interests

The authors declare no competing interests.

Figures

Extended Data Fig. 1 |
Extended Data Fig. 1 |. picoMeRIP-seq pipeline and m6A profiles in mouse oocytes and preimplantation embryos.
(a) Workflow of picoMeRIP-seq, created with BioRender.com. (b) Pearson correlation analyses between two biological replicates of 6 stages. (c) Overlap analysis of m6A marked genes between two biological replicates. (d) Bubble plot showing the relative enrichment in different genomic features. For each feature, the enrichment score was calculated as the log2 ratio of the observed over expected peak numbers. (e) Consensus motifs identified using the peaks called in the biological replicate 2.
Extended Data Fig. 2 |
Extended Data Fig. 2 |. m6A profiles of repetitive stage-specifically expressed genes and key regulators for development of mouse preimplantation embryos.
(a) picoMeRIP-seq read density in exonic regions of stage-specifically expressed genes identified in Fig. 2d. (b) picoMeRIP-seq read density in exonic regions of key genes essential for mouse early embryonic development (listed in Fig. 2i). The sample-specific scale ranges are indicated in brackets with the corresponding colors.
Extended Data Fig. 3 |
Extended Data Fig. 3 |. GO analyses of m6A + and m6A − genes in Decay and ZGA genes identified in Fig. 3a, b.
Fishers exact test was used to calculate the one-sided P values. Only the GO terms with P value <0.05 are shown.
Extended Data Fig. 4 |
Extended Data Fig. 4 |. m6A marking and miRNA targeting profiles on imprinted genes.
Gene expression, m6A marking, miRNA targeting, number of miRNAs per gene, normalized number of miRNAs per gene in paternally- (upper panel) and maternally- (lower panel) expressed imprinted genes. For a given gene, the normalized number of miRNAs (last column, purple colored heat maps) is the sum of expression values of all miRNAs targeting this gene, where the expression value is log10 (RPM + 1). RPM, reads per million.
Extended Data Fig. 5 |
Extended Data Fig. 5 |. Abundant enrichment of m6A on retrotransposon-derived RNAs in mouse oocytes and early embryos.
(a) Percentage of m6A peaks overlapping with the non-exonic regions of annotated genes in GENCODE vM23 (left panel), including both intronic and intergenic regions (right panel). (b) Percentage of non-exonic m6A peaks overlapping with retrotransposons, considering both intronic and intergenic m6A peaks (left panel), intronic only (middle panel) and intergenic only (right panel). (c) Bubble plot showing the significant enrichment of m6A peaks in LTR (for GV, MII, zygote and 2-cell) and LINE (for 8-cell and blastocyst). For each of three types of retrotransposons, the enrichment score is calculated as the log2 ratio of the observed over expected peak numbers. Only the biological replicate 2 for each stage was plotted. (d) The same as in panel c, but for 8 major retrotransposon families. Only the biological replicate 2 for each stage was plotted. (e) The same as in panel c, but for representative retrotransposon subfamilies. (f) Heatmap plots showing the ratios of genomic copies/loci with >0 m6A signal score (MeRIP vs Input) and >0 expression value (RPKM), respectively (calculated using biological replicate 2), for representative retrotransposon subfamilies.
Extended Data Fig. 6 |
Extended Data Fig. 6 |. m6A profiles on ORR1A0 and ORR1A1 derived RNAs.
(a) m6A marking status, and m6A signal and expression profiles across the copies of ORR1A0 and ORR1A1. Only the internal sequences were considered here. The upper line plots show the percentage of copies/loci with m6A marking, >0 m6A signal value, >0 expression value. Color range of m6A signal: ORR1A0, −1.6 to 4.9, ORR1A1, −3.9 to 4.6. (b) m6A signal density pileups along the full-length ORR1A0 and ORR1A1 sequences. The lower bar plots show the frequency (bin size = 10 bp) of GGACU motif across all copies/loci along the full-length structure. See ‘Methods’ for more details.
Extended Data Fig. 7 |
Extended Data Fig. 7 |. m6A signal density and motif distributions along the full-length retrotransposon subfamilies.
For each of 5 subfamilies, the upper panels show m6A signal density pileups generated using the uniquelyaligned reads together with the randomly-assigned multiply-aligned reads. See ‘Methods’ for more details about the random assignment of multiply-aligned reads. The lower bar plots show the frequency (bin size = 10 bp) of RRACH motifs across all copies/loci along the full-length structure.
Extended Data Fig. 8 |
Extended Data Fig. 8 |. Length distribution of genomic copies of 5 subfamilies.
Statistics of lengths of all genomic copies for each subfamily. The length distributions were used as the cutoff to define the full-length MTA, MERVL and L1Md_T (Fig. 4d; Extended Data Fig. 7), as well as ORR1A0 and ORR1A1 (Extended Data Figs. 6b and 7) for plotting the m6A signal density pileups. In brief, for a given locus/copy, we defined it as full-length if the lengths of each part (5′ LTR, internal and 3′ LTR) were in the ranges indicated by the red colored balls which represent the most frequent lengths. See ‘Methods’ for more details.
Fig. 1 |
Fig. 1 |. RNA m6A landscapes of mouse oocytes and embryos.
a, m6A immunofluorescence staining. Experiments were repeated three times. b, Genome browser snapshot of picoMeRIP-seq read density in exonic regions of representative gene transcripts for the indicated oocyte and embryo stages. The oocyte and embryo cartoons were created with BioRender.com. c, PCA on 12 picoMeRIP-seq experiments from indicated oocyte and embryo stages. d, Number of m6A peaks. e, Metagene profiles of m6A peak distribution. f, Relative enrichment of m6A peaks for indicated genomic features. For each feature, the enrichment score was calculated as the log2 ratio of the observed over expected peak numbers. The colors of samples are the same as those in e. g, Consensus motifs on m6A peaks identified in biological replicate 1.
Fig. 2 |
Fig. 2 |. Characterization of m6A methylome dynamics during development.
a, Overview of shared and unique m6A marked (m6A+) genes for the indicated oocyte and embryo stages. b, Alluvial plot showing the dynamics in m6A marked genes between indicated oocyte and embryo stages. c, Genes gaining and losing m6A marking versus change in gene expression between consecutive oocyte and embryo stages. Each gene is denoted as Up, if the log2 of expression fold change of one stage versus the next is >1; Down, if <−1; NA, otherwise. d, Left: heat map of stage-specifically expressed genes categorized into eight major groups. Right: representation of genes marked by m6A or not in comparison with stage-specific expression. e, Genome browser snapshots of picoMeRIP-seq read density in exonic regions of the two-cell specifically expressed gene Zscan4b, and selected genes important to various stages of embryo development. The sample-specific scale ranges are indicated in brackets with the corresponding colors. f, Fractions of m6A marked genes within expressed genes (black dots), and within expressed transcription factors (red dots), respectively, at each stage-specifically expressed group (G1–G8 defined in d). Chi-squared test was performed to calculate the statistical significance (P values 2.9 × 10−4, 0.99, 1.2 × 10−2, 7.4 × 10−7, 2.1 × 10−11, 1.1 × 10−4, 2.0 × 10−5 and 1.7 × 10−4 for G1–G8, respectively) of m6A enrichment in expressed transcription factors versus the other expressed genes. g, GO analyses of genes marked (m6A+) or not marked (m6A−) by m6A. Stage-specifically expressed groups defined in d. Fisher’s exact test was used to calculate the one-sided P values. h, Fraction of all transcription factors that are expressed in oocytes or embryos and marked by m6A at ≥1 stage. i, Expression and m6A marking status of genes essential for the first and second lineage specification events in mouse early embryos. The embryo cartoons were created with BioRender.com.
Fig. 3 |
Fig. 3 |. m6A marking and miRNA targeting profiles on Decay and ZGA genes.
a, Definition of Decay and ZGA genes. Top: schematic plot over different expression patterns. Bottom: heat maps of relative gene expression across the four stages. b, Genome browser snapshots of picoMeRIP-seq read density in exonic regions of representative genes. The sample-specific scale ranges are indicated in brackets with the corresponding colors. c, m6A marking status of genes ordered according to a. d, Differential miRNA targeting between m6A+ and m6A− genes. Top: percentage of genes targeted by ≥1 miRNA. Middle: number of miRNAs per gene. Bottom: normalized number of miRNAs per gene, normalized to miRNA expression level. For more details, see Methods. For middle and bottom panels, the dot represents the mean value and the bar is the 95th quantile. e,f, Fisher’s exact test showing the significant miRNA targeting (vertical, ‘+’ for genes that are targeted by miRNA, ‘−’ for genes that are not targeted by miRNA) on m6A+ genes (horizontal, ‘+’ for genes that are marked with m6A, ‘−’ for genes that are not marked with m6A) in Decay and ZGA, respectively (e) and Decay versus ZGA (f). The area of the box represents gene count. For the definition of miRNA targeted genes, see the ‘miRNA analyses’ subsection of Methods. g, GO analyses of genes with different m6A marking and miRNA targeting states in Decay and ZGA genes. Fisher’s exact test was used to calculate the one-sided P values. *The gene expression is log2(TPM + 1), and then normalized by z-score across four stages. The color range (−X to +X): M-decay, −1.72 to 1.73; Z-decay, −1.73 to 1.63; C-decay, −1.44 to 1.73; ZGA, −0.71 to 1.73.
Fig. 4 |
Fig. 4 |. m6A deposition on retrotransposon-derived RNAs.
a, Relative enrichment of m6A peaks (identified in biological replicate 1) in eight major families from three types of retrotransposon. The enrichment score was calculated as the log2 ratio of the observed over expected peak numbers. b, Heat map plots showing the ratios of genomic copies/loci with >0 m6A signal score (MeRIP versus Input) and >0 expression value (RPKM), respectively (calculated using biological replicate 1), for representative retrotransposon subfamilies. c, m6A marking status, m6A signal and expression profiles across the loci of MTA, MERVL and L1Md_T. For MTA and MERVL, only the internal sequences were considered. The line plots above the heat maps show the percentages of loci with m6A+ (that is, overlap with m6A peaks, left), >0 m6A signal value (middle), >0 expression value (right), respectively. Color range of m6A signal: MTA, −4.9 to 7.2; MERVL, −0.7 to 3.9; L1Md_T, −1.1 to 1.8. Color range of expression (that is, averaged log2(RPKM)): MTA, 0 to 12; MERVL, 0 to 8; L1Md_T, 0 to 2. d, m6A signal density pileups along the full-length MTA, MERVL and L1Md_T loci. The lower bar plots show the frequency (bin size 10 bp) of GGACU or RRACH motifs across all loci along the full-length structure.

Similar articles

Cited by

References

    1. Zhao BS, Roundtree IA & He C. Post-transcriptional gene regulation by mRNA modifications. Nat. Rev. Mol. Cell Biol 18, 31–42 (2017). - PMC - PubMed
    1. Zaccara S, Ries RJ & Jaffrey SR Reading, writing and erasing mRNA methylation. Nat. Rev. Mol. Cell Biol 20, 608–624 (2019). - PubMed
    1. Klungland A, Dahl JA, Greggains G, Fedorcsak P. & Filipczyk A. Reversible RNA modifications in meiosis and pluripotency. Nat. Methods 14, 18–22 (2016). - PubMed
    1. Dominissini D. et al. Topology of the human and mouse m6A RNA methylomes revealed by m6A-seq. Nature 485, 201–206 (2012). - PubMed
    1. Meyer KD et al. Comprehensive analysis of mRNA methylation reveals enrichment in 3′ UTRs and near stop codons. Cell 149, 1635–1646 (2012). - PMC - PubMed

Publication types