

Basement membrane-related regulators for prediction of prognoses and responses to diverse therapies in hepatocellular carcinoma
- PMID: 37081465
- PMCID: PMC10116671
- DOI: 10.1186/s12920-023-01504-z
Basement membrane-related regulators for prediction of prognoses and responses to diverse therapies in hepatocellular carcinoma
Abstract
Background: Hepatocellular carcinoma (HCC) remains a global health threat. Finding a novel biomarker for assessing the prognosis and new therapeutic targets is vital to treating this patient population. Our study aimed to explore the contribution of basement membrane-related regulators (BMR) to prognostic assessment and therapeutic response prediction in HCC.
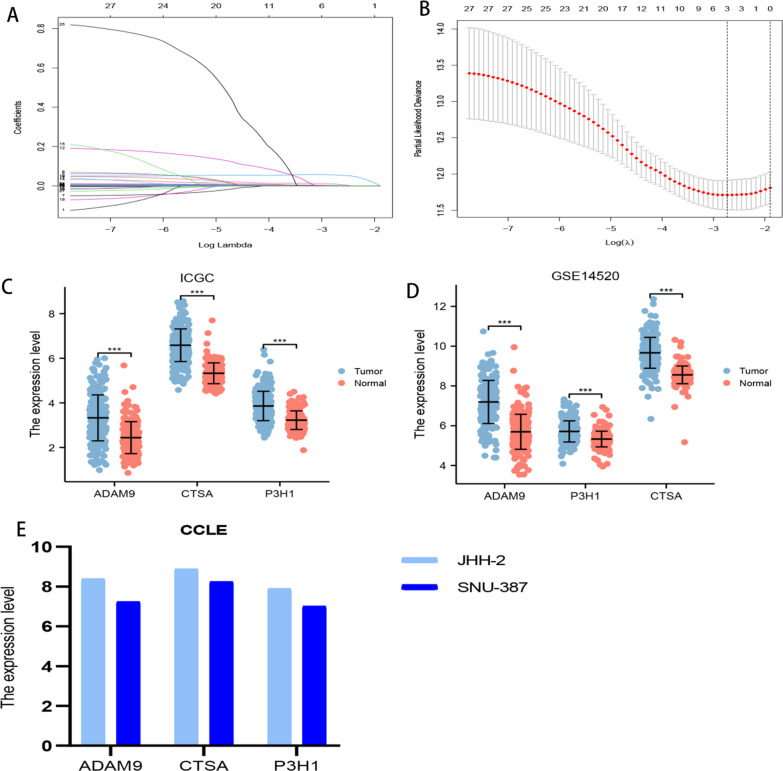
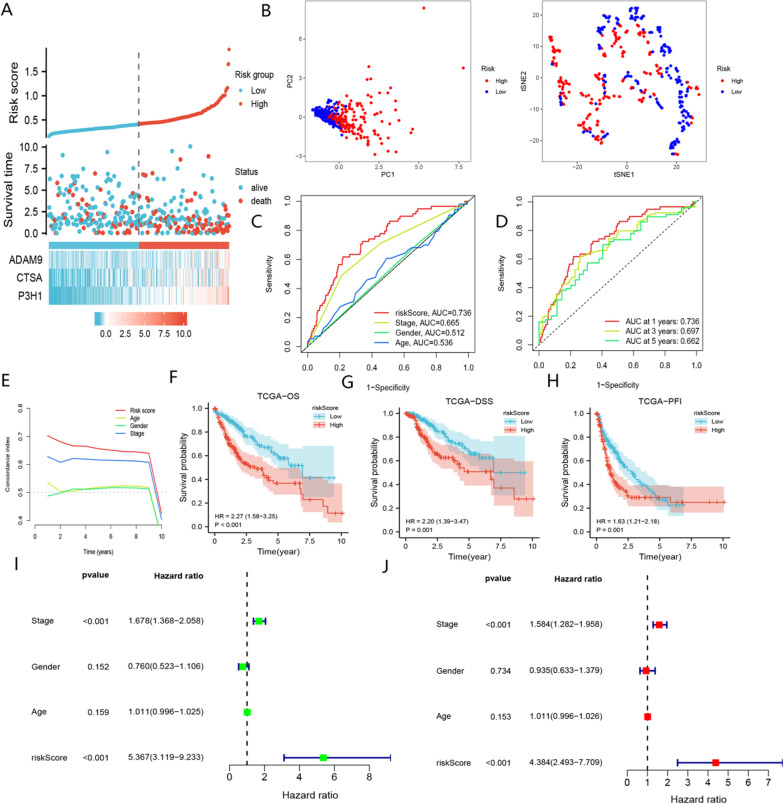
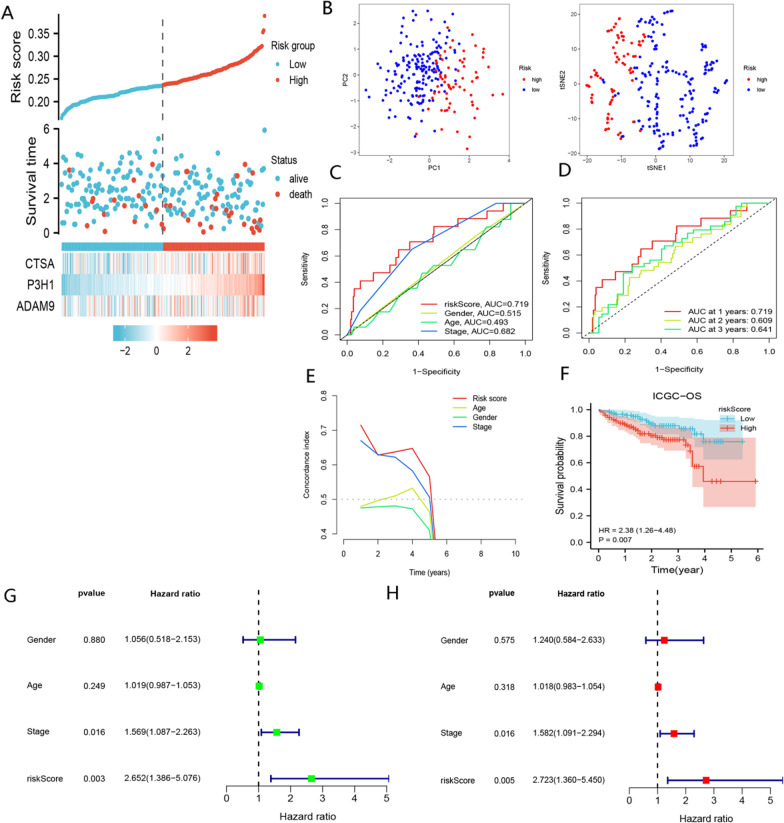
Material and methods: The RNA sequencing and clinical information of HCC were downloaded from TCGA-LIHC, ICGC-JP, GSE14520, GSE104580, and CCLE datasets. The BMR signature was created by the Least Absolute Shrinkage and Selection Operator (LASSO) algorithm and used to separate HCC patients into low- and high-risk groups. We conducted analyses using various R 4.1.3 software packages to compare prognoses and responses to immunotherapy, transcatheter arterial chemoembolization (TACE), and chemotherapeutic drugs between the groups. Additionally, stemness indices, molecular functions, and somatic mutation analyses were further explored in these subgroups.
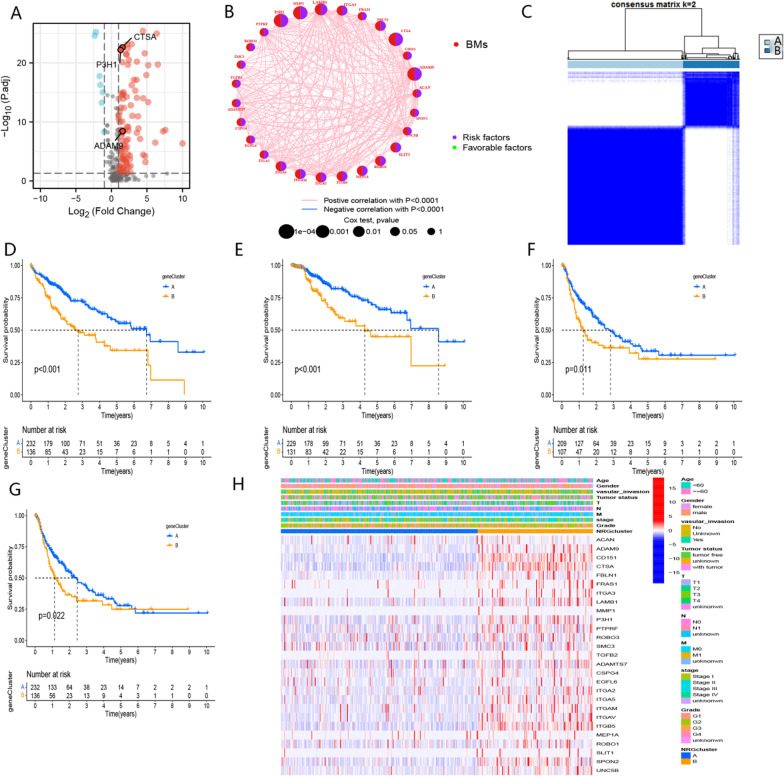
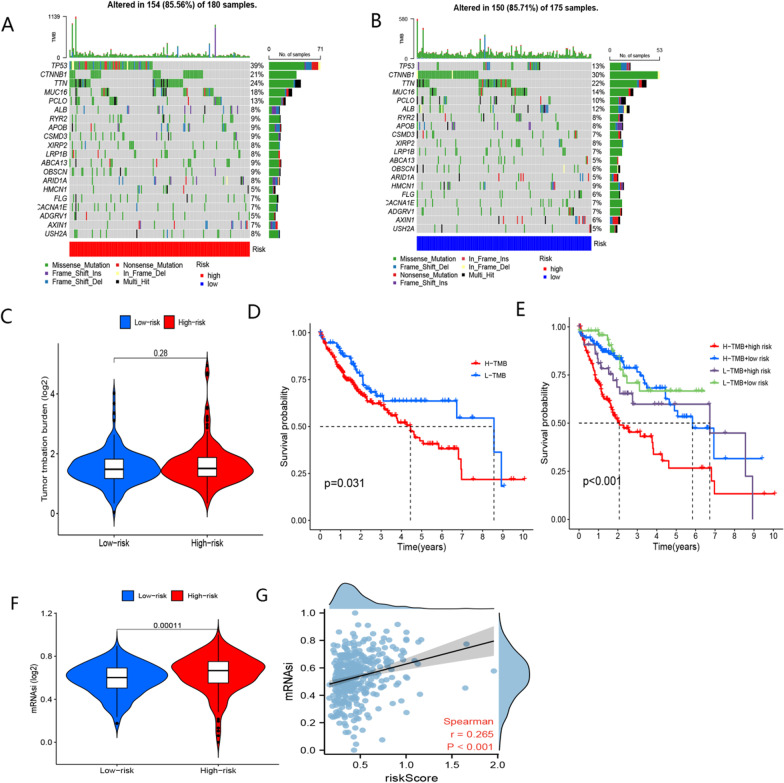
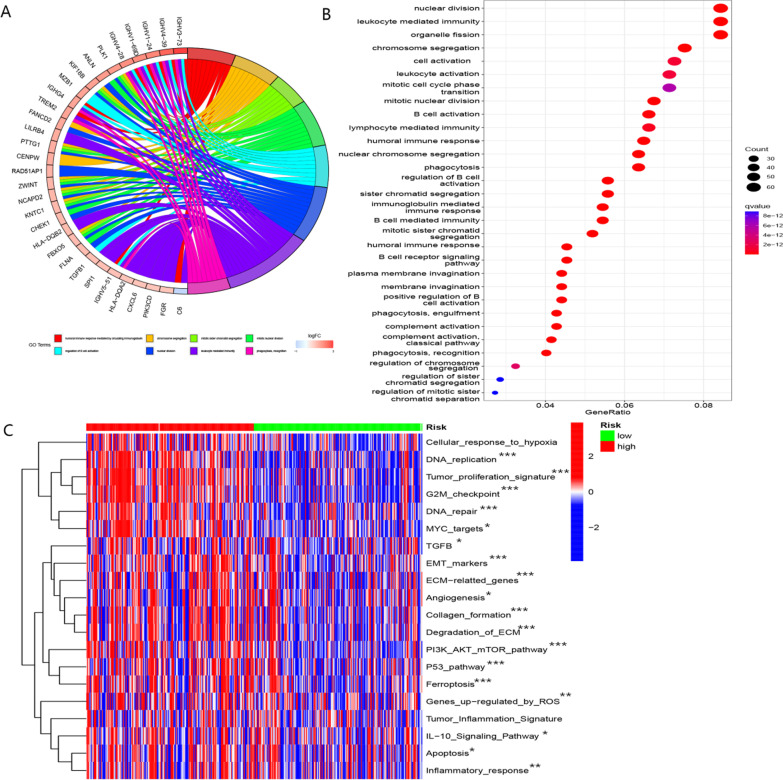
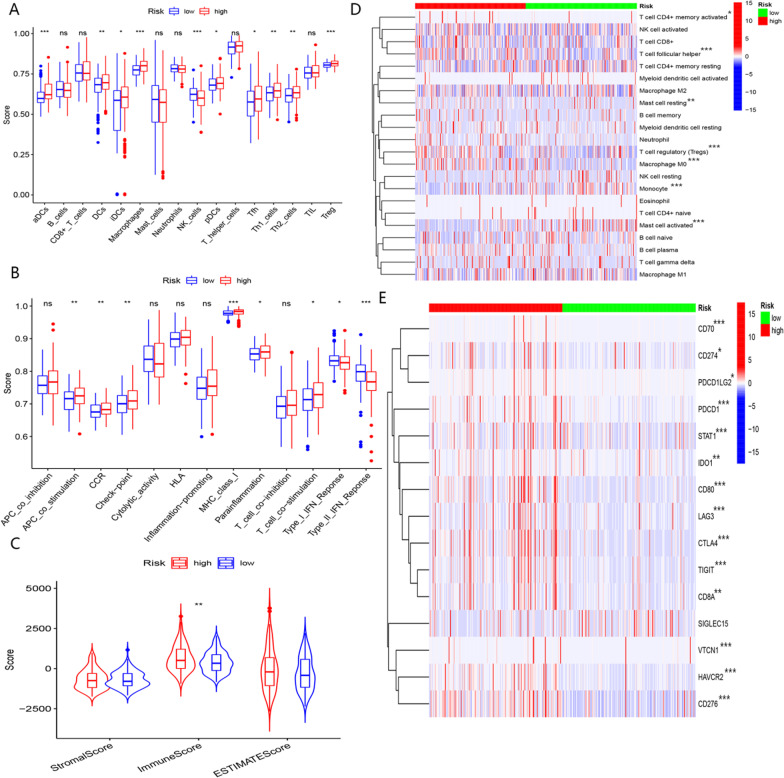
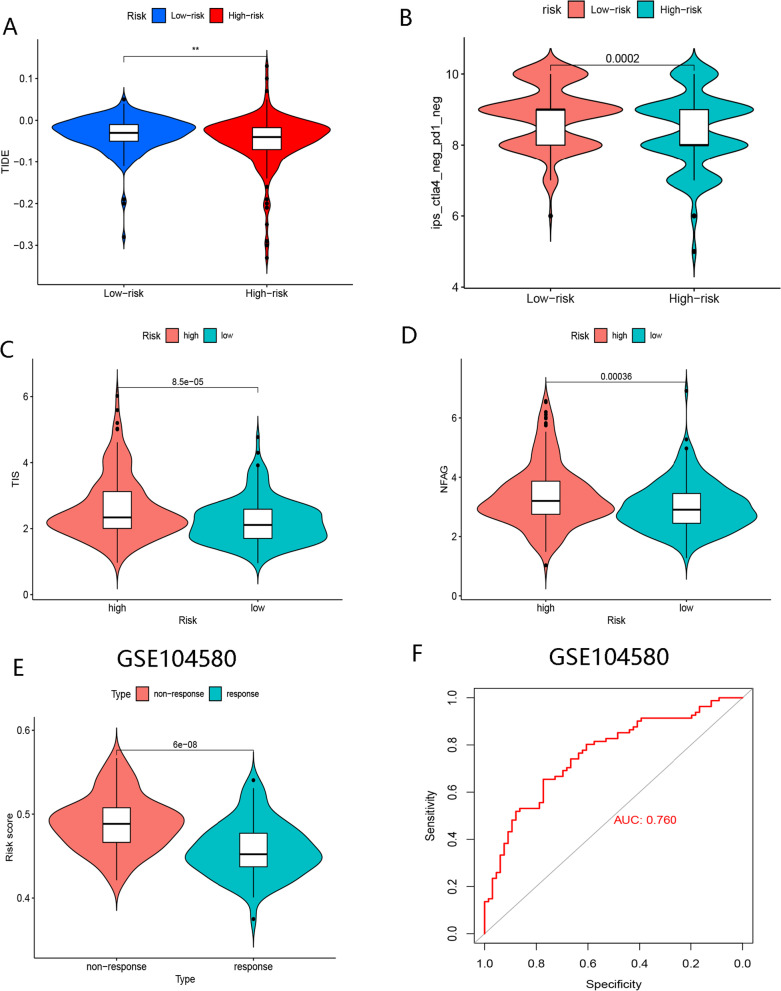
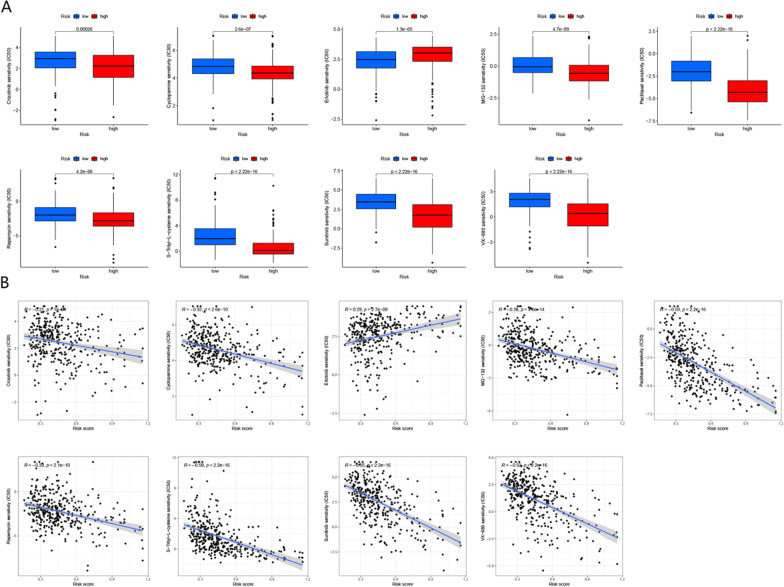
Results: The BMR signature included 3 basement membrane-related genes (CTSA, P3H1, and ADAM9). We revealed that BMR signature was an independent risk contributor to poor prognosis in HCC, and high-risk group patients presented shorter overall survival. We discovered that patients in the high-risk group might be responsive to immunotherapy, while patients in the low-risk group may be susceptible to TACE therapy. Over 300 agents were screened to identify effective drugs for the two subgroups.
Conclusion: Overall, basement membrane-related regulators represent novel biomarkers in HCC for assessing prognosis, response to immunotherapy, the effectiveness of TACE therapy, and drug susceptibility.
Keywords: BMR; Basement membrane; Drug sensitivity; Hepatocellular carcinoma; Immunotherapy.
© 2023. This is a U.S. Government work and not under copyright protection in the US; foreign copyright protection may apply.
Conflict of interest statement
The authors declare that they have no conflicts of interest.
Figures


Similar articles
-
A Novel Ferroptosis-Related Signature for Prediction of Prognosis, Immune Profiles and Drug Sensitivity in Hepatocellular Carcinoma Patients.Curr Oncol. 2022 Sep 27;29(10):6992-7011. doi: 10.3390/curroncol29100550. Curr Oncol. 2022. PMID: 36290827 Free PMC article.
-
Overweight/obesity-related transcriptomic signature as a correlate of clinical outcome, immune microenvironment, and treatment response in hepatocellular carcinoma.Front Endocrinol (Lausanne). 2023 Jan 12;13:1061091. doi: 10.3389/fendo.2022.1061091. eCollection 2022. Front Endocrinol (Lausanne). 2023. PMID: 36714595 Free PMC article.
-
Genes Modulating Butyrate Metabolism for Assessing Clinical Prognosis and Responses to Systematic Therapies in Hepatocellular Carcinoma.Biomolecules. 2022 Dec 27;13(1):52. doi: 10.3390/biom13010052. Biomolecules. 2022. PMID: 36671437 Free PMC article.
-
Mitochondrial-Related Transcriptome Feature Correlates with Prognosis, Vascular Invasion, Tumor Microenvironment, and Treatment Response in Hepatocellular Carcinoma.Oxid Med Cell Longev. 2022 Apr 30;2022:1592905. doi: 10.1155/2022/1592905. eCollection 2022. Oxid Med Cell Longev. 2022. PMID: 35535359 Free PMC article.
-
Development and Validation of TACE Refractoriness-Related Diagnostic and Prognostic Scores and Characterization of Tumor Microenvironment Infiltration in Hepatocellular Carcinoma.Front Immunol. 2022 Apr 13;13:869993. doi: 10.3389/fimmu.2022.869993. eCollection 2022. Front Immunol. 2022. PMID: 35493518 Free PMC article.
Cited by
-
A basement membrane-related signature for prognosis and immunotherapy benefit in bladder cancer based on machine learning.Discov Oncol. 2024 Oct 9;15(1):537. doi: 10.1007/s12672-024-01381-7. Discov Oncol. 2024. PMID: 39382729 Free PMC article.
-
Identification of P3H1 as a Predictive Prognostic Biomarker for Bladder Urothelial Carcinoma Based on the Cancer Genome Atlas Database.Pharmgenomics Pers Med. 2023 Dec 1;16:1041-1053. doi: 10.2147/PGPM.S437974. eCollection 2023. Pharmgenomics Pers Med. 2023. PMID: 38058295 Free PMC article.
-
A model of basement membrane-related regulators for prediction of prognoses in esophageal cancer and verification in vitro.BMC Cancer. 2025 Apr 15;25(1):696. doi: 10.1186/s12885-025-14081-4. BMC Cancer. 2025. PMID: 40234833 Free PMC article.
References
MeSH terms
Substances
LinkOut - more resources
Full Text Sources
Medical
Miscellaneous
