. 2023 Apr 21;11(1):83.
doi: 10.1186/s40168-023-01523-z.

Disentangling temporal associations in marine microbial networks

Affiliations

Disentangling temporal associations in marine microbial networks

Ina Maria Deutschmann et al. Microbiome. .

Abstract

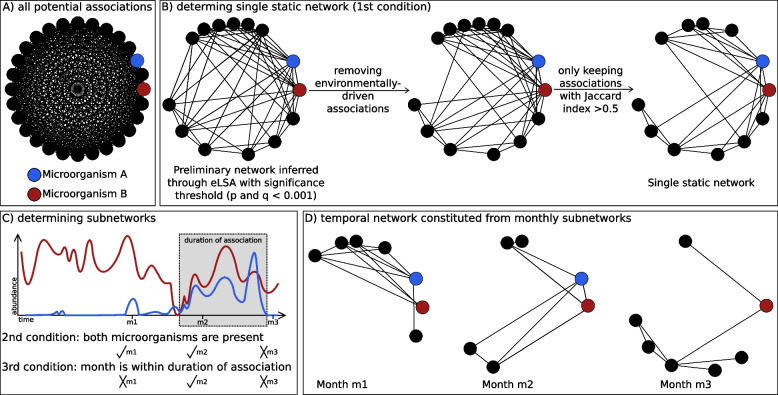
Background: Microbial interactions are fundamental for Earth's ecosystem functioning and biogeochemical cycling. Nevertheless, they are challenging to identify and remain barely known. Omics-based censuses are helpful in predicting microbial interactions through the statistical inference of single (static) association networks. Yet, microbial interactions are dynamic and we have limited knowledge of how they change over time. Here, we investigate the dynamics of microbial associations in a 10-year marine time series in the Mediterranean Sea using an approach inferring a time-resolved (temporal) network from a single static network.

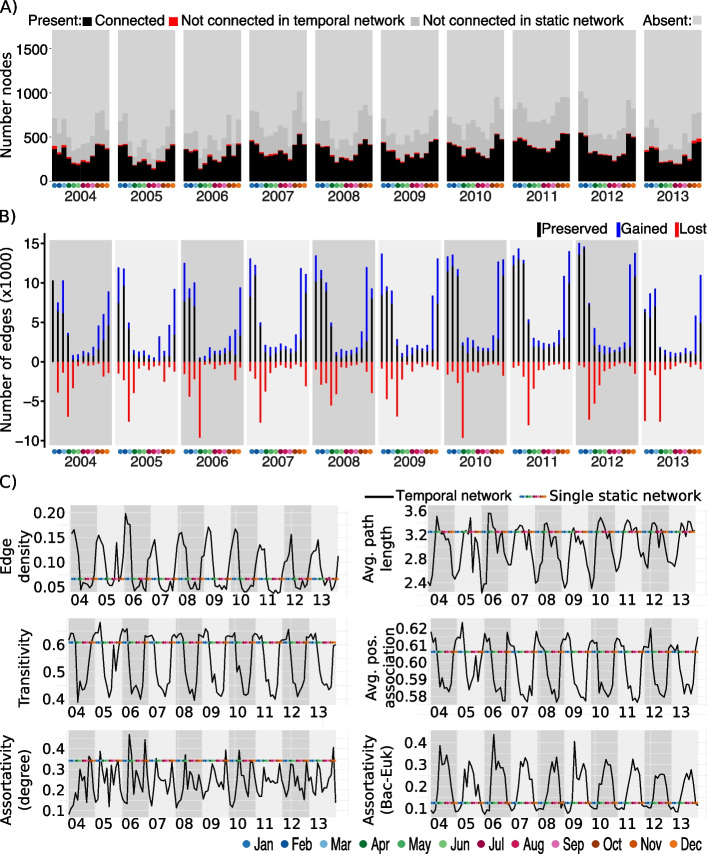
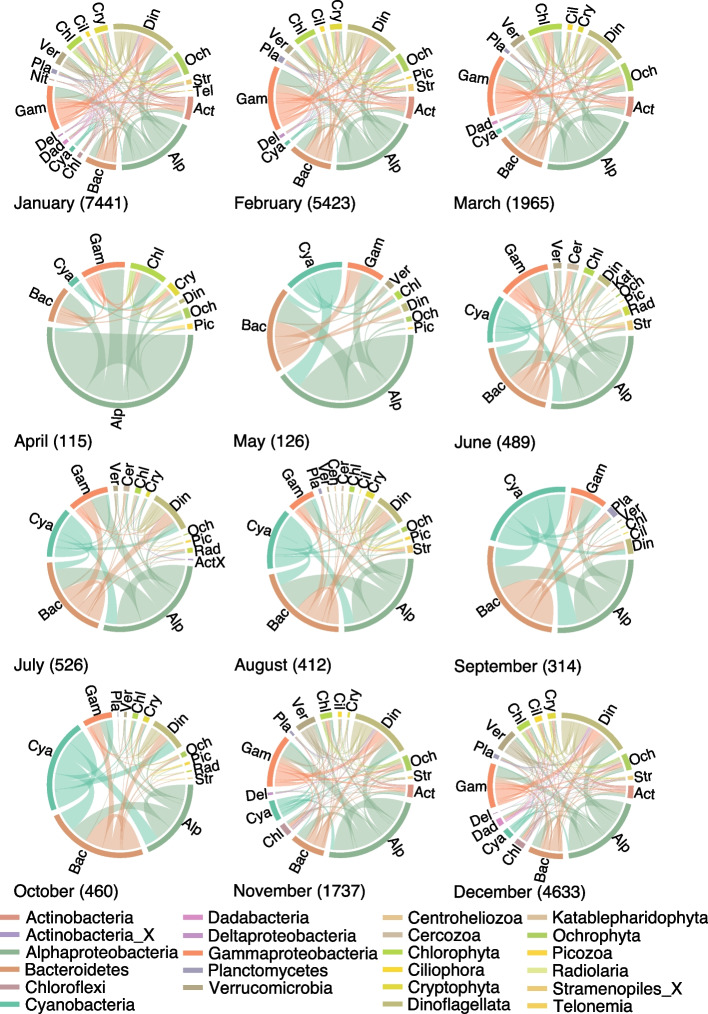
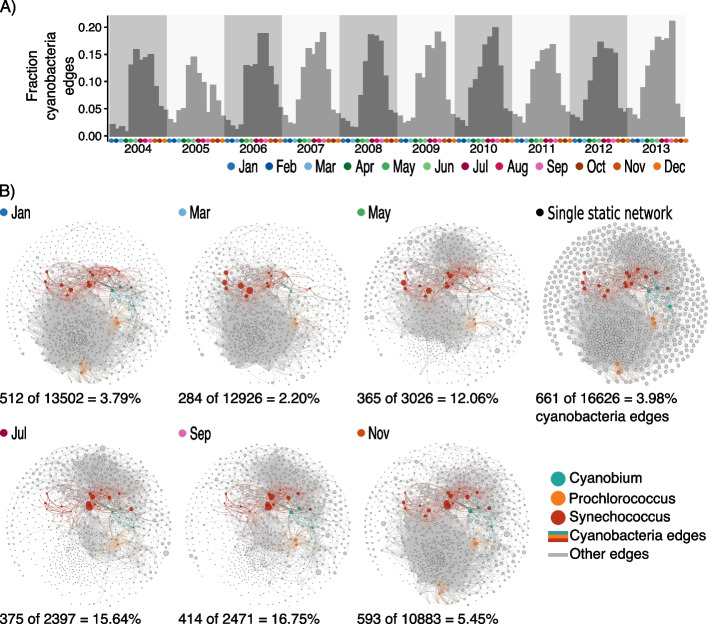
Results: A single static network including microbial eukaryotes and bacteria was built using metabarcoding data derived from 120 monthly samples. For the decade, we aimed to identify persistent, seasonal, and temporary microbial associations by determining a temporal network that captures the interactome of each individual sample. We found that the temporal network appears to follow an annual cycle, collapsing, and reassembling when transiting between colder and warmer waters. We observed higher association repeatability in colder than in warmer months. Only 16 associations could be validated using observations reported in literature, underlining our knowledge gap in marine microbial ecological interactions.

Conclusions: Our results indicate that marine microbial associations follow recurrent temporal dynamics in temperate zones, which need to be accounted for to better understand the functioning of the ocean microbiome. The constructed marine temporal network may serve as a resource for testing season-specific microbial interaction hypotheses. The applied approach can be transferred to microbiome studies in other ecosystems. Video Abstract.

Keywords: Association network; Microbial interactions; Microorganisms; Ocean; Plankton; Temporal network; Time series.


Conflict of interest statement

The authors declare no competing interests.

Figures

Fig. 1
Fig. 1
Estimating a temporal network from a single static network via subnetworks. A A complete network would contain all possible associations (edges) between microorganism (nodes). B The single static network inferred with the network construction tool eLSA and the applied filtering strategy considering association significance, the removal of environmentally driven associations, and associations whose partners appeared in more samples together than alone, i.e., Jaccard index being above 0.5. An association having to be present in the single static network is the first out of the three conditions for an association to be present in a monthly subnetwork. C In order to determine monthly subnetworks, we established two further conditions for each edge. First, both microorganisms need to be present in the sample taken in the specific month. Second, the month lays within the time window of the association inferred through the network construction tool. Here, 3 months are indicated as an example. D Example of monthly subnetworks for the 3 months. The colored nodes correspond to the abundances depicted in C
Fig. 2
Fig. 2
Global (sub)network metrics. A Number of ASVs (counting an ASV twice if it appears in both size fractions) for each of the 120 months of the Blanes Bay Microbial Observatory time series. There are 1709 ASVs of which 709 ASVs are connected in the static network. In black, we show the number of nodes connected in the temporal network, and in red, the number of nodes that are isolated in the temporal network, i.e., they are connected in the static network and have a sequence abundance above zero for that month (“non-zero”). In dark gray, we show the number of ASVs that are non-zero in a given month but were not connected in the static and subsequently temporal network. In light gray, we show the number of ASVs with zero-abundance in a given month. The sum of connected and isolated nodes and non-zero ASVs represents each month’s richness (i.e., number of ASVs). B By comparing the edges of two consecutive months, i.e., two consecutive monthly subnetworks, we indicate the number of edges that have been lost (red), preserved (black), and those that are gained (blue), compared to the previous month. C Six selected global network metrics for each sample-specific subnetwork of the temporal network. The colored line indicates the corresponding metric for the static network
Fig. 3
Fig. 3
Associations with a monthly prevalence of at least 90%. Bacteria and microbial eukaryotes are separated and ordered alphabetically. We provide in parentheses the number of associations that appeared in at least nine out of ten monthly subnetworks
Fig. 4
Fig. 4
Cyanobacteria associations. A Fraction of edges in the temporal network containing at least one Cyanobacteria ASV. B Location of Cyanobacteria associations in the temporal network and the single static network. Here, we show, as an example, selected months of year 2011. The number and fraction of cyanobacterial edges and total number of edges are listed below each monthly subnetwork and the single static network

References

    1. Falkowski PG, Fenchel T, Delong EF. The microbial engines that drive Earth’s biogeochemical cycles. Science. 2008;320:1034–1039. - PubMed
    1. DeLong EF. The microbial ocean from genomes to biomes. Nature. 2009;459:200–206. - PubMed
    1. Krabberød AK, Bjorbækmo MFM, Shalchian-Tabrizi K, Logares R. Exploring the oceanic microeukaryotic interactome with metaomics approaches. Aquat Microb Ecol. 2017;79:1–12.
    1. Locey KJ, Lennon JT. Scaling laws predict global microbial diversity. Proc Natl Acad Sci. 2016;113:5970–5975. - PMC - PubMed
    1. Kallmeyer J, Pockalny R, Adhikari RR, Smith DC, D’Hondt S. Global distribution of microbial abundance and biomass in subseafloor sediment. Proc Natl Acad Sci. 2012;109:16213–16216. - PMC - PubMed

Publication types

LinkOut - more resources