. 2023 Apr 20;20(1):48.
doi: 10.1186/s12984-023-01173-0.

Quantitative assessments of finger individuation with an instrumented glove

Affiliations

Quantitative assessments of finger individuation with an instrumented glove

Brian J Conway et al. J Neuroeng Rehabil. .

Abstract

Background: In clinical and research settings, hand dexterity is often assessed as finger individuation, or the ability to move one finger at a time. Despite its clinical importance, there is currently no standardized, sufficiently sensitive, or fully objective platform for these evaluations.

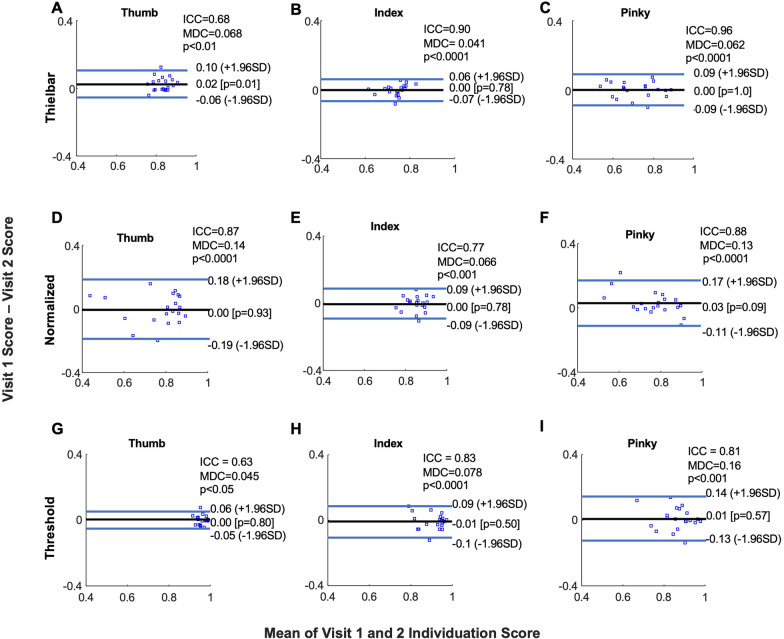
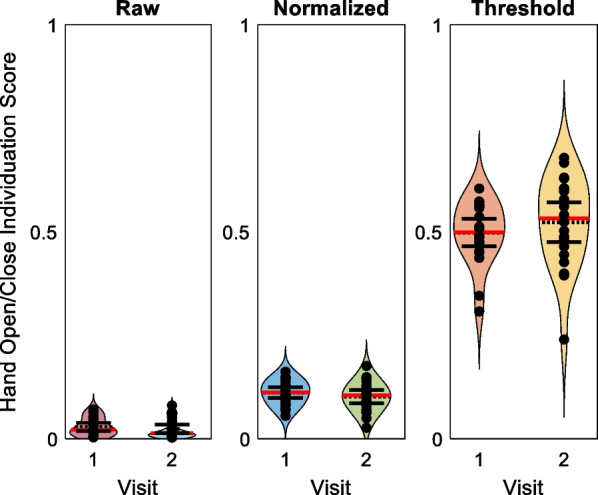
Methods: Here we developed two novel individuation scores and tested them against a previously developed score using a commercially available instrumented glove and data collected from 20 healthy adults. Participants performed individuation for each finger of each hand as well as whole hand open-close at two study visits separated by several weeks. Using the three individuation scores, intra-class correlation coefficients (ICC) and minimal detectable changes (MDC) were calculated. Individuation scores were further correlated with subjective assessments to assess validity.

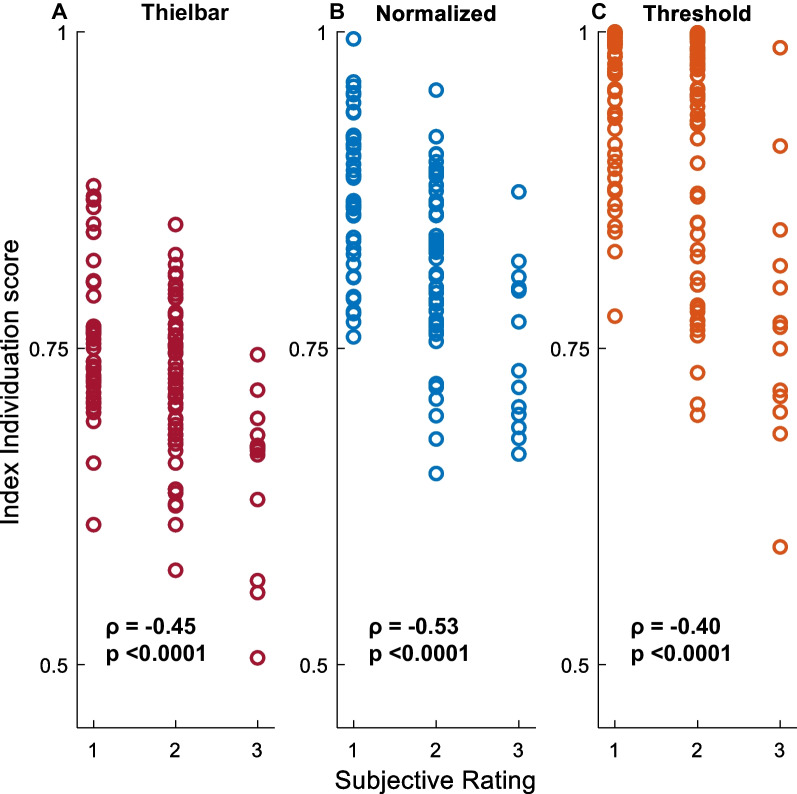
Results: We found that each score emphasized different aspects of individuation performance while generating scores on the same scale (0 [poor] to 1 [ideal]). These scores were repeatable, but the quality of the metrics varied by both equation and finger of interest. For example, index finger intra-class correlation coefficients (ICC's) were 0.90 (< 0.0001), 0.77 (< 0.001), and 0.83 (p < 0.0001), while pinky finger ICC's were 0.96 (p < 0.0001), 0.88 (p < 0.0001), and 0.81 (p < 0.001) for each score. Similarly, MDCs also varied by both finger and equation. In particular, thumb MDCs were 0.068, 0.14, and 0.045, while index MDCs were 0.041, 0.066, and 0.078. Furthermore, objective measurements correlated with subjective assessments of finger individuation quality for all three equations (ρ = - 0.45, p < 0.0001; ρ = - 0.53, p < 0.0001; ρ = - 0.40, p < 0.0001).

Conclusions: Here we provide a set of normative values for three separate finger individuation scores in healthy adults with a commercially available instrumented glove. Each score emphasizes a different aspect of finger individuation performance and may be more uniquely applicable to certain clinical scenarios. We hope for this platform to be used within and across centers wishing to share objective data in the physiological study of hand dexterity. In sum, this work represents the first healthy participant data set for this platform and may inform future translational applications into motor physiology and rehabilitation labs, orthopedic hand and neurosurgery clinics, and even operating rooms.

Keywords: Cyberglove; Finger individuation; Hand dexterity; Kinematics; Motor systems; Neuro-engineering; Neurophysiology.


Conflict of interest statement

None of the authors have any competing interests or conflicts of interest.

Figures

Fig. 1
Fig. 1
Experimental Protocol. A, B Participants were positioned as shown while recording data from each hand. C Photos of a participants with their hand at rest and while performing kinematic individuation and a timeline of events
Fig. 2
Fig. 2
Euclidean Norm of Finger Movement. The metacarpophalangeal (MCP) (blue) and proximal interphalangeal (PIP) (red) joint angles were combined to calculate Euclidean norms (green) for each finger
Fig. 3
Fig. 3
Relevant Hand Positions. Key Euclidean norms needed for the three individuation scores include the hand at rest (A), with the indicated finger fully flexed (B), and with the indicated finger reaching the 50% threshold (C)
Fig. 4
Fig. 4
Example data collected with the Cyberglove III in a single participant. Three-dimensional reconstructions of the Cyberglove data while performing index individuation (A) and closing the hand into a fist (B). Joint angle traces while performing index individuation (C) and closing the hand into a fist (D) and the corresponding individuation scores
Fig. 5
Fig. 5
Distribution of individuation scores. Thielbar (A), normalized (B), and threshold (C) individuation scores of the thumb, index, middle, ring, and pinky fingers fall into unique ranges and have non-normal distributions. Overlapping 95% confidence intervals (shown as error bars) demonstrate the repeatability of kinematic individuation. Points represent participants’ mean individuation scores. Sample means are shown as a black dashed line. Sample medians are represented as red lines. Data from first visits are shown on the left in the graphs for each finger in the colors maroon, blue, and orange. Data from second visits are on the right in the colors cyan, green, and yellow
Fig. 6
Fig. 6
Participants’ Individuation scores between two visits. There was minimal change in participants’ mean Thielbar (AC), Normalized (DF), and Threshold (GI) individuation scores (IS) between the two visits for all fingers. The thumb, index, and pinky fingers are shown here as the thumb and index were typically participants’ highest scores while the pinky was the lowest
Fig. 7
Fig. 7
Bland Altman plots of individuation scores. The repeatability of Thielbar (AC), Normalized (DF), and Threshold (GI) individuation scores can be visualized as the black line represents the mean difference of individuation scores across the two visits, and the majority of participants fall within the two blue lines representing ± 1.96 standard deviations of the mean difference. Participant-level data is represented as blue squares. Intra-class correlation coefficients (ICC), corresponding p-values, and minimal detectable changes (MDC) are shown. The thumb, index, and pinky fingers are shown here as the thumb and index were typically participants’ highest scores while the pinky was the lowest
Fig. 8
Fig. 8
Validating individuation scores through subjective review. Index Thielbar (maroon) (A), normalized (blue) (B), and threshold (orange) (C) individuation scores plotted against subjective ratings of 1 (‘excellent’), 2 (‘moderate’), or 3 (‘poor’). Points represent participants’ individual trials of right-hand index individuation trials at their first study visit. Spearman’s Rho (ρ) and corresponding p-values are shown for each relationship
Fig. 9
Fig. 9
Individuation scores for hand open/close data. Thielbar (A), normalized (B), and threshold (C) individuation scores were calculated for trials of closing the hand into a fist and opening again at both study visits. First visits are shown on the left side of each graph in maroon, blue, and orange with second visits on the right in cyan, green, and yellow. Black circles represent participants’ mean individuation scores. Dashed horizontal black lines represent sample means, and red horizontal lines represent sample medians

References

    1. Hä Ger-Ross C, Schieber MH. Quantifying the Independence of Human Finger Movements: Comparisons of Digits, Hands, and Movement Frequencies. 2000. - PMC - PubMed
    1. Wolbrecht ET, Rowe JB, Chan V, Ingemanson ML, Cramer SC, Reinkensmeyer DJ. Finger strength, individuation, and their interaction: Relationship to hand function and corticospinal tract injury after stroke. Clin Neurophysiol. 2018;129(4):797–808. doi: 10.1016/j.clinph.2018.01.057. - DOI - PMC - PubMed
    1. Xu J, Haith AM, Krakauer JW. Motor Control of the Hand Before and After Stroke. In: Clinical Systems Neuroscience. Tokyo: Springer; 2015. p. 271–89.
    1. Li S, Latash ML, Yue GH, Siemionow V, Sahgal V. The effects of stroke and age on finger interaction in multi-finger force production tasks. Clin Neurophysiol. 2003;114(9):1646–1655. doi: 10.1016/S1388-2457(03)00164-0. - DOI - PubMed
    1. Penfield W, Boldrey E. Somatic motor and sensory representation in the cerebral cortex of man as studied by electrical stimulation. Brain. 1937;60(4):389–443. doi: 10.1093/brain/60.4.389. - DOI

Publication types

LinkOut - more resources