Review
. 2023 Apr 4:14:1162905.
doi: 10.3389/fimmu.2023.1162905. eCollection 2023.

Opportunities and challenges to engineer 3D models of tumor-adaptive immune interactions

Affiliations
Review

Opportunities and challenges to engineer 3D models of tumor-adaptive immune interactions

Rahul M Visalakshan et al. Front Immunol. .

Abstract

Augmenting adaptive immunity is a critical goal for developing next-generation cancer therapies. T and B cells infiltrating the tumor dramatically influence cancer progression through complex interactions with the local microenvironment. Cancer cells evade and limit these immune responses by hijacking normal immunologic pathways. Current experimental models using conventional primary cells, cell lines, or animals have limitations for studying cancer-immune interactions directly relevant to human biology and clinical translation. Therefore, engineering methods to emulate such interplay at local and systemic levels are crucial to expedite the development of better therapies and diagnostic tools. In this review, we discuss the challenges, recent advances, and future directions toward engineering the tumor-immune microenvironment (TME), including key elements of adaptive immunity. We first offer an overview of the recent research that has advanced our understanding of the role of the adaptive immune system in the tumor microenvironment. Next, we discuss recent developments in 3D in-vitro models and engineering approaches that have been used to study the interaction of cancer and stromal cells with B and T lymphocytes. We summarize recent advancement in 3D bioengineering and discuss the need for 3D tumor models that better incorporate elements of the complex interplay of adaptive immunity and the tumor microenvironment. Finally, we provide a perspective on current challenges and future directions for modeling cancer-immune interactions aimed at identifying new biological targets for diagnostics and therapeutics.

Keywords: 3D in vitro models; bioprinting; cancer adaptive immunity; organoids; organs on a chip.


Conflict of interest statement

The authors declare that the research was conducted in the absence of any commercial or financial relationships that could be construed as a potential conflict of interest.

Figures

Figure 1
Figure 1
Adaptive immunity in the tumor microenvironment. Subsets of adaptive immune cells accumulating within the TME kill cancer cells through a variety of cytotoxicity mechanisms (left side) while other populations (right side) impair immune function and suppress cytotoxic activity contributing to continued tumor expansion. Tregs mediate immunosuppression within the TME through multiple pathways (bottom).
Figure 2
Figure 2
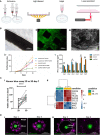
(A) Examples of different bioprinting methods. (B) Extrusion bioprinted T cells in gelatin-alginate hydrogel. i) Brightfield image of alginate + gelatin coaxial print on day 10. ii) Live/Dead viability stain (Calcein-AM/Propidium iodide) two hours post print. iii) SEM image of coaxial printed fiber showing T cells in the core 10 days after printing. iv) Proliferation index of T cells (Cells labeled with carboxyfluorescein succinimidyl ester (CFSE) were collected and analyzed via flow cytometry and proliferation index was calculated using ModFit software). v). IFN-γ secretion from CD4+ T cells (****p < 0.0001). Panel (B) adapted with permission from Jin et al. (2021). Biofabrication, Copyright 2021, IOP Publishing Ltd (72). (C) Extrusion bioprinted MEC1 or primary CD19+ B cells. i) Percentages of viable leukemic primary cells, normalized to day zero, of 3D bioprints compared to traditional 2D cell culture (*p < 0.05, **p < 0.01, ***p < 0.001, ****p < 0.0001). ii) Heatmap summarizing genes of interest for chronic lymphocyte leukemia pathophysiology. Panel (C) adapted from Sbrana et al. (2021) (70). (D) A 3D bioprinted immune–cancer model containing a central MDA-MB-231/human dermal fibroblast spheroid with i) proximal, ~250 µm or ii) distal, ~650 µm T cell ring. Panel (D) adapted with permission from Dey et al. (2022). Biofabrication Copyright 2022, IOP Publishing Ltd (73).
Figure 3
Figure 3
Self-organizing organoids derived from single stem cells, and the cellular composition of patient-derived organoid models of the tumor immune microenvironment. (A) Intestinal crypt organoid schematic showing villus-like epithelium lining the interior lumen (Lu), with crypt domains. (B) Average number of cells within crypt stem-cell derived organoids at 0-4 days after initial single-cell seeding. (C) Intestinal organoid confocal image showing villin in green (enterocytes) and nuclei in blue indicating that the organoid has formed a lumen and villus domain. (D) Growth from a single Lgr5-GFPhi crypt stem cell at Day 0-8. Panels (A–D) reproduced from Sato, et al. ( 87), Copyright 2009, with permission from Springer Nature Customer Service Center. (E) Demonstration of human pancreatic ductal adenocarcinoma (PDAC) patient-derived tumor organoid (PDTO, top right) cultured and xenografted to form a patient-derived tumor xenograft (bottom right) and re-derived as an organoid (bottom left). The original tumor’s histology (top left) has been recapitulated in the PDTO and the histology of the xenograft is preserved in the derived organoids. (F) Human clear cell renal cell carcinoma (ccRCC) PDTO in fresh tumor (Day 0), Day 7, and Day 30 with CD3+ tumor infiltrating lymphocytes (TIL) in red, PanCK in green, and nuclei in blue. The percentage area ratio of CD3+ cells in the lower right corner illustrates CD3+ cell content in fresh tumors and PDTOs. (G) Number of CD3, CD4, and CD8 TIL per 106 organoid cells from fresh tumor (FT) and representative ccRCC PDTO at Day 7, Day 30, and Day 30 + interleukin-2 (IL-2). (H) Day 30 ccRCC PDTO with (+) IL-2 (100 IU/mL) and without (-) IL-2 stained for CD3 in yellow, PanCK in magenta, and nuclei in blue. All scale bars are 20 μm. Panels (E–H) reprinted from Neal, et al. (88), Copyright 2018, with permission from Elsevier.
Figure 4
Figure 4
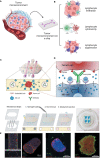
Diverse possibilities to study the tumor immune microenvironment on a chip (A). These technologies have been reported to investigate lymphocyte infiltration, cytotoxicity and suppression (B). As an example, reported by Ayuso et al., 2018, many cells, such as endothelial cells and natural killers, can be interacted on a chip (C, D). The authors confirmed the formation of the endothelial barrier (by CD31), the cancer spheroid (coated with antibodies EpCAM) (E). The spheroids were cultivated under hypoxia (with a sensing dye in red). This figure was partially created by Biorender.com and adapted with permission from Ayuso et al., 2018 (130) (Taylor & Francis Group).
Figure 5
Figure 5
Future possibilities with single cell patterning of the tumor microenvironment (A). Direct 3D cell bioprinting, open-volume microfluidics to position individual cells in a complex 3D patterns panel (A) adapted from Jeffries, et al.(2020) Scientific Reports (144) (B). High-definition single-cell printing droplet method for cell by cell fabrication of biological structures panel (B) reproduced from Zhang, et al.(2020) Advanced Materials (145). (C). 3D bioprinting of spheroids, 3D Bioprinting of hMSC/HUVEC spheroids via Aspiration-assisted Bioprinting panel (C) adapted with permission from Heo et al. (2020) Biofabrication Copyright 2020, IOP Publishing Ltd (146). (D) DNA-programmed assembly of cells (DPAC), reconstituting the multicellular organization of organoid-like tissues with programmed size, shape, composition and spatial heterogeneity panel (D) adapted with permission from Todhunter, et al.(2015) Nature Methods, Copyright 2015, Nature Publishing Group (147).

References

    1. Jensen C, Teng Y. Is it time to start transitioning from 2d to 3d cell culture? Front Mol Biosci (2020) 7:33. doi: 10.3389/fmolb.2020.00033 - DOI - PMC - PubMed
    1. Kapałczyńska M, Kolenda T, Przybyła W, Zajączkowska M, Teresiak A, Filas V, et al. . 2d and 3d cell cultures–a comparison of different types of cancer cell cultures. Arch Med Sci (2018) 14(4):910–9. doi: 10.5114/aoms.2016.63743 - DOI - PMC - PubMed
    1. Martinez-Pacheco S, O’Driscoll L. Pre-clinical in vitro models used in cancer research: Results of a worldwide survey. Cancers (2021) 13(23):6033. doi: 10.3390/cancers13236033 - DOI - PMC - PubMed
    1. Sajjad H, Imtiaz S, Noor T, Siddiqui YH, Sajjad A, Zia M. Cancer models in preclinical research: A chronicle review of advancement in effective cancer research. Anim Models Exp Med (2021) 4(2):87–103. doi: 10.1002/ame2.12165 - DOI - PMC - PubMed
    1. Hughes P, Marshall D, Reid Y, Parkes H, Gelber C. The costs of using unauthenticated, over-passaged cell lines: How much more data do we need? Biotechniques (2007) 43(5):575–86. doi: 10.2144/000112598 - DOI - PubMed

Publication types