

Identification and characterization of the Hfq bacterial amyloid region DNA interactions
- PMID: 37082015
- PMCID: PMC10074921
- DOI: 10.1016/j.bbadva.2021.100029
Identification and characterization of the Hfq bacterial amyloid region DNA interactions
Abstract
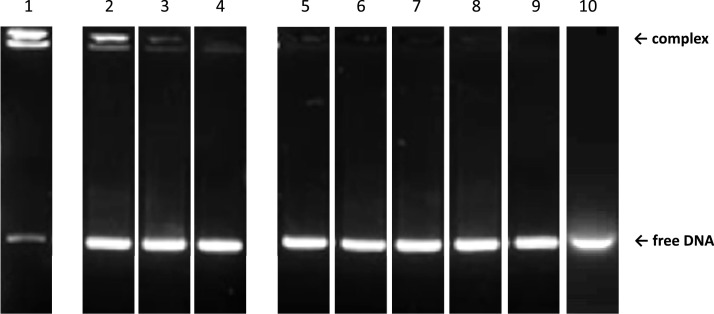
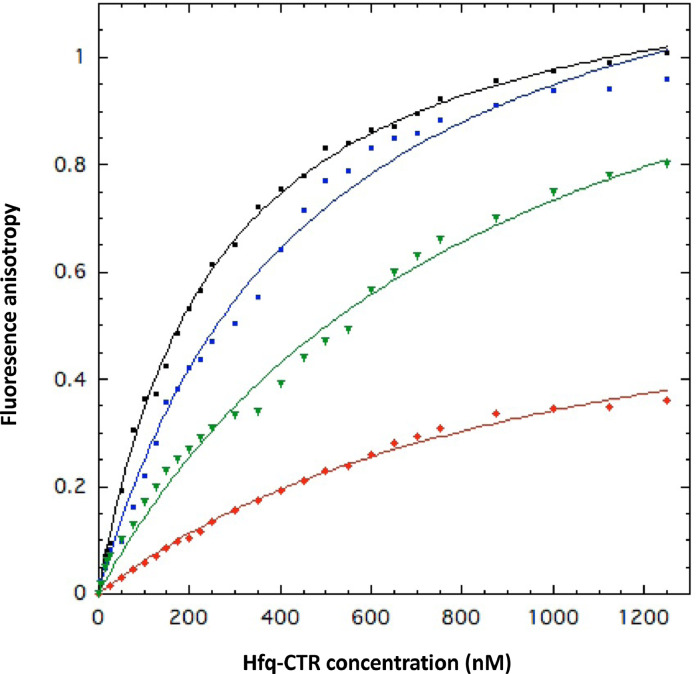
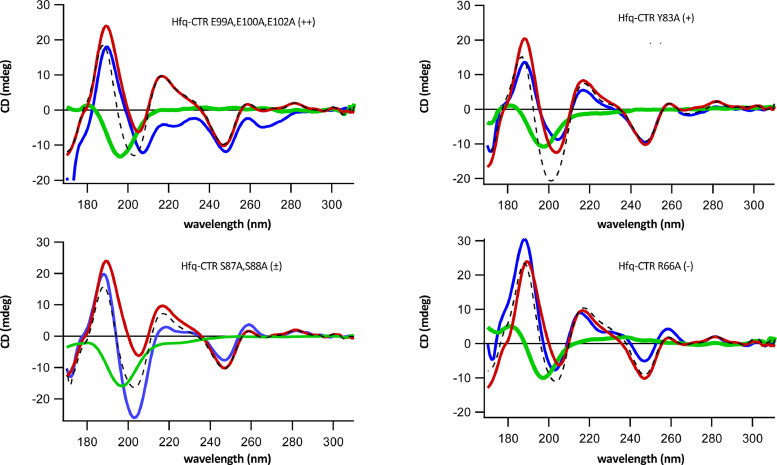
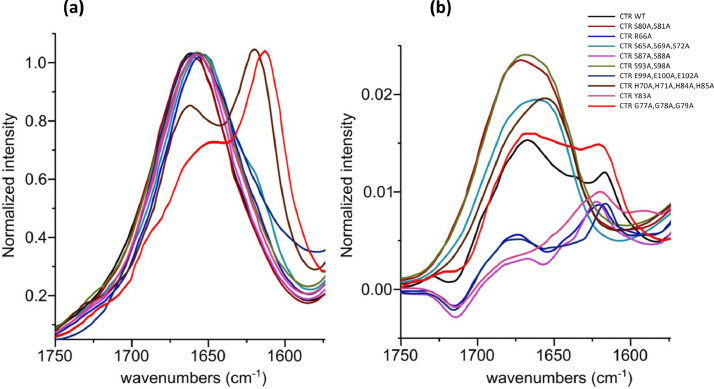
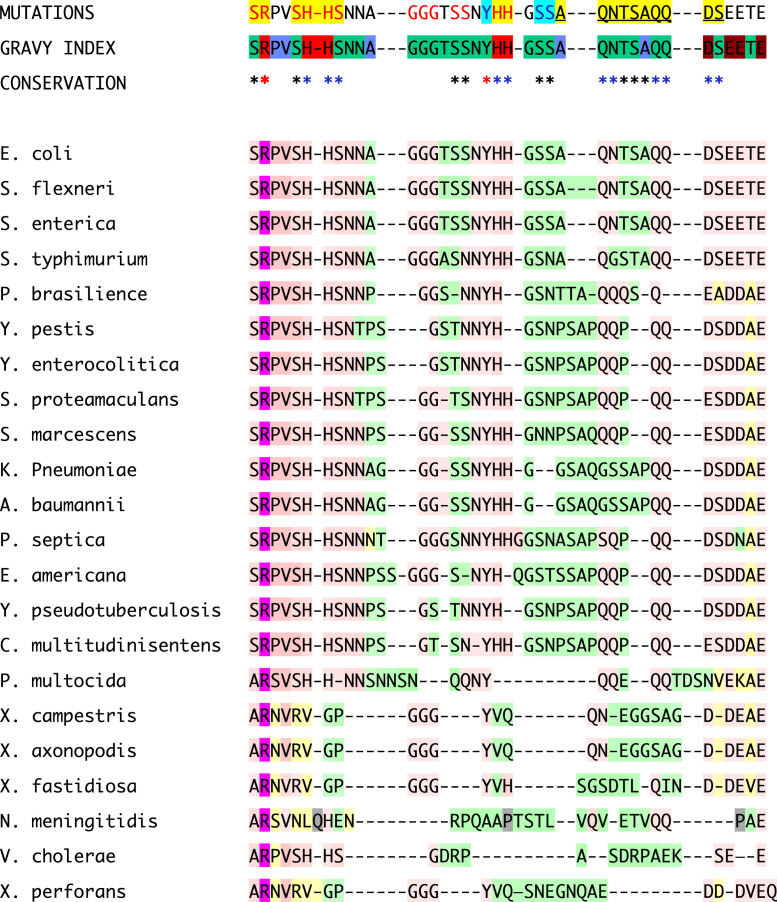
Nucleic acid amyloid proteins interactions have been observed in the past few years. These interactions often promote protein aggregation. Nevertheless, molecular basis and physiological consequences of these interactions are still poorly understood. Additionally, it is unknown whether the nucleic acid promotes the formation of self-assembly due to direct interactions or indirectly via sequences surrounding the amyloid region. Here we focus our attention on a bacterial amyloid, Hfq. This protein is a pleiotropic bacterial regulator that mediates many aspects of nucleic acids metabolism. The protein notably mediates mRNA stability and translation efficiency by using stress-related small non coding regulatory RNA. In addition, Hfq, thanks to its amyloid C-terminal region, binds and compacts DNA. A combination of experimental methodologies, including synchrotron radiation circular dichroism (SRCD), gel shift assay and infrared (FTIR) spectroscopy have been used to probe the interaction of Hfq C-terminal region with DNA. We clearly identify important amino acids in this region involved in DNA binding and polymerization properties. This allows to understand better how this bacterial amyloid interacts with DNA. Possible functional consequence to answer to stresses are discussed.
Keywords: Bacterial adaptation; Bacterial amyloid; DNA induced protein fibrillation; DNA:protein fibrils; Functional amyloid.
© 2021 The Author(s).
Conflict of interest statement
The authors declare that they have no known competing financial interests or personal relationships that could have appeared to influence the work reported in this paper.
Figures
Similar articles
-
Amyloid-like Hfq interaction with single-stranded DNA: involvement in recombination and replication in Escherichia coli.QRB Discov. 2022 Sep 7;3:e15. doi: 10.1017/qrd.2022.15. eCollection 2022. QRB Discov. 2022. PMID: 37529279 Free PMC article.
-
The Amyloid Region of Hfq Riboregulator Promotes DsrA:rpoS RNAs Annealing.Biology (Basel). 2021 Sep 12;10(9):900. doi: 10.3390/biology10090900. Biology (Basel). 2021. PMID: 34571778 Free PMC article.
-
The Amyloid Assembly of the Bacterial Hfq Is Lipid-Driven and Lipid-Specific.Int J Mol Sci. 2024 Jan 24;25(3):1434. doi: 10.3390/ijms25031434. Int J Mol Sci. 2024. PMID: 38338713 Free PMC article.
-
The Escherichia Coli Hfq Protein: An Unattended DNA-Transactions Regulator.Front Mol Biosci. 2016 Jul 28;3:36. doi: 10.3389/fmolb.2016.00036. eCollection 2016. Front Mol Biosci. 2016. PMID: 27517037 Free PMC article. Review.
-
New molecular interactions broaden the functions of the RNA chaperone Hfq.Curr Genet. 2019 Dec;65(6):1313-1319. doi: 10.1007/s00294-019-00990-y. Epub 2019 May 18. Curr Genet. 2019. PMID: 31104083 Review.
Cited by
-
Amyloid-like DNA bridging: a new mode of DNA shaping.Nucleic Acids Res. 2025 Feb 27;53(5):gkaf169. doi: 10.1093/nar/gkaf169. Nucleic Acids Res. 2025. PMID: 40066879 Free PMC article.
-
Dynamic action of an intrinsically disordered protein in DNA compaction that induces mycobacterial dormancy.Nucleic Acids Res. 2024 Jan 25;52(2):816-830. doi: 10.1093/nar/gkad1149. Nucleic Acids Res. 2024. PMID: 38048321 Free PMC article.
-
Hfq C-terminal region forms a β-rich amyloid-like motif without perturbing the N-terminal Sm-like structure.Commun Biol. 2023 Oct 21;6(1):1075. doi: 10.1038/s42003-023-05462-1. Commun Biol. 2023. PMID: 37865695 Free PMC article.
-
Bacterial Amyloids as Hubs for Nucleic Acid Interactions: Implications and Mechanisms.Int J Mol Sci. 2025 Jul 8;26(14):6560. doi: 10.3390/ijms26146560. Int J Mol Sci. 2025. PMID: 40724810 Free PMC article. Review.
-
Molecular recognition and structural plasticity in amyloid-nucleic acid complexes.J Struct Biol. 2025 Jul 14;217(3):108233. doi: 10.1016/j.jsb.2025.108233. Online ahead of print. J Struct Biol. 2025. PMID: 40669763 Free PMC article.
References
-
- Nandi P.K., Leclerc E., Nicole J.C., Takahashi M. DNA-induced partial unfolding of prion protein leads to its polymerisation to amyloid. J. Mol. Biol. 2002;322:153–161. - PubMed
-
- Barucker C., Sommer A., Beckmann G., Eravci M., Harmeier A., Schipke C.G., Brockschnieder D., Dyrks T., Althoff V., Fraser P.E., Hazrati L.N., George-Hyslop P.S., Breitner J.C., Peters O., Multhaup G. Alzheimer amyloid peptide abeta42 regulates gene expression of transcription and growth factors. J. Alzheimers Dis. 2015;44:613–624. - PubMed
LinkOut - more resources
Full Text Sources
Molecular Biology Databases
Miscellaneous
