. 2021 Apr 21:1:100012.
doi: 10.1016/j.bbadva.2021.100012. eCollection 2021.

Modeling of Ca2+ transients initiated by GPCR agonists in mesenchymal stromal cells

Affiliations

Modeling of Ca2+ transients initiated by GPCR agonists in mesenchymal stromal cells

Nikolai P Kaimachnikov et al. BBA Adv. .

Abstract

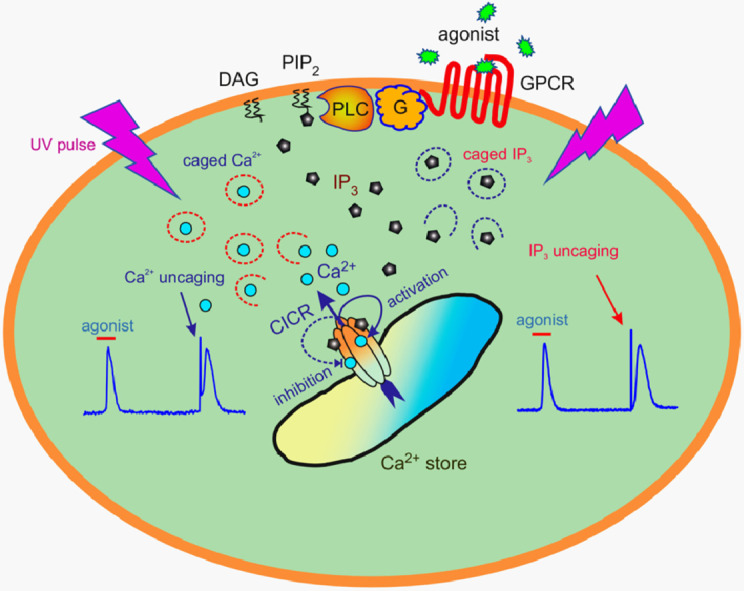
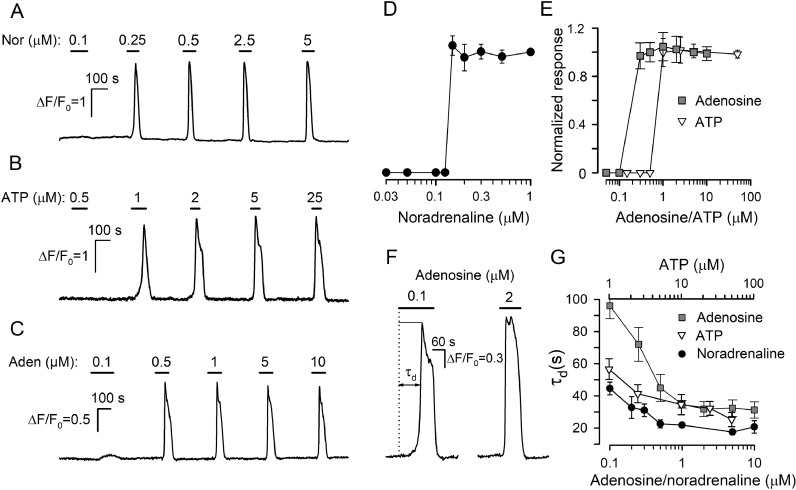
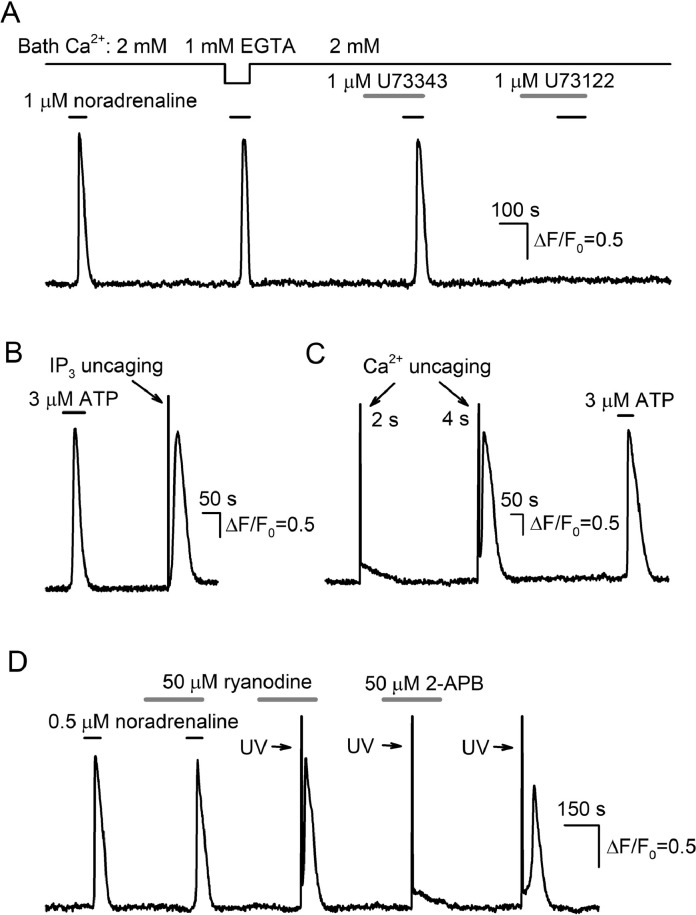
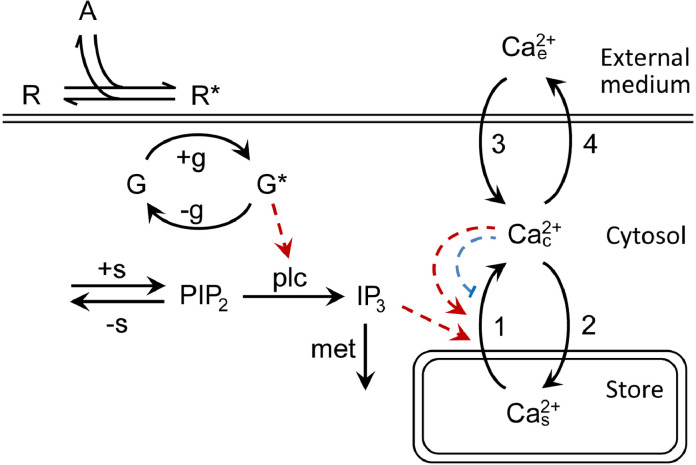
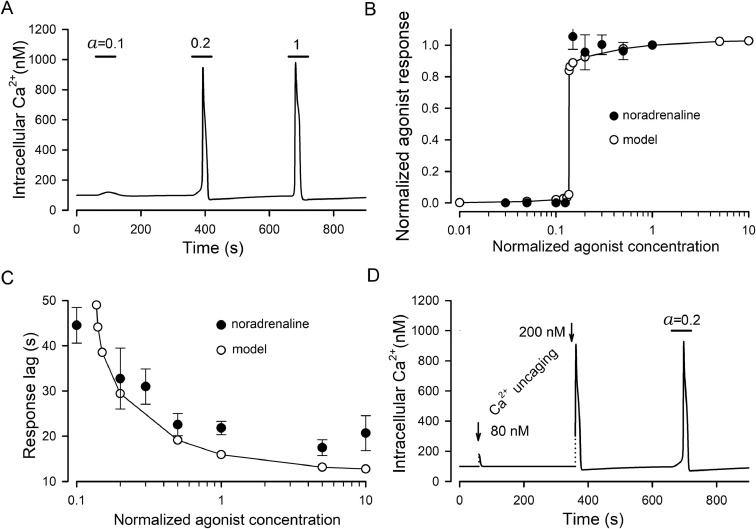
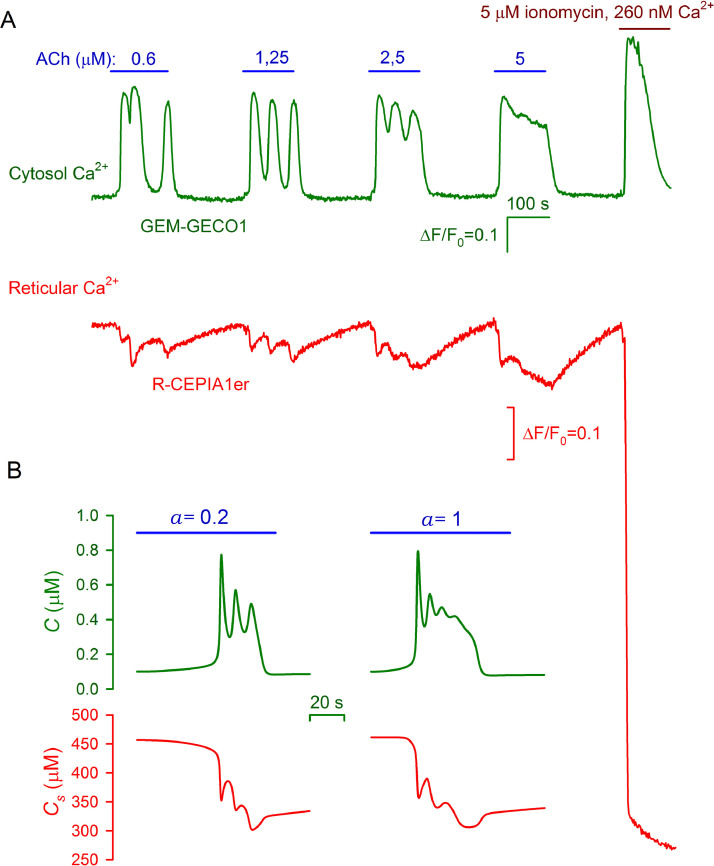
The integrative study that included experimentation and mathematical modeling was carried out to analyze dynamic aspects of transient Ca2+ signaling induced by brief pulses of GPCR agonists in mesenchymal stromal cells from the human adipose tissue (AD-MSCs). The experimental findings argued for IP3/Ca2+-regulated Ca2+ release via IP3 receptors (IP3Rs) as a key mechanism mediating agonist-dependent Ca2+ transients. The consistent signaling circuit was proposed to formalize coupling of agonist binding to Ca2+ mobilization for mathematical modeling. The model properly simulated the basic phenomenology of agonist transduction in AD-MSCs, which mostly produced single Ca2+ spikes upon brief stimulation. The spike-like responses were almost invariantly shaped at different agonist doses above a threshold, while response lag markedly decreased with stimulus strength. In AD-MSCs, agonists and IP3 uncaging elicited similar Ca2+ transients but IP3 pulses released Ca2+ without pronounced delay. This suggested that IP3 production was rate-limiting in agonist transduction. In a subpopulation of AD-MSCs, brief agonist pulses elicited Ca2+ bursts crowned by damped oscillations. With properly adjusted parameters of IP3R inhibition by cytosolic Ca2+, the model reproduced such oscillatory Ca2+ responses as well. GEM-GECO1 and R-CEPIA1er, the genetically encoded sensors of cytosolic and reticular Ca2+, respectively, were co-expressed in HEK-293 cells that also responded to agonists in an "all-or-nothing" manner. The experimentally observed Ca2+ signals triggered by ACh in both compartments were properly simulated with the suggested signaling circuit. Thus, the performed modeling of the transduction process provides sufficient theoretical basis for deeper interpretation of experimental findings on agonist-induced Ca2+ signaling in AD-MSCs.

Keywords: Agonist-induced Ca2+ signaling; Ca2+-induced Ca2+ release; IP3 receptors; Mathematical modeling; Mesenchymal stromal cells.


Conflict of interest statement

The authors disclose no conflict of interest.

Figures

Image, graphical abstract
Graphical abstract
Fig 1
Fig. 1
Dose dependencies of agonist responses. (A–С) Representative monitoring of intracellular Ca2+ in three different AD-MSCs, which were serially stimulated by noradrenaline (A), ATP (B), or adenosine (С) at indicated concentrations. (D) Summary of noradrenaline responses of 10 cells exhibiting the same threshold concentration of 0.15 μM. The dose-response curve was generated by averaging normalized Ca2+ responses at a given noradrenaline concentration within 0.03–1 μM. In each case, Ca2+ transients were normalized to a cell response to 1 μM noradrenaline. (E) Dose-response curves for ATP (triangles) and adenosine (squares) responses. The data were overaged over 9 cells responsive to ATP with the threshold of 1 μM and 7 adenosine-responsive cells exhibiting the 0.3-μM threshold. In each case, responses to 10 μM ATP and 5 μM adenosine were normalizing. (F) Representative Ca2+ transients elicited by adenosine at 100 nM (near-threshold concentration) and 2 μM in the same cell. These adenosine responses were delayed relative to the moment of agonist application by 97 s and 32 s, respectively. The characteristic time of the response delay (τd) was calculated as a time interval necessary for a Ca2+ transient to reach the half-magnitude. (G) Response lag versus agonist concentration (mean ± S.D.). The data were collected solely from robust noradrenaline-, ATP-, and adenosine-responsive cells (n=10, 16, and 21, respectively), which exhibit negligible responsivity rundown and tolerated the serial stimulation by the particular agonist at all indicated doses. In (A-D), ΔF = F-F0, F is the instant intensity of cell fluorescence, F0 is the averaged intensity of cell fluorescence in the very beginning of a recording.
Fig 2
Fig. 2
Involvement of the phosphoinositide cascade and CICR in agonist transduction. (A) Removal of bath Ca2+ weakly affected Ca2+ responses to 1 μM noradrenaline (18 cells). The PLC inhibitor U73122 (1 μM) suppressed AD-MSC responsivity to noradrenaline, while its much less effective analogue U73343 (1 μM) was ineffective (18 cells). (B, C) Evidence for Ca2+-induced Ca2+ release mediated by IP3R. ATP (3 μM) and IP3 uncaging by a 2-s UV flash elicited similar responses in a cell loaded with caged-Ins(145)P3/PM (36 cells) (B). In MSCs loaded with NP-EGTA and responsive to ATP (3 μM), 2-s Ca2+ uncaging elicited a small Ca2+ jump relaxing exponentially, while a 4-s UV flash elicited a large biphasic Ca2+ transient that was similar to an ATP response (13 cells) (C). Because a UV laser employed for uncaging was in fact a biharmonic light source emitting at 351 and 527 nm, a light stimulus caused an optical artifact that was seen as a marked overshoot in the fluorescence traces acquired at 535 ± 25 nm. (D) Ryanodine (50 μM) affected neither AD-MSC responsiveness to 0.5 μM noradrenaline nor Ca2+ transients elicited by Ca2+ uncaging by a 4-s UV flash (11 cells). In contrast, 50 μM 2-APB completely abolished biphasic agonist-like responses to Ca2+ uncaging by 4-s UV flashes. In the experiments with Ca2+ uncaging (C, D), emission of a UV laser was weakened by the factor ten, so that Ca2+ uncaging should have lasted for 4 s to liberate as many Ca2+ ions as necessary for stimulating CICR. This more gradual release of caged Ca2+ slowed the rising phase of a biphasic Ca2+ transient produced by CICR, thereby making a lag between a UV flash and a light response clearly visible. In (A-D), intracellular Ca2+ was monitored in different AD-MSCs.
Fig 3
Fig. 3
Kinetic model of agonist transduction in AD-MSCs. Substances: A, agonist; R, receptor; R*, activated receptor formed by reversible binding of A to R; G, G-protein; G*, activated G-protein; PIP2, phosphatidylinositol (4,5)-bisphosphate; IP3, inositol (1,4,5)-trisphosphate; Ca2+c,cytosolic Ca2+; Ca2+s, stored Ca2+ releasable by IP3; Ca2+e, extracellular Ca2+ postulated to be constant. The arrows with symbols denote +g: formation of G* catalyzed by R*. -g: inactivation of G* to G due to GTPase activity. +s: synthesis of PIP2. -s: removal of PIP2 by dephosphorylation and phosphorylation. plc: reaction catalyzed by phospholipase C. met: IP3 metabolism 1. Ca2+ release through the IP3 receptor 2. Refilling of Ca2+ store by reticular Ca2+-ATPase (SERCA). 3. Ca2+entry mediated by Ca2+ channels operating in the plasma membrane. 4. Ca2+ extrusion by plasma membrane Ca2+-ATPase (PMCA). The dashed red and blue arrows denote activation and inhibition, respectively.
Fig 4
Fig. 4
Simulations of Ca2+ transients in stimulated AD-MSCs. (A) The deviation of cytosolic Ca2+ on serial 60-s stimulation by an agonist at three different normalized ([A]/KD) doses of 0.1, 0.2, and 1. (B) Model response magnitude (ο) versus normalized agonist dose ([A]/KD). The dose-response curve for noradrenaline from Fig. 1D (•) is presented for comparison. The noradrenaline concentrations were normalized to 1 μM. (C) Model response lag (ο) versus normalized agonist concentration. The dose-response curve for noradrenaline from Fig. 1G (•) is presented for comparison. Agonist concentrations were normalized as in (B). (D) Simulation of Ca2+ uncaging by a step-like increase of intracellular Ca2+ from 100 nM to 180 and 300 nM. While the 80 nM jump elicited the small exponentially relaxing Ca2+ transient, the 200 nM jump produced the agonist-like Ca2+ response.
Fig 5
Fig. 5
Dynamics of the key mediators and cytosolic/reticular Ca2+ during agonist transduction. The kinetics of G*, PIP2 and IP3 (variables g, s, and p), cytosolic Ca2+ (C), and reticular Ca2+ (Cs) were simulated using Eqs. (2)–(6) at the basic parameter set (Table 1S). The sequential stimuli of increased concentrations (a=0.1, 0.2, and 1) were applied as indicated. G*, PIP2, and IP3 are presented in arbitrary units.
Fig 6
Fig. 6
Effect of exogeneous Ca2+ buffer on agonist response. (A) Loading of AD-MSCs with NP-EGTA affected AD-MSC responsiveness to 3 μM ATP, while the photolysis of this exogeneous Ca2+ buffer reversed effects of NP-EGTA. The recordings from cells 1–3 exemplify the diversity of NP-EGTA effects. (B) Simulations of effects of exogeneous saturable NP-EGTA-like Ca2+ buffers on agonist-induced Ca2+ transients using the Eqs. (2)–(5), 6b), ((8), and (9) with increasing Bt. Parameter values were as in Table 1S, and KbD=0.08 μM, k-b=0.5 s-1.
Fig 7
Fig. 7
Oscillatory Ca2+ signals elicited by agonist. (A) Representative (43 cells) monitoring of GEM-GECO1 and R-CEPIA1er fluorescence in a transfected HEK-293 cell. The upper curve reflects the behavior of cytosolic Ca2+ upon cell stimulation with ACh at doses varied as indicated. The evolution of reticular Ca2+ is depicted by the bottom trace. To evaluate a relative change in reticular Ca2+ elicited by ACh, in the end of the recording, Ca2+ store was emptied by ionomycin (5 μM ) applied with 260 nM Ca2+ in the bath. For GEM-GECO1 or R-CEPIA1er, the fluorescence traces were presented as ΔF/F0, where ΔF = F0-F, or ΔF = F-F0, respectively, F is the instant intensity of cell fluorescence, F0 is the averaged intensity of cell fluorescence in the very beginning of a recording. The R-CEPIA1er signal was corrected for photobleaching (Supplementary Fig. 1S). (B) Simulations of oscillatory Ca2+ signals elicited by an agonist at two doses in the cytosol (upper curves) and in Ca2+ store (bottom curves). The computations were performed using the Eqs. (2)-(6) with the basic parameter set (Table 1S) except for m=3, Ki=0.4 μM, and ac=70.

Similar articles

Cited by

References

    1. Clapham D. Calcium signaling. Cell. 2007;131:1047–1058. - PubMed
    1. Berridge M.J., Bootman M.D., Roderick H.L. Calcium signaling: dynamics, homeostasis and remodeling. Nat. Rev. Mol. Cell Biol. 2003;4:517–529. - PubMed
    1. Rizzuto R., De Stefani D., Raffaello A., Mammucari C. Mitochondria as sensors and regulators of calcium signaling. Nat. Rev. Mol. Cell Biol. 2012;13:566–578. - PubMed
    1. Berridge M.J. The inositol trisphosphate/calcium signaling pathway in health and disease. Physiol. Rev. 2016;96:1261–1296. - PubMed
    1. Trebak M., Kinet J.-P. Calcium signalling in T cells. Nat. Rev. Immunol. 2019;19:154–169. - PMC - PubMed