

Prediction of motion artifacts caused by translation in handheld laser speckle contrast imaging
- PMID: 37082096
- PMCID: PMC10112282
- DOI: 10.1117/1.JBO.28.4.046005
Prediction of motion artifacts caused by translation in handheld laser speckle contrast imaging
Abstract
Significance: In handheld laser speckle contrast imaging (LSCI), motion artifacts (MA) are inevitable. Suppression of MA leads to a valid and objective assessment of tissue perfusion in a wide range of medical applications including dermatology and burns. Our study shines light on the sources of these artifacts, which have not yet been explored. We propose a model based on optical Doppler effect to predict speckle contrast drop as an indication of MA.
Aim: We aim to theoretically model MA when an LSCI system measuring on static scattering media is subject to translational displacements. We validate the model using both simulation and experiments. This is the crucial first step toward creating robustness against MA.
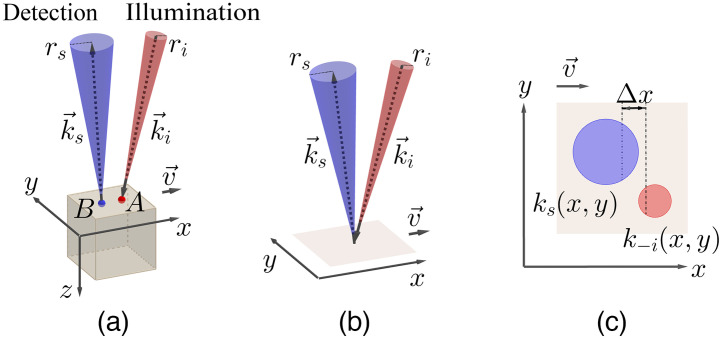
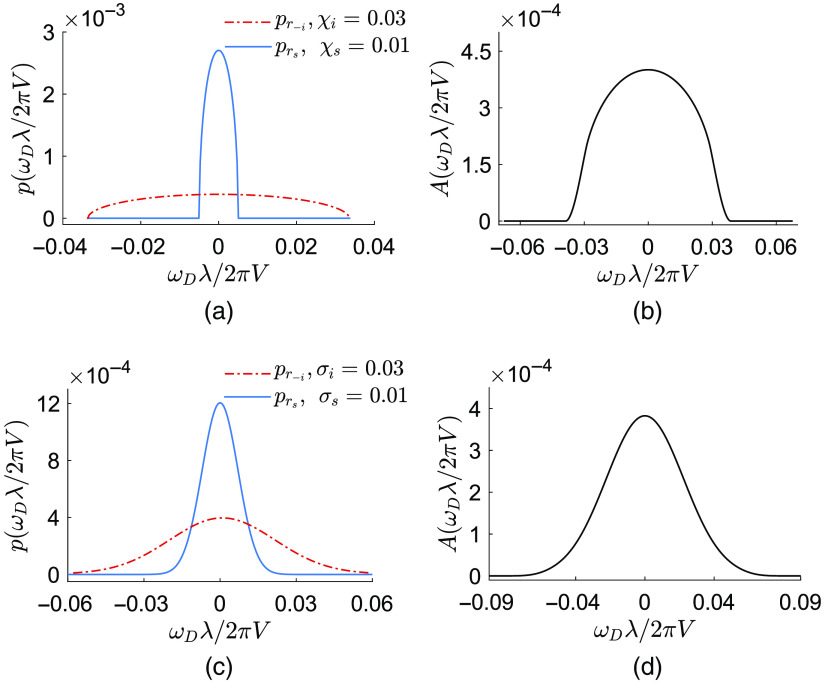
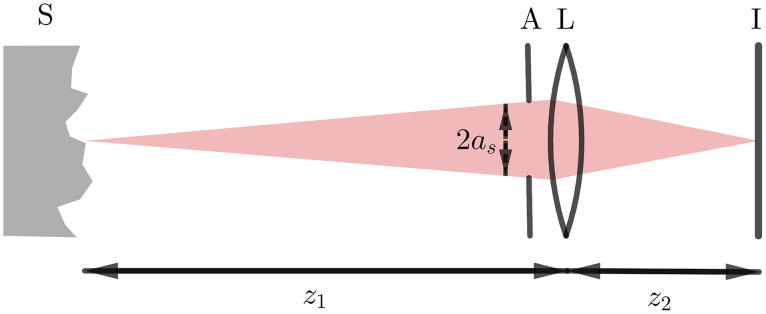
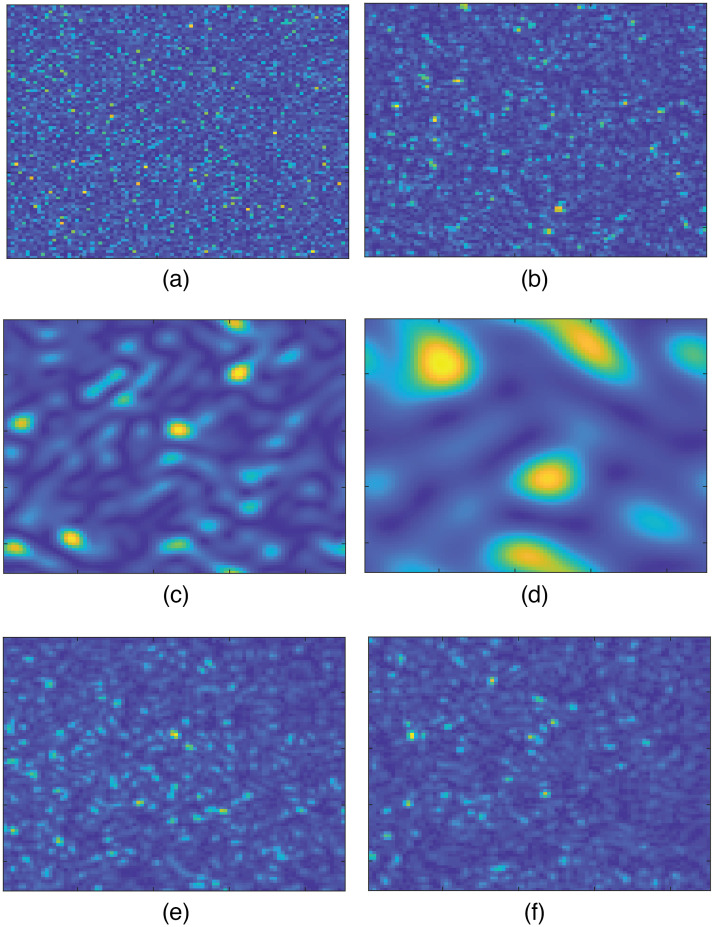
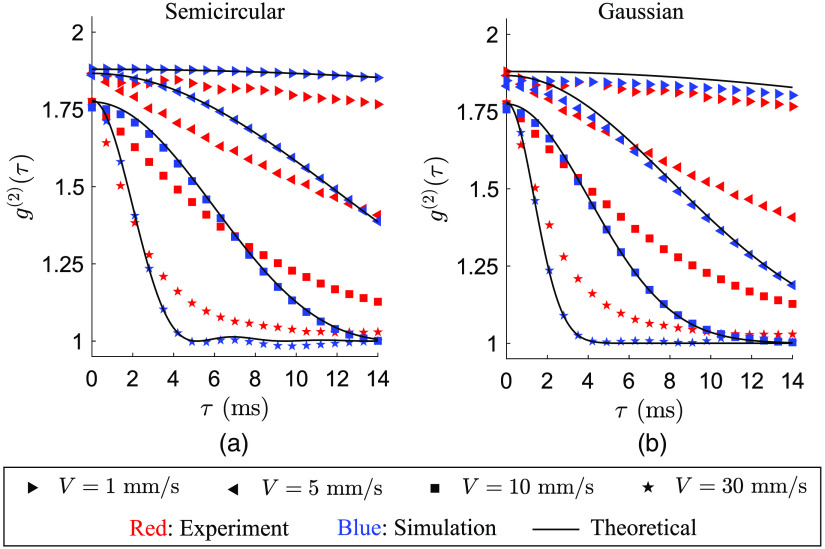
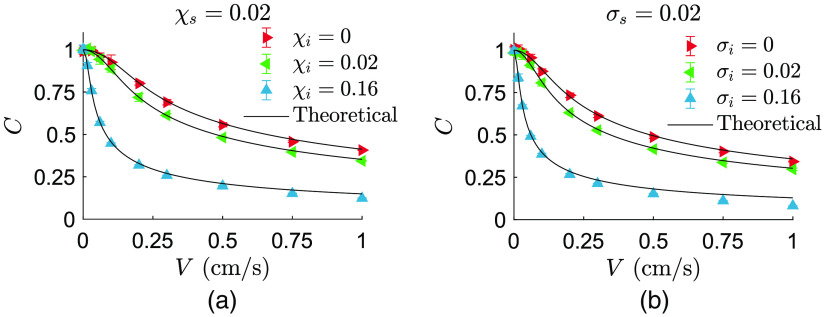
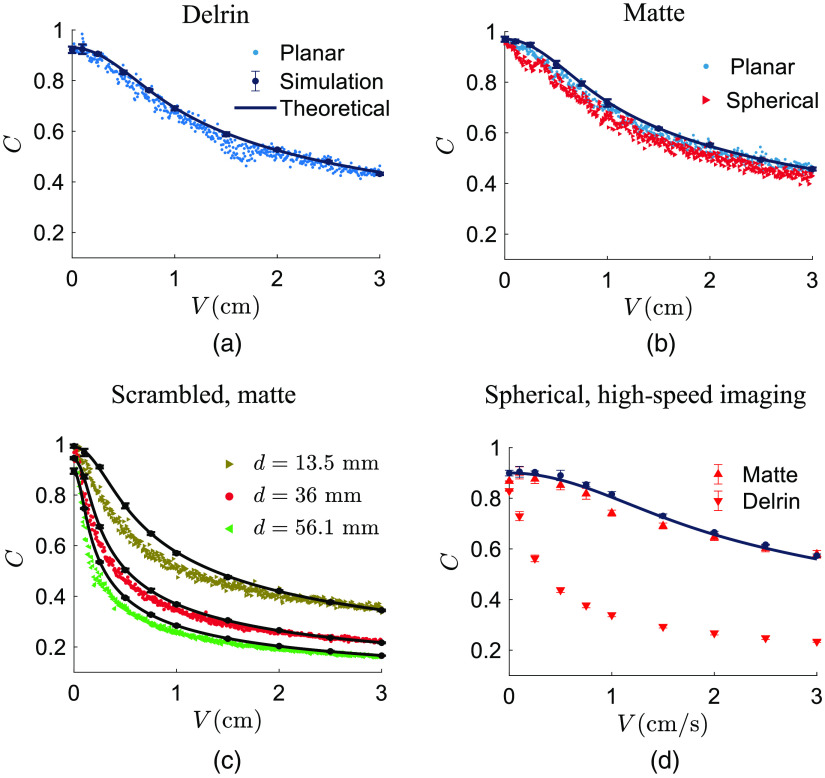
Approach: Our model calculates optical Doppler shifts in order to predict intensity correlation function and contrast of the time-integrated intensity as functions of applied speed based on illumination and detection wavevectors. To validate the theoretical predictions, computer simulation of the dynamic speckles has been carried out. Then experiments are performed by both high-speed and low-framerate imaging. The employed samples for the experiments are a highly scattering matte surface and a Delrin plate of finite scattering level in which volume scattering occurs.
Results: An agreement has been found between theoretical prediction, simulation, and experimental results of both intensity correlation functions and speckle contrast. Coefficients in the proposed model have been linked to the physical parameters according to the experimental setups.
Conclusions: The proposed model provides a quantitative description of the influence of the types of illumination and media in the creation of MA. The accurate prediction of MA caused by translation based on Doppler shifts makes our model suitable to study the influence of rotation. Also the model can be extended for the case of dynamic media, such as live tissue.
Keywords: Doppler effect; analytical models; biomedical optical imaging; computer simulation; laser speckle contrast imaging; model-driven development; motion artifacts; numerical analysis.
© 2023 The Authors.
Figures
Similar articles
-
Mitigation of Motion Artifacts in Handheld Laser Speckle Contrast Imaging Illustrated on Psoriasis Lesions.IEEE Trans Biomed Eng. 2025 Jan;72(1):70-78. doi: 10.1109/TBME.2024.3438375. Epub 2025 Jan 15. IEEE Trans Biomed Eng. 2025. PMID: 39102317
-
Speed-resolved perfusion imaging using multi-exposure laser speckle contrast imaging and machine learning.J Biomed Opt. 2023 Mar;28(3):036007. doi: 10.1117/1.JBO.28.3.036007. Epub 2023 Mar 20. J Biomed Opt. 2023. PMID: 36950019 Free PMC article.
-
Real-time, multi-spectral motion artefact correction and compensation for laser speckle contrast imaging.Sci Rep. 2022 Dec 15;12(1):21718. doi: 10.1038/s41598-022-26154-6. Sci Rep. 2022. PMID: 36522524 Free PMC article.
-
Laser speckle contrast imaging: theoretical and practical limitations.J Biomed Opt. 2013 Jun;18(6):066018. doi: 10.1117/1.JBO.18.6.066018. J Biomed Opt. 2013. PMID: 23807512 Review.
-
Laser speckle contrast imaging in biomedical optics.J Biomed Opt. 2010 Jan-Feb;15(1):011109. doi: 10.1117/1.3285504. J Biomed Opt. 2010. PMID: 20210435 Free PMC article. Review.
Cited by
-
Enhancement of vascular visualization in laser speckle contrast imaging based on image algorithms.J Biomed Opt. 2025 May;30(5):056010. doi: 10.1117/1.JBO.30.5.056010. Epub 2025 May 29. J Biomed Opt. 2025. PMID: 40444262 Free PMC article.
-
Wide dynamic range measurement of blood flow in vivo using laser speckle contrast imaging.J Biomed Opt. 2024 Jan;29(1):016009. doi: 10.1117/1.JBO.29.1.016009. Epub 2024 Jan 27. J Biomed Opt. 2024. PMID: 38283936 Free PMC article.
References
-
- Fercher A. F., Briers J. D., “Flow visualization by means of single-exposure speckle photography,” Opt. Commun. 37, 326–330 (1981).OPCOB810.1016/0030-4018(81)90428-4 - DOI
-
- Briers J. D., “Laser speckle contrast imaging for measuring blood flow,” Opt. Appl. 37, 139–152 (2007).
-
- Boudoux C., Fundamentals of Biomedical Optics: From Light Interactions with Cells to Complex Imaging Systems, Pollux; (2017).
