. 2023 Mar 15;3(1):ltad005.
doi: 10.1093/immadv/ltad005. eCollection 2023.

A systems approach evaluating the impact of SARS-CoV-2 variant of concern mutations on CD8+ T cell responses

Affiliations

A systems approach evaluating the impact of SARS-CoV-2 variant of concern mutations on CD8+ T cell responses

Paul R Buckley et al. Immunother Adv. .

Abstract

T cell recognition of SARS-CoV-2 antigens after vaccination and/or natural infection has played a central role in resolving SARS-CoV-2 infections and generating adaptive immune memory. However, the clinical impact of SARS-CoV-2-specific T cell responses is variable and the mechanisms underlying T cell interaction with target antigens are not fully understood. This is especially true given the virus' rapid evolution, which leads to new variants with immune escape capacity. In this study, we used the Omicron variant as a model organism and took a systems approach to evaluate the impact of mutations on CD8+ T cell immunogenicity. We computed an immunogenicity potential score for each SARS-CoV-2 peptide antigen from the ancestral strain and Omicron, capturing both antigen presentation and T cell recognition probabilities. By comparing ancestral vs. Omicron immunogenicity scores, we reveal a divergent and heterogeneous landscape of impact for CD8+ T cell recognition of mutated targets in Omicron variants. While T cell recognition of Omicron peptides is broadly preserved, we observed mutated peptides with deteriorated immunogenicity that may assist breakthrough infection in some individuals. We then combined our scoring scheme with an in silico mutagenesis, to characterise the position- and residue-specific theoretical mutational impact on immunogenicity. While we predict many escape trajectories from the theoretical landscape of substitutions, our study suggests that Omicron mutations in T cell epitopes did not develop under cell-mediated pressure. Our study provides a generalisable platform for fostering a deeper understanding of existing and novel variant impact on antigen-specific vaccine- and/or infection-induced T cell immunity.

Keywords: CD8 T cell response; SARS-CoV-2; T cell recognition potential; immunogenicity; machine-learning; systems immunology.


Conflict of interest statement

H.K. provides consultancy on spatiotemporal dynamics of antigen-specific cellular immunity.

Figures
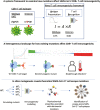
Graphical Abstract
Graphical Abstract
Figure 1.
Figure 1.
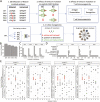
Study overview and identification of SARS-CoV-2-specific CD8+ T cell targets with mutation(s) in Omicron and its subvariants. (A) Overview of the study: (1) First, we identified the set of ‘Wuhan-mutated’ epitopes: CD8+ T cell targets from Wuhan Hu-1 with mutations in Omicron (BA.1) or its subvariants (BA.2, BA.4, and BA.5). (2) Using netMHCpan 4.1, we analysed the effects of mutations from aforementioned variants of concern on antigen presentation, through comparing predicted binding metrics (affinity nM, normalised binding affinity rank score) between Wuhan Hu-1 variant CD8+ T cell epitopes and counterpart mutant epitopes. To appropriately analyse potential bi-directional changes in antigen presentation between wildtype and mutant peptides, we incorporated wildtype-mutant (WT-MT) paired samples where (top) both WT and MT bind MHC k, where (middle) WT but not MT binds MHC k, and where (bottom) WT was not a ligand for MHC k in Wuhan-Hu-1 but the MT now binds MHC. (3) Next, we analysed the effects of the existing variant of concern mutations on T cell immunogenicity. T cell immunogenicity incorporates two key components: antigen presentation and T cell recognition. We, therefore, combined two scores for this analysis: (i) antigen presentation – generated by netMHCpan 4.1 – and (ii) T cell recognition, generated by an in-house deep learning model ‘TRAP’. (4) We next performed a comprehensive in silico mutagenesis to examine the effects of theoretical mutations on T cell immunogenicity. To do this, we first simulated each mutant (MT1…MTn) that can be generated via single-point substitutions for each WT Wuhan-mutated peptide of interest (WTi). For each wild-type and mutant peptide, we generated an immunogenicity score. Next, we analysed the effects of mutation on immunogenicity, through analysing WT-MT paired changes in immunogenicity score. In this article, we follow nomenclature where a ‘full’ mutation comprises three components: ‘A_x_B’. Here, residue ‘A’ is removed from epitope sequence position x and is replaced with residue ‘B’. Finally, we adopted the ‘neighbour-network’ framework of Ogishi et al. to visualise the effects of different residue substitutions, to help identify the most escape-prone mutations and understand how different mutations in different positions affect each epitope. (B) The number of CD8+ T cell targets that exhibit at least one mutation from BA.1 Omicron and/or derivative subvariants BA.2, BA.4, and BA.5. Numeric labels show the frequency of mutated CD8+ T cell epitopes, given a particular variant compared with the total number of assessed CD8+ T cell targets (n = 1380). (C) The distribution of the number of mutations found in CD8+ T cell targets across assessed variants of concern (with respect to Wuhan Hu-1). (D) The distribution of originating proteins for SARS-CoV-2 Wuhan Hu-1 CD8+ T cell targets with a mutation in each variant. (E) The landscape of amino acid substitutions across different variants of concern within CD8+ T cell targets of length nine residues. ‘X_Y’ on the y-axis indicates the removal of amino acid X, which is replaced by amino acid Y. The x-axis shows the position in the epitope where the mutation is observed. Red points highlight amino acid alterations which remove a ‘proline’.
Figure 2.
Figure 2.
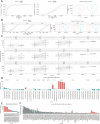
The impact of BA.1 Omicron and subvariant mutations on HLA binding of mutated SARS-CoV-2 CD8+ T cell targets. HLA binding predictions were made using netMHCpan 4.1. We analysed any paired wildtype (WT) or mutant (MT) samples where either the WT or the MT were predicted to bind MHC, to incorporate retained binding status and bi-directional transitions between WT and MT. Analyses were performed for the set of Wuhan Hu-1 CD8+ T cell targets with a mutation and their mutated counterparts. (A) empirical cumulative distribution (ECDF) plot showing (i) the cumulative frequency of peptides given the range of binding affinities (nM) for Wuhan-mutated vs BA.1 Omicron pMHC, (ii) the cumulative frequency of peptides, given the range of log10 transformed binding affinities (nM) for Wuhan-mutated vs BA.1 Omicron pMHC. (iii) Violin plots comparing the distribution of binding affinities (nM) between Wuhan-mutated pMHC and BA.1 Omicron mutants. Significance was assessed using a Wilcoxon rank test. Dashed line shows 500 nM. (B) (left) log10 transformed ECDF plots and (right) violin plots comparing the binding affinity (nM) of Wuhan-mutated vs. mutant pMHC, where the mutated epitope is derived from variants BA.2, BA.4, and BA.5. (C) Paired boxplots for different HLA supertypes (HLA-A02, HLA-A03, HLA-B07, and HLA-C01), comparing the binding affinities (nM, log 10) between Wuhan-mutated and mutant pMHC where the mutated epitope is derived from variants BA.2, BA.4, and BA.5. Significance was assessed using paired Wilcoxon rank tests. (D) Barplots showing log 10 scaled agretopicities (MT nM/WT nM), for BA.1 Omicron mutations affecting selected HLA-B07 supertype pMHC. Agretopicity > 0 indicates a detriment in HLA binding for the mutant compared with the wild type. Plots are colour labelled by whether the mutant pMHC is predicted to bind MHC or not (red). Red bars, therefore, indicate those mutant CD8+ T cell pMHC predicted to no longer bind MHC following variant mutation. (E) Barplots showing log10 scaled agretopicities for BA.1 mutations within CD8+ T cell targets that contain the spike glycoprotein motif ‘PRRA’. ‘PRRA’ is a motif unique to SARS-CoV-2, which is hypothesised to form a portion of a putative core of a theoretical SARS-CoV-2 superantigen. Plots are colour labelled by whether the mutant pMHC is predicted to bind MHC or not (red). (F) A barplot showing the number of HLAs predicted to bind each mutated wildtype epitope (labelled: Wuhan_Binders) vs. the Omicron BA.1 counterpart (labelled: Omicron_Binders).
Figure 3.
Figure 3.
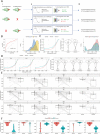
The predicted impact of BA.1 Omicron and subvariant mutations on T cell immunogenicity of SARS-CoV-2 CD8+ T cell targets. Analyses were only performed for the set of Wuhan Hu-1 CD8+ T cell targets with a mutation and their mutated counterparts (WT-MT). T cell immunogenicity incorporates (i) antigen presentation predictions by netMHCpan 4.1 and (ii) T cell recognition predictions by TRAP. (A) An overview of how the T cell immunogenicity scores were generated and the different scenarios by which imputations of pseudo-zero ‘T cell recognition’ scores (0.01) were made. TRAP by definition makes T-cell recognition predictions against peptides bound to MHC k. Thus, given three potential bi-directional changes in WT vs. MT binding status, three scenarios are captured. Row 1 shows a setting where for a particular CD8+ T cell target, the wildtype peptide and mutant peptide, both bind MHC k. Here, antigen presentation predictions were made by netMHCpan which were combined with T cell recognition scores from TRAP (see ‘Methods’ section for full details), no imputations were made. The immunogenicity score combines these two predictions. Row 2 shows a setting where the wildtype peptide binds MHC k, although the mutant – following Omicron mutation – does not. Here, antigen presentation is predicted using netMHCpan for both wild-type and mutant (the mutant will accordingly receive a low MHC binding score). TRAP, however, cannot make a T cell recognition prediction for a peptide not predicted to bind MHC k, therefore, we impute a pseudo-zero value of 0.01 for the mutant. A similar situation is depicted in row 3, however, here, the wildtype was not predicted to bind MHC k thus was not immunogenic, however, after Omicron mutation, antigen presentation status was observed. Here, we impute a TRAP score for the non-binding wild type and make a TRAP prediction for the presented mutant. (B) ROC curve and density plot evaluating the performance of TRAP against 66 known SARS-CoV-2 Wuhan Hu-1 CD8+ T cell targets with a mutation in Omicron (immunogenic Wuhan Hu-1 set, yellow) vs. 10 sets of 66 functionally evaluated non-immunogenic SARS-CoV-2 prediction scores made by TRAP, which were randomly sampled from a 10-fold cross-validation of training data (control, blue). ROC curves show the performance of a model through perturbing classification thresholding and visualising the true positive rate (fraction of true positives/all true positives) against the false positive rate (fraction of false positives/all true negatives). Curve information is summarised using the area under the curve (AUC). Given a balanced dataset for binary classification (50% per classification), an unskilled model will have a ROC-AUC of 0.5, reflecting only the balance in the dataset. A perfect model would have a ROC-AUC of 1.0. (C) Empirical cumulative distribution (ECDF) plot, violin plot, and density plot comparing the predicted T cell immunogenicity scores of Wuhan-mutated vs. Omicron BA.1 pMHC. Significance was assessed using a Wilcoxon rank test. (D) ECDF and violin plots comparing T cell immunogenicity scores of Wuhan-mutated pMHC vs. Omicron subvariant BA.2, BA.4, and BA.5 counterparts. Significance was assessed using Wilcoxon rank tests. (E) Paired boxplots for different HLA supertypes (HLA-A02, HLA-A03, HLA-B07, and HLA-C01), comparing the T cell immunogenicity scores between Wuhan-mutated epitopes and Omicron variant mutated counterparts. Significance was assessed using paired Wilcoxon rank tests. (F) Violin plots contrasting the Wuhan vs. BA.1 Omicron T cell immunogenicity scores for spike mutations; D614G, G446S, G339D, N501Y, Q493R, and Q498R. Significance was assessed using a Wilcoxon rank test.
Figure 4.
Figure 4.
The overall impact of Omicron mutations on immunogenic potential of pMHC and individual TCR repertoires. (A) Barplots showing the relative immunogenic potential (RI) score for each pMHC affected by a mutation in BA.1 Omicron. Labels are truncated for visual clarity. RI scores for each pMHC are supplied in Supplementary datafile 3. Colour labelling represents groups of pMHC by wildtype←→ mutant binding status: WT_BINDER_MT_BINDER (blue), WT_BINDER_MT_NONBINDER (red), and WT_NONBINDER_MT_BINDER (green), representing, respectively, pMHC where both the WT and MT bind the same MHC (blue), the WT binds a particular MHC but the mutant does not (red), the WT does not bind a particular MHC that the mutant does (green). RI is produced for each pMHC. (B) Barplot showing the frequency of individual MIRA TCR-epitope repertoires (excluding healthy individuals) which exhibit a mutation in BA.1 Omicron. (C) Barplot showing the mean ± standard error for ‘RI’ scores for each individual MIRA TCR-epitope repertoire. BA.1 only. As MIRA antigen-specific data do not explicitly label the bound MHC to the antigen, RI scores here are computed for each peptide, thus represent the mean RI across predicted MHC (pan-HLA RI). Scores of ‘zero’ are imputed for non-mutated epitopes, thus representing no change in immunogenicity between Wuhan Hu-1 and BA1 Omicron. Visually, ‘pan HLA’ RI scores are summarised here for each patient.
Figure 5.
Figure 5.
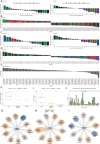
The effects of theoretical mutations on SARS-CoV-2-specific CD8+ T cell epitopes. (A–D) Barplots showing the mean ± standard error of log ratios derived from comparing mutant/wildtype immunogenicity scores from simulated mutations in TCR contact positions of (A and B) 9-mers and (C and D) 10-mers. Negative log ratios demonstrate that the mutant is less immunogenic than the wild type and vice versa. (A) Barplot showing for each amino acid residue, the mean ± standard error across of all log ratios (9-mers). Left plot shows the log ratios upon removing a particular amino acid from the wildtype sequence. Right plot shows the log ratios upon imputing a particular amino acid in the mutant. Colour labels show chemistry of amino acids. (B) The highest and lowest 5% of log ratios derived by analysing the full mutations (A_x_B) simulated in TCR contact positions of 9-mers. Colour label shows the chemistry of the removed amino acid. (C) Barplot showing for each amino acid residue, the mean ± standard error across all log ratios (10-mers). Left plot shows the log ratios derived from removing a particular amino acid from the wildtype sequence. Right plot shows the log ratios derived from imputing a particular amino acid into the mutant. Colour labels show chemistry of amino acids. (D) Highest and lowest 30% of log ratios showing impact on immunogenicity for replacing residues (i.e. those amino acids inserted) into position x of TCR contact positions of 10-mers. (E) Barplot showing ‘escape scores’: the mean ± standard error of the difference between WT and MT (WT minus MT) immunogenicity scores affecting each assessed SARS-CoV-2 CD8+ T cell target (see Methods for full details). (F) (i) Boxplot comparing the proportion of hydrophobic residues in non-TCR contact positions of three groups of peptides (n = 9 per group, containing both 9- and 10-mers): (blue) ‘high’, (yellow) ‘negligible’, and (grey) ‘negative’, grouping epitopes with (blue) highest escape score, (yellow) escape score approx. 0, and (grey) negative escape scores, respectively. Nine samples were chosen to maximise samples whilst comparing the same quantity of peptides across groups. Significance was assessed using a Wilcoxon rank test. (ii) Boxplots comparing the number of HLAs predicted to bind the nine selected wildtype peptides for each ‘escape score’ group of interest. (iii) Barplot showing the number of times each hydrophobic amino acid is observed in wildtype peptides composing the three ‘escape’ groups. A control group (CTRL, red) was generated to assess significance. The control group represents a bootstrapped background distribution of counts of hydrophobic amino acids from sampling nine peptides randomly from the entire distribution of Wuhan-mutated 9- and 10-mer peptides. Crossbars show standard error. (G–I) Neighbour-network diagrams depicting the impact of mutation via network trajectories from the wildtype peptide (centre) to each single amino acid variant. Clusters and individual mutants are colour labelled by immunogenicity score. Groups are clustered by location of the substitution. An x in the consensus sequence by the cluster indicates the position of the substitution that characterises the cluster.

Similar articles

Cited by

References

    1. Sigal A. Milder disease with Omicron: is it the virus or the pre-existing immunity? Nat Rev Immunol 2022;22:69–71. 10.1038/s41577-022-00678-4 - DOI - PMC - PubMed
    1. Willett BJ, Grove J, MacLean OAet al. . SARS-CoV-2 Omicron is an immune escape variant with an altered cell entry pathway. Nat Microbiol 2022;7:1161–79. 10.1038/s41564-022-01143-7 - DOI - PMC - PubMed
    1. Cele S, Jackson L, Khoury DSet al. . Omicron extensively but incompletely escapes Pfizer BNT162b2 neutralization. Nature 2022;602:654–6. 10.1038/s41586-021-04387-1 - DOI - PMC - PubMed
    1. Cao Y, Wang J, Jian Fet al. . Omicron escapes the majority of existing SARS-CoV-2 neutralizing antibodies. Nature 2022;602:657–63. 10.1038/s41586-021-04385-3 - DOI - PMC - PubMed
    1. Cameroni E, Bowen JE, Rosen LEet al. . Broadly neutralizing antibodies overcome SARS-CoV-2 Omicron antigenic shift. Nature 2022;602:664–70. 10.1038/s41586-021-04386-2 - DOI - PMC - PubMed

LinkOut - more resources