

Analysis of the P. lividus sea urchin genome highlights contrasting trends of genomic and regulatory evolution in deuterostomes
- PMID: 37082140
- PMCID: PMC10112332
- DOI: 10.1016/j.xgen.2023.100295
Analysis of the P. lividus sea urchin genome highlights contrasting trends of genomic and regulatory evolution in deuterostomes
Abstract
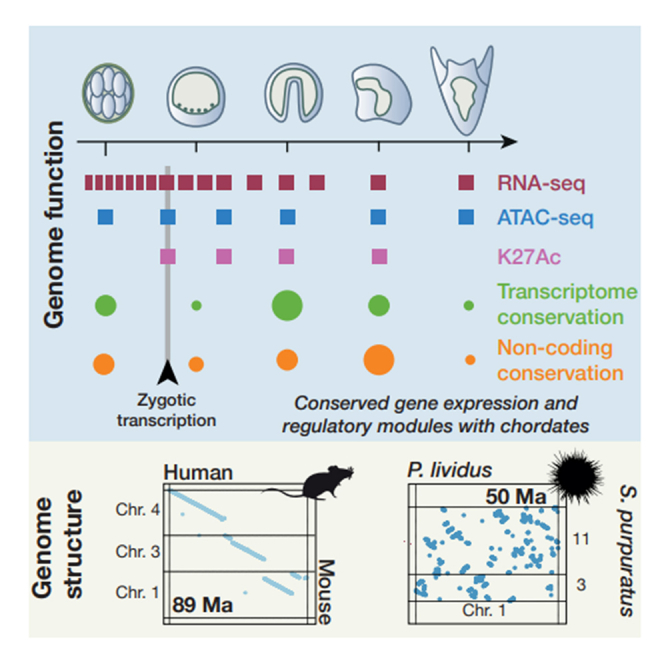
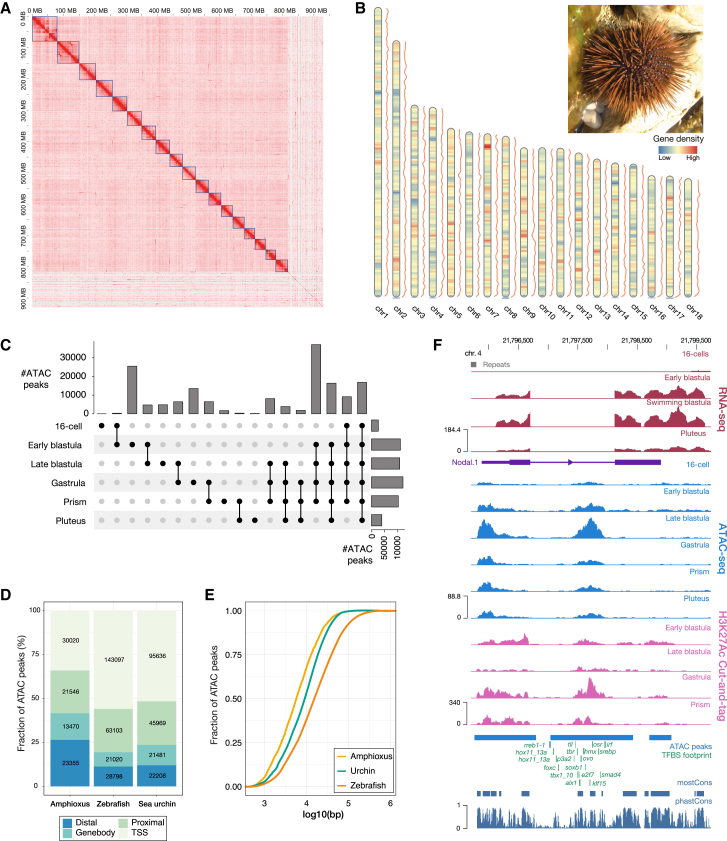
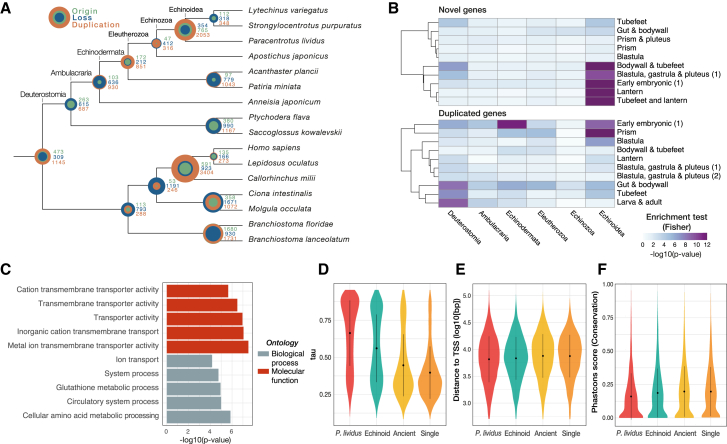
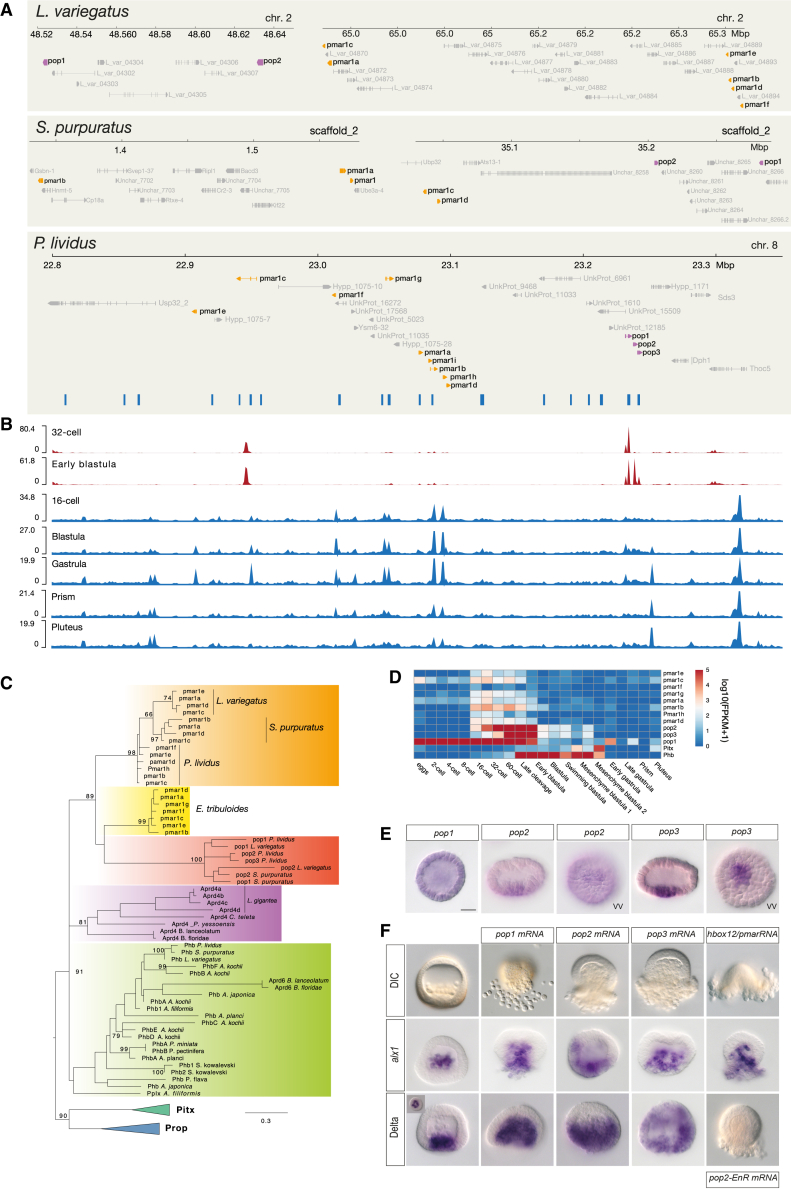
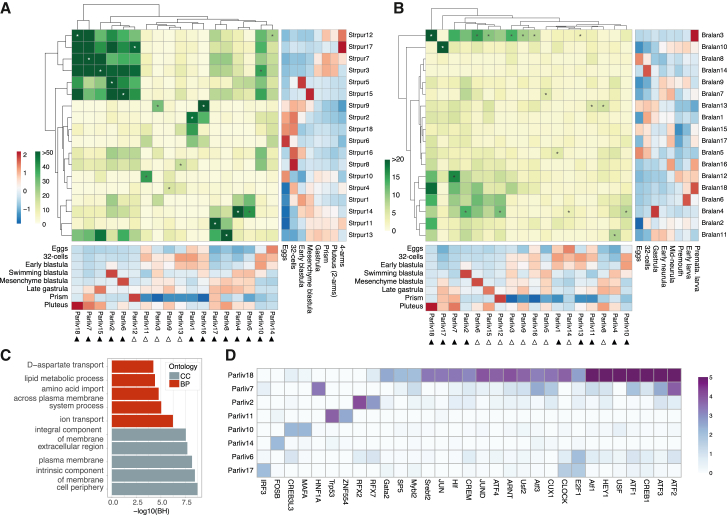
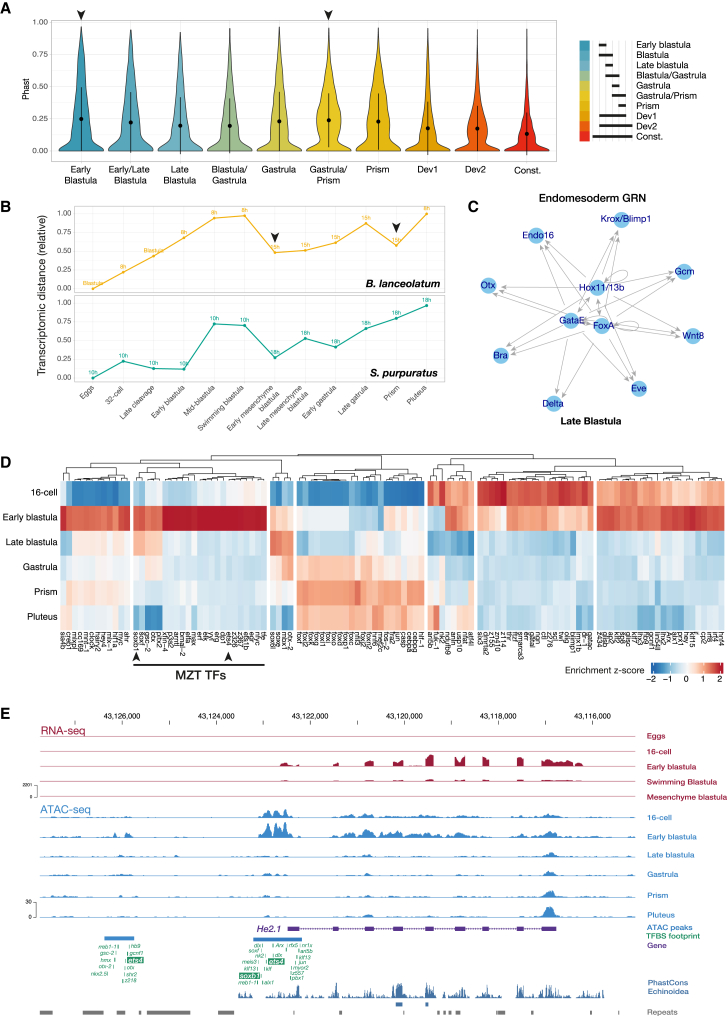
Sea urchins are emblematic models in developmental biology and display several characteristics that set them apart from other deuterostomes. To uncover the genomic cues that may underlie these specificities, we generated a chromosome-scale genome assembly for the sea urchin Paracentrotus lividus and an extensive gene expression and epigenetic profiles of its embryonic development. We found that, unlike vertebrates, sea urchins retained ancestral chromosomal linkages but underwent very fast intrachromosomal gene order mixing. We identified a burst of gene duplication in the echinoid lineage and showed that some of these expanded genes have been recruited in novel structures (water vascular system, Aristotle's lantern, and skeletogenic micromere lineage). Finally, we identified gene-regulatory modules conserved between sea urchins and chordates. Our results suggest that gene-regulatory networks controlling development can be conserved despite extensive gene order rearrangement.
© 2023 The Author(s).
Conflict of interest statement
The authors declare no competing interests.
Figures


Similar articles
-
Generation, annotation, evolutionary analysis, and database integration of 20,000 unique sea urchin EST clusters.Genome Res. 2003 Dec;13(12):2736-46. doi: 10.1101/gr.1674103. Genome Res. 2003. PMID: 14656975 Free PMC article.
-
A wnt2 ortholog in the sea urchin Paracentrotus lividus.Genesis. 2019 Nov;57(11-12):e23331. doi: 10.1002/dvg.23331. Epub 2019 Sep 3. Genesis. 2019. PMID: 31479176
-
De Novo Assembly of the Genome of the Sea Urchin Paracentrotus lividus (Lamarck 1816).Int J Mol Sci. 2024 Jan 30;25(3):1685. doi: 10.3390/ijms25031685. Int J Mol Sci. 2024. PMID: 38338963 Free PMC article.
-
From genome to anatomy: The architecture and evolution of the skeletogenic gene regulatory network of sea urchins and other echinoderms.Genesis. 2018 Oct;56(10):e23253. doi: 10.1002/dvg.23253. Genesis. 2018. PMID: 30264451 Free PMC article. Review.
-
Shedding genomic light on Aristotle's lantern.Dev Biol. 2006 Dec 1;300(1):2-8. doi: 10.1016/j.ydbio.2006.10.005. Epub 2006 Oct 10. Dev Biol. 2006. PMID: 17097628 Review.
Cited by
-
Hemichordate cis-regulatory genomics and the gene expression dynamics of deuterostomes.Nat Ecol Evol. 2024 Dec;8(12):2213-2227. doi: 10.1038/s41559-024-02562-x. Epub 2024 Oct 18. Nat Ecol Evol. 2024. PMID: 39424956 Free PMC article.
-
Single-cell transcriptomics reveals evolutionary reconfiguration of embryonic cell fate specification in the sea urchin Heliocidaris erythrogramma.bioRxiv [Preprint]. 2024 May 1:2024.04.30.591752. doi: 10.1101/2024.04.30.591752. bioRxiv. 2024. Update in: Genome Biol Evol. 2025 Jan 6;17(1):evae258. doi: 10.1093/gbe/evae258. PMID: 38746376 Free PMC article. Updated. Preprint.
-
Chromosome-level genome assemblies of 2 hemichordates provide new insights into deuterostome origin and chromosome evolution.PLoS Biol. 2024 Jun 3;22(6):e3002661. doi: 10.1371/journal.pbio.3002661. eCollection 2024 Jun. PLoS Biol. 2024. PMID: 38829909 Free PMC article.
-
Annelid Comparative Genomics and the Evolution of Massive Lineage-Specific Genome Rearrangement in Bilaterians.Mol Biol Evol. 2024 Sep 4;41(9):msae172. doi: 10.1093/molbev/msae172. Mol Biol Evol. 2024. PMID: 39141777 Free PMC article.
-
Chromosome-level genome assembly and annotation of the black sea urchin Arbacia lixula (Linnaeus, 1758).DNA Res. 2024 Aug 1;31(4):dsae020. doi: 10.1093/dnares/dsae020. DNA Res. 2024. PMID: 38908014 Free PMC article.
References
-
- Aristotle, Ross D., Smith A., J., Thompson, Wentworth D. Vol. 4. Historia animalium (Oxford University Press; 1910. (The Works of Aristotle).
-
- Mooi R., David B. Radial symmetry, the anterior/posterior Axis, and echinoderm hox genes. Annu. Rev. Ecol. Evol. Syst. 2008;39:43–62. doi: 10.1146/annurev.ecolsys.39.110707.173521. - DOI
-
- Bruguière J.G. Chez Panckoucke; 1792. Histoire naturelle des vers.
LinkOut - more resources
Full Text Sources
Molecular Biology Databases
