

The genetic basis of adaptation to copper pollution in Drosophila melanogaster
- PMID: 37082199
- PMCID: PMC10110907
- DOI: 10.3389/fgene.2023.1144221
The genetic basis of adaptation to copper pollution in Drosophila melanogaster
Abstract
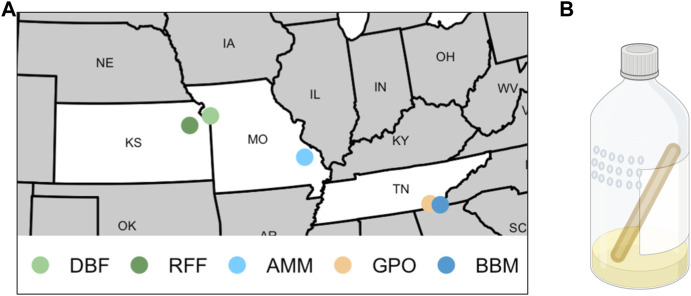
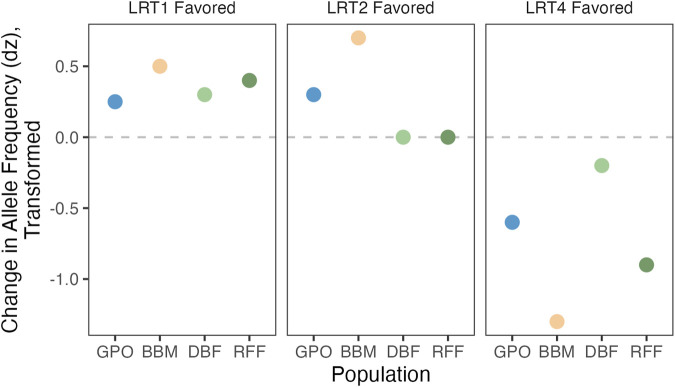
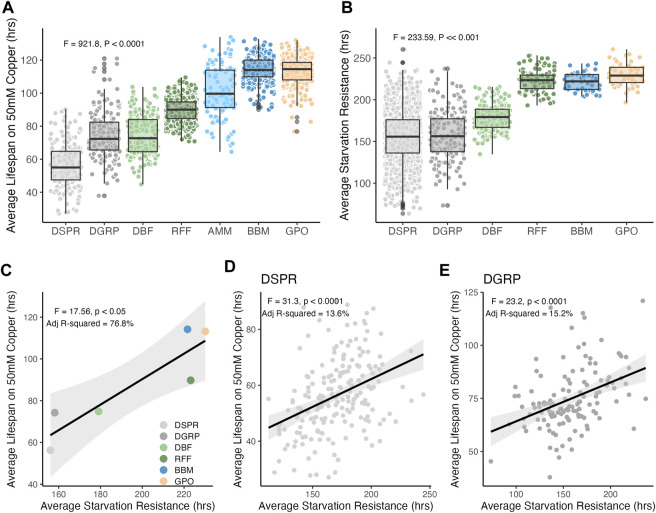
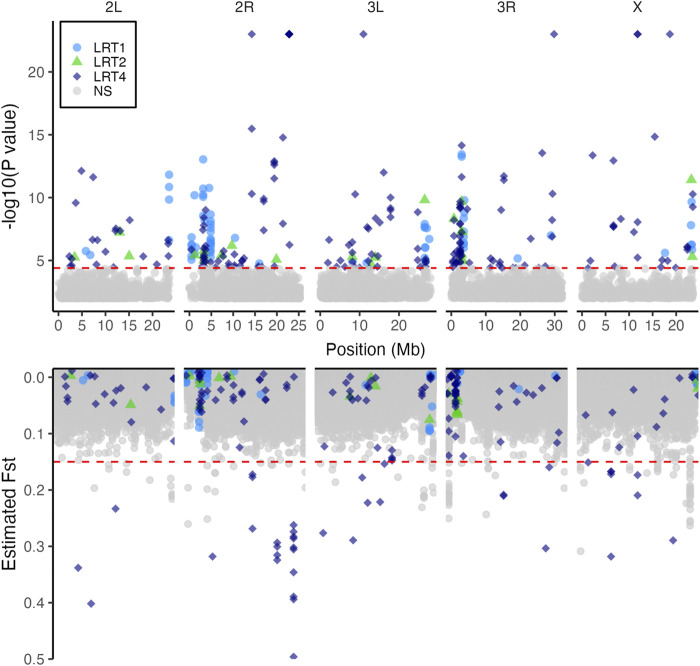
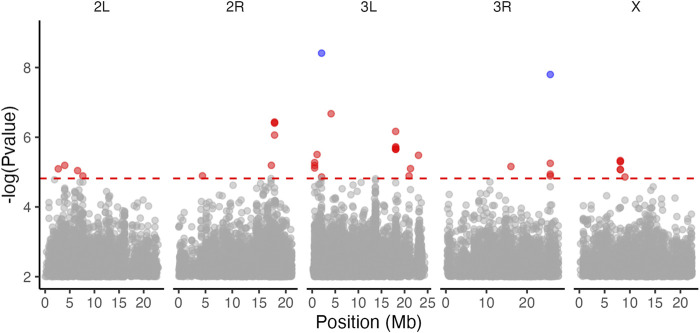
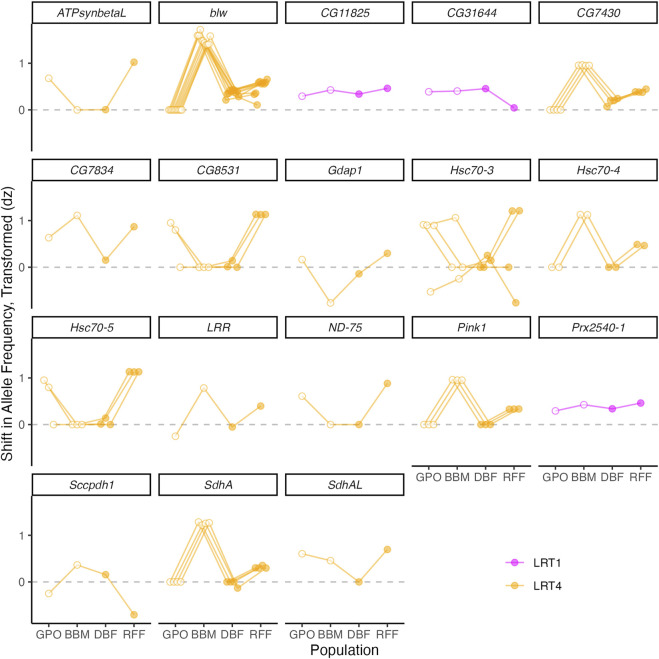
Introduction: Heavy metal pollutants can have long lasting negative impacts on ecosystem health and can shape the evolution of species. The persistent and ubiquitous nature of heavy metal pollution provides an opportunity to characterize the genetic mechanisms that contribute to metal resistance in natural populations. Methods: We examined variation in resistance to copper, a common heavy metal contaminant, using wild collections of the model organism Drosophila melanogaster. Flies were collected from multiple sites that varied in copper contamination risk. We characterized phenotypic variation in copper resistance within and among populations using bulked segregant analysis to identify regions of the genome that contribute to copper resistance. Results and Discussion: Copper resistance varied among wild populations with a clear correspondence between resistance level and historical exposure to copper. We identified 288 SNPs distributed across the genome associated with copper resistance. Many SNPs had population-specific effects, but some had consistent effects on copper resistance in all populations. Significant SNPs map to several novel candidate genes involved in refolding disrupted proteins, energy production, and mitochondrial function. We also identified one SNP with consistent effects on copper resistance in all populations near CG11825, a gene involved in copper homeostasis and copper resistance. We compared the genetic signatures of copper resistance in the wild-derived populations to genetic control of copper resistance in the Drosophila Synthetic Population Resource (DSPR) and the Drosophila Genetic Reference Panel (DGRP), two copper-naïve laboratory populations. In addition to CG11825, which was identified as a candidate gene in the wild-derived populations and previously in the DSPR, there was modest overlap of copper-associated SNPs between the wild-derived populations and laboratory populations. Thirty-one SNPs associated with copper resistance in wild-derived populations fell within regions of the genome that were associated with copper resistance in the DSPR in a prior study. Collectively, our results demonstrate that the genetic control of copper resistance is highly polygenic, and that several loci can be clearly linked to genes involved in heavy metal toxicity response. The mixture of parallel and population-specific SNPs points to a complex interplay between genetic background and the selection regime that modifies the effects of genetic variation on copper resistance.
Keywords: Drosophila; genome wide association; heavy metals; stress resistance; toxicity.
Copyright © 2023 Everman, Macdonald and Kelly.
Conflict of interest statement
The authors declare that the research was conducted in the absence of any commercial or financial relationships that could be construed as a potential conflict of interest.
Figures
Similar articles
-
Gene expression variation underlying tissue-specific responses to copper stress in Drosophila melanogaster.G3 (Bethesda). 2024 Mar 6;14(3):jkae015. doi: 10.1093/g3journal/jkae015. G3 (Bethesda). 2024. PMID: 38262701 Free PMC article.
-
Characterizing the genetic basis of copper toxicity in Drosophila reveals a complex pattern of allelic, regulatory, and behavioral variation.Genetics. 2021 Mar 3;217(1):1-20. doi: 10.1093/genetics/iyaa020. Genetics. 2021. PMID: 33683361 Free PMC article.
-
Dissection of Complex, Fitness-Related Traits in Multiple Drosophila Mapping Populations Offers Insight into the Genetic Control of Stress Resistance.Genetics. 2019 Apr;211(4):1449-1467. doi: 10.1534/genetics.119.301930. Epub 2019 Feb 13. Genetics. 2019. PMID: 30760490 Free PMC article.
-
The Minderoo-Monaco Commission on Plastics and Human Health.Ann Glob Health. 2023 Mar 21;89(1):23. doi: 10.5334/aogh.4056. eCollection 2023. Ann Glob Health. 2023. PMID: 36969097 Free PMC article. Review.
-
Drosophila melanogaster Models of Metal-Related Human Diseases and Metal Toxicity.Int J Mol Sci. 2017 Jul 6;18(7):1456. doi: 10.3390/ijms18071456. Int J Mol Sci. 2017. PMID: 28684721 Free PMC article. Review.
Cited by
-
Independently evolved pollution resistance in four killifish populations is largely explained by few variants of large effect.Evol Appl. 2024 Jan 29;17(1):e13648. doi: 10.1111/eva.13648. eCollection 2024 Jan. Evol Appl. 2024. PMID: 38293268 Free PMC article.
-
Gene expression variation underlying tissue-specific responses to copper stress in Drosophila melanogaster.bioRxiv [Preprint]. 2023 Jul 18:2023.07.12.548746. doi: 10.1101/2023.07.12.548746. bioRxiv. 2023. Update in: G3 (Bethesda). 2024 Mar 6;14(3):jkae015. doi: 10.1093/g3journal/jkae015. PMID: 37503205 Free PMC article. Updated. Preprint.
-
Gene expression variation underlying tissue-specific responses to copper stress in Drosophila melanogaster.G3 (Bethesda). 2024 Mar 6;14(3):jkae015. doi: 10.1093/g3journal/jkae015. G3 (Bethesda). 2024. PMID: 38262701 Free PMC article.
-
Identification of a longevity gene through evolutionary rate covariation of insect mito-nuclear genomes.Nat Aging. 2024 Aug;4(8):1076-1088. doi: 10.1038/s43587-024-00641-z. Epub 2024 Jun 4. Nat Aging. 2024. PMID: 38834883
References
-
- Adams S. V., Barrick B., Christopher E. P., Shafer M. M., Makar K. W., Song X., et al. (2015). Genetic variation in metallothionein and metal-regulatory transcription factor 1 in relation to urinary cadmium, copper, and zinc. Toxicol. Appl. Pharmacol. 289, 381–388. 10.1016/j.taap.2015.10.024 - DOI - PMC - PubMed
-
- Ali H., Khan E. (2019). Trophic transfer, bioaccumulation, and biomagnification of non-essential hazardous heavy metals and metalloids in food chains/webs—concepts and implications for wildlife and human health. Hum. Ecol. Risk Assess. Int. J. 25, 1353–1376. 10.1080/10807039.2018.1469398 - DOI
-
- Ali H., Khan E., Ilahi I. (2019). Environmental chemistry and ecotoxicology of hazardous heavy metals: Environmental persistence, toxicity, and bioaccumulation. J. Chem. 2019, 1–14. 10.1155/2019/6730305 - DOI
Associated data
Grants and funding
LinkOut - more resources
Full Text Sources
Molecular Biology Databases