

Integrating multiple machine learning algorithms for prognostic prediction of gastric cancer based on immune-related lncRNAs
- PMID: 37082204
- PMCID: PMC10111190
- DOI: 10.3389/fgene.2023.1106724
Integrating multiple machine learning algorithms for prognostic prediction of gastric cancer based on immune-related lncRNAs
Abstract
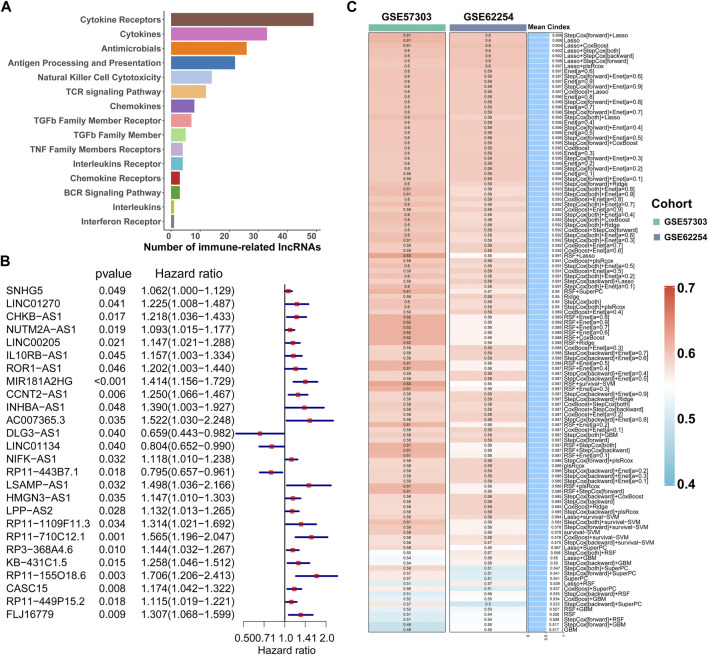
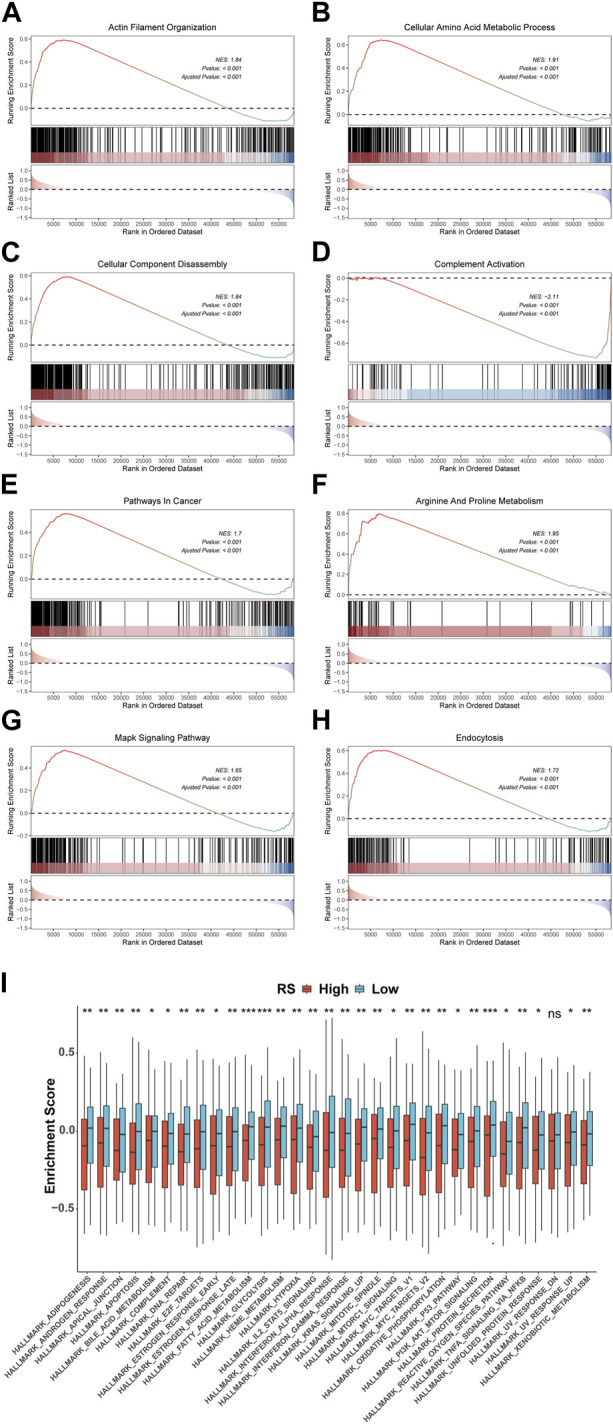
Background: Long non-coding RNAs (lncRNAs) play an important role in the immune regulation of gastric cancer (GC). However, the clinical application value of immune-related lncRNAs has not been fully developed. It is of great significance to overcome the challenges of prognostic prediction and classification of gastric cancer patients based on the current study. Methods: In this study, the R package ImmLnc was used to obtain immune-related lncRNAs of The Cancer Genome Atlas Stomach Adenocarcinoma (TCGA-STAD) project, and univariate Cox regression analysis was performed to find prognostic immune-related lncRNAs. A total of 117 combinations based on 10 algorithms were integrated to determine the immune-related lncRNA prognostic model (ILPM). According to the ILPM, the least absolute shrinkage and selection operator (LASSO) regression was employed to find the major lncRNAs and develop the risk model. ssGSEA, CIBERSORT algorithm, the R package maftools, pRRophetic, and clusterProfiler were employed for measuring the proportion of immune cells among risk groups, genomic mutation difference, drug sensitivity analysis, and pathway enrichment score. Results: A total of 321 immune-related lncRNAs were found, and there were 26 prognostic immune-related lncRNAs. According to the ILPM, 18 of 26 lncRNAs were selected and the risk score (RS) developed by the 18-lncRNA signature had good strength in the TCGA training set and Gene Expression Omnibus (GEO) validation datasets. Patients were divided into high- and low-risk groups according to the median RS, and the low-risk group had a better prognosis, tumor immune microenvironment, and tumor signature enrichment score and a higher metabolism, frequency of genomic mutations, proportion of immune cell infiltration, and antitumor drug resistance. Furthermore, 86 differentially expressed genes (DEGs) between high- and low-risk groups were mainly enriched in immune-related pathways. Conclusion: The ILPM developed based on 26 prognostic immune-related lncRNAs can help in predicting the prognosis of patients suffering from gastric cancer. Precision medicine can be effectively carried out by dividing patients into high- and low-risk groups according to the RS.
Keywords: ILPM; gastric cancer; immunity; machine learning; prognosis.
Copyright © 2023 Li, Huo, Guo, Li, Ma, Liu, Xie, Zhang, Qu and Chen.
Conflict of interest statement
The authors declare that the research was conducted in the absence of any commercial or financial relationships that could be construed as a potential conflict of interest.
Figures


Similar articles
-
Construction and Validation of a Novel Pyroptosis-Related Four-lncRNA Prognostic Signature Related to Gastric Cancer and Immune Infiltration.Front Immunol. 2022 Mar 22;13:854785. doi: 10.3389/fimmu.2022.854785. eCollection 2022. Front Immunol. 2022. PMID: 35392086 Free PMC article.
-
Identification of a novel defined inflammation-related long noncoding RNA signature contributes to predicting prognosis and distinction between the cold and hot tumors in bladder cancer.Front Oncol. 2023 Mar 29;13:972558. doi: 10.3389/fonc.2023.972558. eCollection 2023. Front Oncol. 2023. PMID: 37064115 Free PMC article.
-
Identification of cuproptosis-related subtypes, construction of a prognosis model, and tumor microenvironment landscape in gastric cancer.Front Immunol. 2022 Nov 21;13:1056932. doi: 10.3389/fimmu.2022.1056932. eCollection 2022. Front Immunol. 2022. PMID: 36479114 Free PMC article.
-
Systematic Analysis and Identification of Molecular Subtypes of TRP-Related Genes and Prognosis Prediction in Lung Adenocarcinoma.J Oncol. 2022 Aug 31;2022:5388283. doi: 10.1155/2022/5388283. eCollection 2022. J Oncol. 2022. PMID: 36090899 Free PMC article.
-
Development and verification of a 7-lncRNA prognostic model based on tumor immunity for patients with ovarian cancer.J Ovarian Res. 2023 Feb 4;16(1):31. doi: 10.1186/s13048-023-01099-0. J Ovarian Res. 2023. PMID: 36739404 Free PMC article.
Cited by
-
Machine learning-based analysis identifies a 13-gene prognostic signature to improve the clinical outcomes of colorectal cancer.J Gastrointest Oncol. 2024 Oct 31;15(5):2100-2116. doi: 10.21037/jgo-24-325. Epub 2024 Oct 24. J Gastrointest Oncol. 2024. PMID: 39554586 Free PMC article.
-
Bioinformatics Analysis and Validation of Potential Markers Associated with Prediction and Prognosis of Gastric Cancer.Int J Mol Sci. 2024 May 28;25(11):5880. doi: 10.3390/ijms25115880. Int J Mol Sci. 2024. PMID: 38892067 Free PMC article. Review.
-
LINC01134: a pivotal oncogene with promising predictive maker and therapeutic target in hepatocellular carcinoma.Front Oncol. 2024 Feb 21;14:1265762. doi: 10.3389/fonc.2024.1265762. eCollection 2024. Front Oncol. 2024. PMID: 38450182 Free PMC article. Review.
-
Multi-Omics Mining of lncRNAs with Biological and Clinical Relevance in Cancer.Int J Mol Sci. 2023 Nov 22;24(23):16600. doi: 10.3390/ijms242316600. Int J Mol Sci. 2023. PMID: 38068923 Free PMC article. Review.
References
-
- Amin M. B., Greene F. L., Edge S. B., Compton C. C., Gershenwald J. E., Brookland R. K., et al. (2017). The Eighth Edition AJCC Cancer Staging Manual: Continuing to build a bridge from a population-based to a more "personalized" approach to cancer staging. CA Cancer J. Clin. 67 (2), 93–99. 10.3322/caac.21388 - DOI - PubMed
-
- Bang Y. J., Kang Y. K., Catenacci D. V., Muro K., Fuchs C. S., Geva R., et al. (2019). Pembrolizumab alone or in combination with chemotherapy as first-line therapy for patients with advanced gastric or gastroesophageal junction adenocarcinoma: Results from the phase II nonrandomized KEYNOTE-059 study. Gastric Cancer 22 (4), 828–837. 10.1007/s10120-018-00909-5 - DOI - PMC - PubMed
LinkOut - more resources
Full Text Sources
Miscellaneous