

p120-catenin subfamily members have distinct as well as shared effects on dendrite morphology during neuron development in vitro
- PMID: 37082208
- PMCID: PMC10112520
- DOI: 10.3389/fncel.2023.1151249
p120-catenin subfamily members have distinct as well as shared effects on dendrite morphology during neuron development in vitro
Abstract
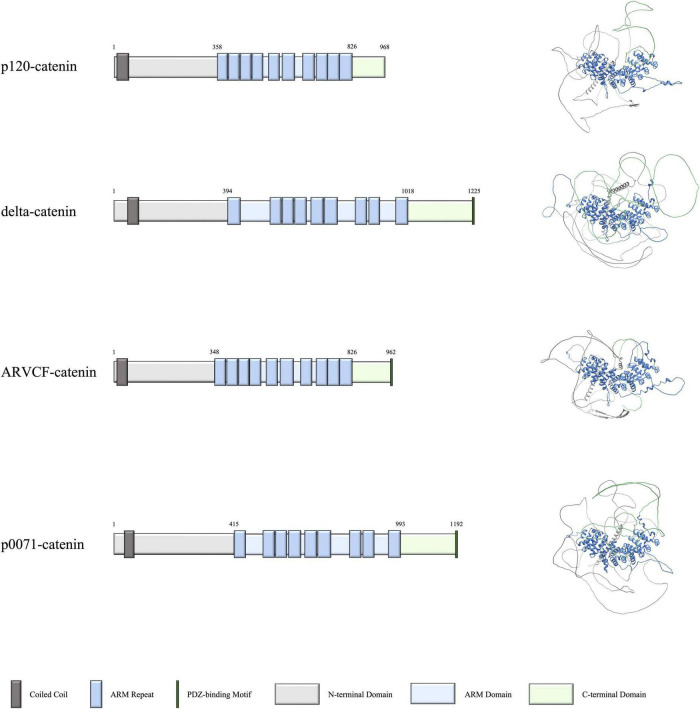
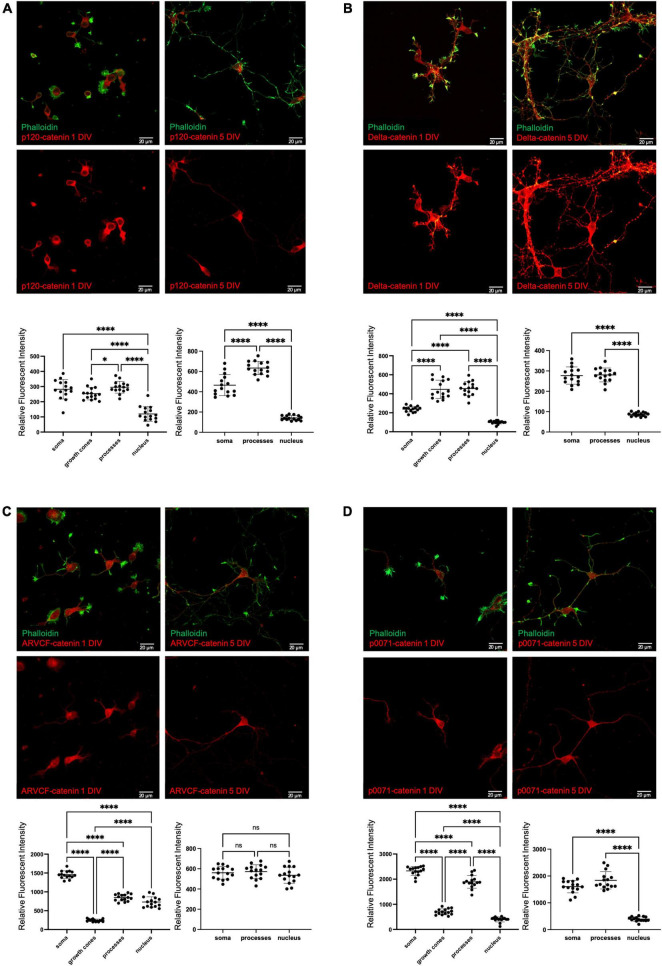
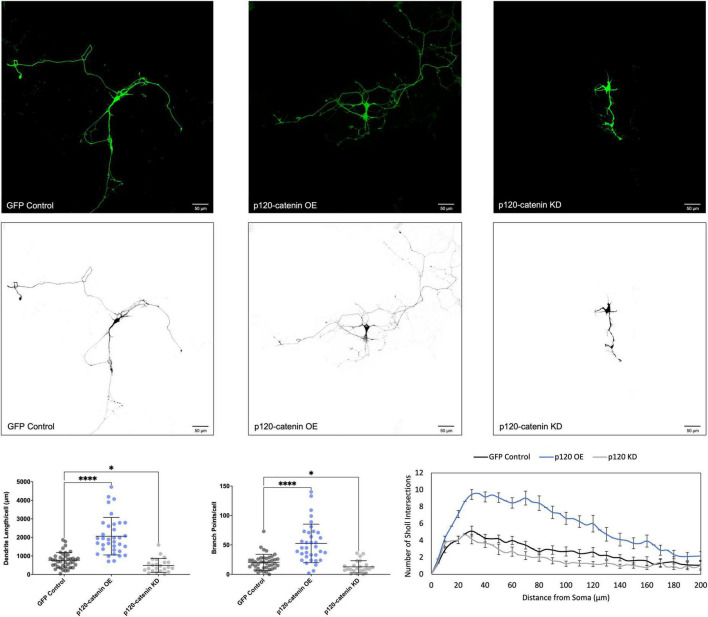
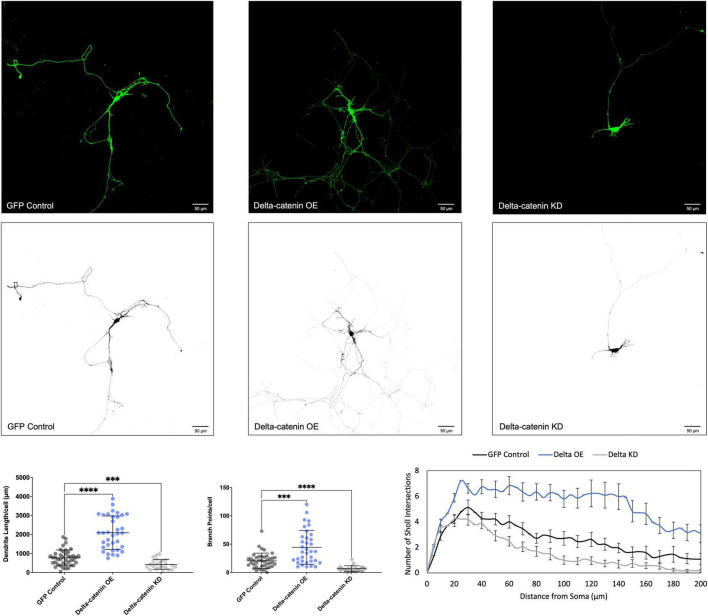
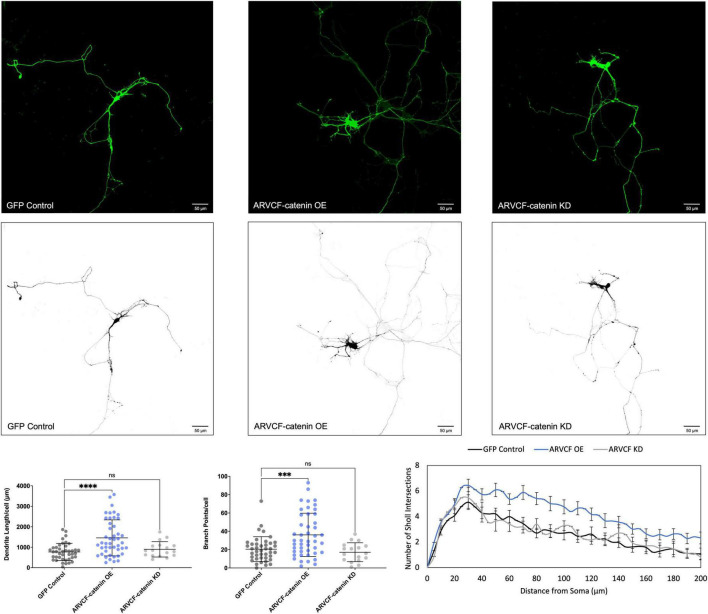
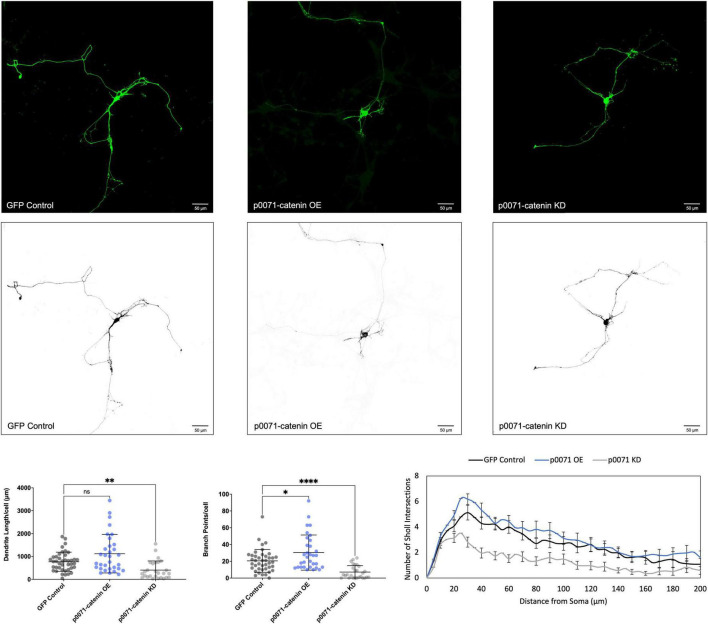
Dendritic arborization is essential for proper neuronal connectivity and function. Conversely, abnormal dendrite morphology is associated with several neurological pathologies like Alzheimer's disease and schizophrenia. Among major intrinsic mechanisms that determine the extent of the dendritic arbor is cytoskeletal remodeling. Here, we characterize and compare the impact of the four proteins involved in cytoskeletal remodeling-vertebrate members of the p120-catenin subfamily-on neuronal dendrite morphology. In relation to each of their own distributions, we find that p120-catenin and delta-catenin are expressed at relatively higher proportions in growth cones compared to ARVCF-catenin and p0071-catenin; ARVCF-catenin is expressed at relatively high proportions in the nucleus; and all catenins are expressed in dendritic processes and the soma. Through altering the expression of each p120-subfamily catenin in neurons, we find that exogenous expression of either p120-catenin or delta-catenin correlates with increased dendritic length and branching, whereas their respective depletion decreases dendritic length and branching. While increasing ARVCF-catenin expression also increases dendritic length and branching, decreasing expression has no grossly observable morphological effect. Finally, increasing p0071-catenin expression increases dendritic branching, but not length, while decreasing expression decreases dendritic length and branching. These distinct localization patterns and morphological effects during neuron development suggest that these catenins have both shared and distinct roles in the context of dendrite morphogenesis.
Keywords: catenin; dendrite branching; dendrite morphogenesis; neuron morphology; p120-catenin subfamily.
Copyright © 2023 Donta, Srivastava, Di Mauro, Paulucci-Holthauzen, Waxham and McCrea.
Conflict of interest statement
The authors declare that the research was conducted in the absence of any commercial or financial relationships that could be construed as a potential conflict of interest.
Figures
Similar articles
-
The molecular evolution of the p120-catenin subfamily and its functional associations.PLoS One. 2010 Dec 31;5(12):e15747. doi: 10.1371/journal.pone.0015747. PLoS One. 2010. PMID: 21209830 Free PMC article.
-
Dendrite-like process formation and cytoskeletal remodeling regulated by delta-catenin expression.Exp Cell Res. 2002 May 1;275(2):171-84. doi: 10.1006/excr.2002.5503. Exp Cell Res. 2002. PMID: 11969288
-
The p120 family of cell adhesion molecules.Eur J Cell Biol. 2005 Mar;84(2-3):205-14. doi: 10.1016/j.ejcb.2004.12.016. Eur J Cell Biol. 2005. PMID: 15819401 Review.
-
Shared molecular mechanisms regulate multiple catenin proteins: canonical Wnt signals and components modulate p120-catenin isoform-1 and additional p120 subfamily members.J Cell Sci. 2010 Dec 15;123(Pt 24):4351-65. doi: 10.1242/jcs.067199. Epub 2010 Nov 23. J Cell Sci. 2010. PMID: 21098636 Free PMC article.
-
Beyond regulation of cell adhesion: local control of RhoA at the cleavage furrow by the p0071 catenin.Cell Cycle. 2007 Jan 15;6(2):122-7. doi: 10.4161/cc.6.2.3741. Epub 2007 Jan 19. Cell Cycle. 2007. PMID: 17264675 Review.
Cited by
-
Role of a Pdlim5:PalmD complex in directing dendrite morphology.Front Cell Neurosci. 2024 Feb 13;18:1315941. doi: 10.3389/fncel.2024.1315941. eCollection 2024. Front Cell Neurosci. 2024. PMID: 38414752 Free PMC article.
-
Investigating the effect of Arvcf reveals an essential role on regulating the mesolimbic dopamine signaling-mediated nicotine reward.Commun Biol. 2025 Mar 13;8(1):429. doi: 10.1038/s42003-025-07837-y. Commun Biol. 2025. PMID: 40082601 Free PMC article.
-
Delta-catenin is required for cell proliferation in virus-positive Merkel cell carcinoma cell lines but not in human fibroblasts.mBio. 2025 Jun 11;16(6):e0083225. doi: 10.1128/mbio.00832-25. Epub 2025 May 23. mBio. 2025. PMID: 40407323 Free PMC article.
-
Delta-catenin is required for cell proliferation in virus positive Merkel cell carcinoma cell lines but not in human fibroblasts.bioRxiv [Preprint]. 2025 Mar 14:2025.03.12.642815. doi: 10.1101/2025.03.12.642815. bioRxiv. 2025. Update in: mBio. 2025 Jun 11;16(6):e0083225. doi: 10.1128/mbio.00832-25. PMID: 40161767 Free PMC article. Updated. Preprint.
-
Exploring the PDZ, DUF, and LIM Domains of Pdlim5 in Dendrite Branching.Int J Mol Sci. 2024 Jul 30;25(15):8326. doi: 10.3390/ijms25158326. Int J Mol Sci. 2024. PMID: 39125895 Free PMC article.
References
Grants and funding
LinkOut - more resources
Full Text Sources