

Conversion of osteoporotic-like vertebral fracture severity score to osteoporosis T-score equivalent status: A framework study for older Chinese men
- PMID: 37082356
- PMCID: PMC10111950
- DOI: 10.1016/j.afos.2023.03.004
Conversion of osteoporotic-like vertebral fracture severity score to osteoporosis T-score equivalent status: A framework study for older Chinese men
Abstract
Objectives: To define what portion of older community men with what severity of radiographic osteoporotic-like vertebral fracture (OLVF) correspond to what low T-score status.
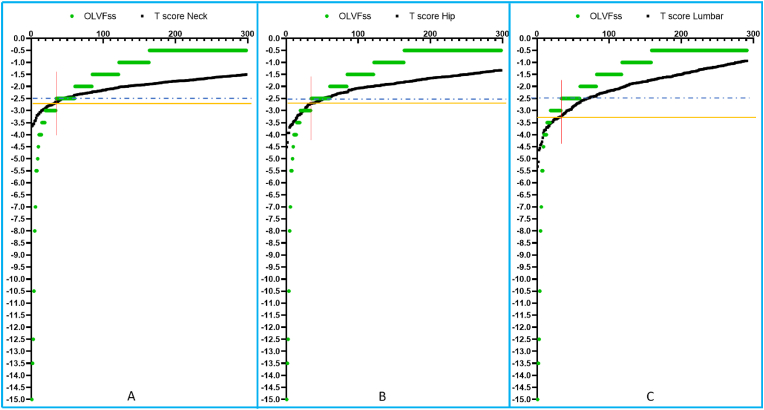
Methods: There were 755 community Chinese men (age: 76.4 ± 6.7 years) with thoracic and lumbar spine radiographs, and hip and lumbar spine bone mineral density measures. For each vertebra in a subject, a score of 0, -0.5, -1, -1.5, -2, -2.5, and -3 was assigned for no OLVF or OLVF of <20%, ≥ 20-25%, ≥ 2 5%-1/3, ≥ 1/3-40%, ≥ 40%-2/3, and ≥ 2/3 vertebral height loss, respectively. OLVFss was defined as the summed score of vertebrae T4 to L5. OLVFss and T-scores were ranked from the smallest to the largest values.
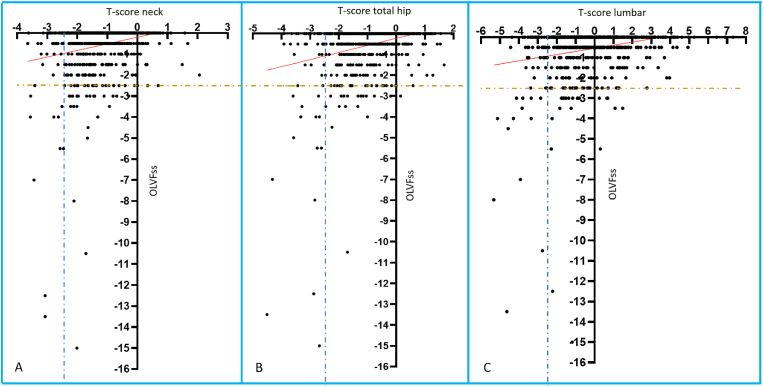
Results: OLVFss of -2, -2.5, -3, corresponded to a mean femoral neck T-score of -2.297 (range: -2.355∼-2.247), -2.494 (range: -2.637∼ -2.363), and -2.773 (range: -2.898∼-2.643), a mean hip T-score of-2.311 (range: -2.420∼-2.234), -2.572 (range: -2.708∼-2.432), -2.911 (range: -3.134∼-2.708), a mean lumbar spine T-score of -2.495 (range: -2.656∼-2.403), -2.931 (range: -3.255∼-2.664), and -3.369 (range: -3.525∼-3.258). The Pearson correlation value of OLVFss and T-score of femoral neck, hip and lumbar spine was r = 0.21, 0.26, and 0.22 (all P < 0.0001).
Conclusions: A single severe grade radiological OLVF (≥ 40% height loss) or OLVFss ≤ -2.5 suggest the subject is osteoporotic, and a single collapse grade (≥ 2/3 height loss) OLVF or OLVFss ≤ -3 meets osteoporosis diagnosis criterion. The results highlight the difficulty of diagnosing osteoporotic vertebral fractures among Chinese older men.
Keywords: Bone mineral density; Osteoporosis; Osteoporotic vertebral fracture; Spine; T-score.
© 2023 The Korean Society of Osteoporosis. Publishing services by Elsevier B.V.
Conflict of interest statement
Yi Xiang J Wang is the founder of Yingran Medicals Ltd, which develops medical image-based diagnostics software. Other authors all declare no conflicts-of-interest.
Figures
Similar articles
-
Lower osteoporotic-like vertebral fractural deformity (OLVF) prevalence and severity among older Thais and Indonesians than among older Chinese.Quant Imaging Med Surg. 2025 Jan 2;15(1):786-800. doi: 10.21037/qims-24-430. Epub 2024 Dec 2. Quant Imaging Med Surg. 2025. PMID: 39839043 Free PMC article.
-
Conversion of osteoporotic vertebral fracture severity score to osteoporosis T-score equivalent status: a framework and a comparative study of Hong Kong Chinese and Rome Caucasian older women.Arch Osteoporos. 2022 Dec 3;18(1):1. doi: 10.1007/s11657-022-01178-7. Arch Osteoporos. 2022. PMID: 36462068
-
Osteoporotic-like vertebral fracture with less than 20% height loss is associated with increased further vertebral fracture risk in older women: the MrOS and MsOS (Hong Kong) year-18 follow-up radiograph results.Quant Imaging Med Surg. 2023 Feb 1;13(2):1115-1125. doi: 10.21037/qims-2022-06. Epub 2022 Dec 1. Quant Imaging Med Surg. 2023. PMID: 36819281 Free PMC article.
-
Radiological diagnosis of prevalent osteoporotic vertebral fracture on radiographs: an interim consensus from a group of experts of the ESSR osteoporosis and metabolism subcommittee.Skeletal Radiol. 2024 Dec;53(12):2563-2574. doi: 10.1007/s00256-024-04678-4. Epub 2024 Apr 25. Skeletal Radiol. 2024. PMID: 38662094 Free PMC article. Review.
-
Radiographic Diagnosis of Osteoporotic Vertebral Fracture in Older Women and Men Based on Statistical Probability.Semin Musculoskelet Radiol. 2024 Oct;28(5):628-640. doi: 10.1055/s-0044-1788558. Epub 2024 Oct 15. Semin Musculoskelet Radiol. 2024. PMID: 39406225 Review.
Cited by
-
Lower osteoporotic-like vertebral fractural deformity (OLVF) prevalence and severity among older Thais and Indonesians than among older Chinese.Quant Imaging Med Surg. 2025 Jan 2;15(1):786-800. doi: 10.21037/qims-24-430. Epub 2024 Dec 2. Quant Imaging Med Surg. 2025. PMID: 39839043 Free PMC article.
-
Majority of hip fragility fractures among older people can be predicted by a DXA examination: an updated analysis of literature results and empirical Chinese data with a focus on the validation of the newly proposed osteofrailia criterion for men.Quant Imaging Med Surg. 2025 Jan 2;15(1):473-485. doi: 10.21037/qims-2024-2568. Epub 2024 Dec 17. Quant Imaging Med Surg. 2025. PMID: 39839001 Free PMC article.
-
Quantitative CT lumbar spine BMD cutpoint value for classifying osteoporosis among older Chinese men can be the same as that of older Chinese women, both much lower than the value for Caucasians.Skeletal Radiol. 2025 Feb;54(2):193-198. doi: 10.1007/s00256-024-04722-3. Epub 2024 Jun 21. Skeletal Radiol. 2025. PMID: 38902421 Free PMC article. Review.
-
Much lower prevalence and severity of spine degenerative changes among older Chinese women than among older Caucasian women and its implication for the interpretation of lumbar spine BMD T-score for Chinese women.Skeletal Radiol. 2024 Feb;53(2):247-251. doi: 10.1007/s00256-023-04419-z. Epub 2023 Aug 8. Skeletal Radiol. 2024. PMID: 37552249
-
Weak correlation between osteoporotic-like vertebral fracture severity and densitometric T-scores in older Chinese men.Ann Transl Med. 2023 Aug 30;11(10):374. doi: 10.21037/atm-23-639. Epub 2023 Jun 21. Ann Transl Med. 2023. PMID: 37675328 Free PMC article. No abstract available.
References
-
- Siris E.S., Genant H.K., Laster A.J., Chen P., Misurski D.A., Krege J.H. Enhanced prediction of fracture risk combining vertebral fracture status and BMD. Osteoporos Int. 2007;18:761–770. - PubMed
-
- Johansson L., Sundh D., Magnusson P., Rukmangatharajan K., Mellström D., Nilsson A.G., Lorentzon M. Grade 1 vertebral fractures identified by densitometric lateral spine imaging predict incident major osteoporotic fracture independently of clinical risk factors and bone mineral density in older women. J Bone Miner Res. 2020;35:1942–1951. - PubMed
-
- Black D.M., Arden N.K., Palermo L., Pearson J., Cummings S.R. Prevalent vertebral deformities predict hip fractures and new vertebral deformities but not wrist fractures. Study of Osteoporotic Fractures Research Group. J Bone Miner Res. 1999;14:821–828. - PubMed
-
- Eastell R., Rosen C.J., Black D.M., Cheung A.M., Murad M.H., Shoback D. Pharmacological management of osteoporosis in postmenopausal women: an endocrine society∗ clinical practice guideline. J Clin Endocrinol Metab. 2019;104:1595–1622. - PubMed
LinkOut - more resources
Full Text Sources
